Retail dashboard building fails when dashboards are designed for reporting upward instead of helping store managers act in the moment. A store manager does not need a data museum. They need a fast, trusted operational view that tells them what is happening now, what needs attention next, and what action will improve performance during the current shift.
For retail leaders, the business value is straightforward: better dashboards drive faster decisions, fewer stockouts, stronger labor efficiency, cleaner execution of promotions, and more consistent store performance across locations. For store managers, the value is even more immediate. A useful dashboard reduces guesswork.
This guide breaks down how to build a practical, high-adoption retail dashboard that works on the store floor, not just in headquarters presentations.
Why retail dashboard building often fails at the store level
Many retail dashboards are built around executive reporting requirements: month-to-date sales, regional comparisons, high-level margin trends, and broad store rankings. Those metrics matter, but they rarely help a manager decide what to do at 11:30 a.m. when traffic spikes, a promoted item is running low, and checkout lines are growing.
That mismatch is where most retail dashboard building breaks down.
At the store level, managers need operational visibility tied to decisions they can make during a shift. If the dashboard shows too many metrics, updates too slowly, or lacks clear context, daily adoption collapses. Teams go back to spreadsheets, text messages, and intuition.
Common signs of dashboard failure include:
- Dashboard overload: Too many charts, filters, and widgets competing for attention
- Stale metrics: Data refreshes too slowly to support live retail operations
- Low daily adoption: Managers only open the dashboard when someone from HQ asks
- No action path: Metrics are visible, but no one knows what to do when performance changes
- Inconsistent definitions: Stores calculate the same KPI differently, making comparisons unreliable
In fast-moving retail environments, a useful dashboard has three defining traits:
- It is quick to scan
- It is trusted
- It leads directly to action
If it takes more than a minute to understand or requires explanation every time it is used, it is not built for store operations.
Step 1: Define the decisions store managers need to make every day
The most effective retail dashboard building process starts with decisions, not charts. Before choosing visuals or data sources, identify the daily decisions store managers are responsible for.
Map the dashboard to real in-store decisions
A store manager typically makes repeated operational decisions across the day. Your dashboard should support those exact choices.
Common in-store decisions include:
- Staffing: Should labor be moved from the back room to checkout? Is a shift adjustment needed?
- Replenishment: Which items need immediate shelf refill? Which fast sellers are at risk of stockout?
- Promotions: Is the promotional display converting as expected? Does inventory support the campaign?
- Customer flow: Are traffic spikes creating service bottlenecks? Are queues affecting conversion?
- Sales recovery: Which categories or departments are underperforming versus plan today?
- Exception handling: Is there a sudden dip in transactions, traffic, or inventory accuracy that needs investigation?
A practical way to structure this is to separate urgent actions from review metrics.
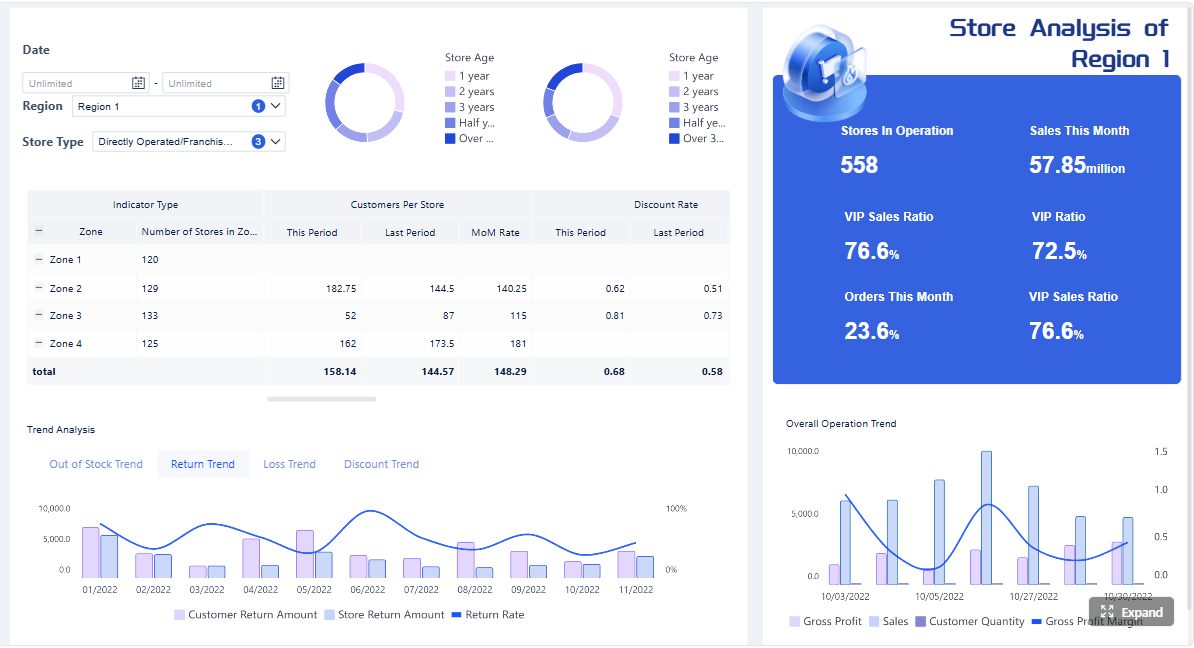 Click To Try The Dashboard
Urgent, shift-level metrics may include:
- Sales by hour
- Current conversion rate
- Queue length or service delay indicators
- Stock availability for promoted items
- Labor coverage versus traffic pattern
Weekly review metrics may include:
- Department contribution trends
- Sell-through by campaign over time
- Schedule efficiency trends
- Shrink patterns
- Staff productivity by role over multiple periods
This distinction is critical. Not everything belongs on the live dashboard.
Set clear goals for dashboard success
Next, define what success looks like. If you cannot measure dashboard usefulness, you will end up optimizing design instead of business impact.
A store-level dashboard should usually improve a small number of outcomes, such as:
- Faster manager response to performance issues
- Lower out-of-stock frequency
- Better labor deployment during peak periods
- Higher promotional execution quality
- Improved sales conversion at key hours
Keep the target outcomes focused. A dashboard that tries to improve everything usually improves nothing.
Key Metrics (KPIs) to define dashboard success
Use a tight KPI framework for the dashboard itself and the store outcomes it should influence:
- Daily Active Usage: How often store managers open and use the dashboard during operational hours
- Time to Insight: How quickly a manager can identify an issue after opening the dashboard
- Action Rate: The percentage of alerts or exceptions that result in a documented action
- Stockout Reduction: Change in stockout incidents for priority SKUs or promoted items
- Labor Efficiency: Sales or transactions achieved per labor hour
- Decision Cycle Speed: Time between issue detection and manager response
- Conversion Improvement: Change in the percentage of visitors who make a purchase
- Exception Resolution Rate: Share of flagged issues resolved within the intended timeframe
These KPIs help anchor the retail dashboard building process to outcomes that matter operationally.
Step 2: Choose the metrics that actually drive action
A dashboard should not be a complete record of retail performance. It should be a decision tool. That means every metric must answer one question: What should the manager do next?
Focus on a small set of operational KPIs
For most stores, a small set of operational KPIs is enough to drive daily action. Prioritize metrics that are timely, understandable, and directly linked to manager behavior.
A strong starting KPI set includes:
- Sales by hour: Shows pace versus target and highlights slow or peak trading periods
- Conversion rate: Reveals whether traffic is turning into transactions
- Average basket size: Helps identify upsell performance and product attachment opportunities
- Stock availability: Shows whether key products are on shelf and sellable
- Labor productivity: Tracks sales, transactions, or service output per labor hour
These KPIs are useful because they support immediate action. By contrast, vanity metrics may look important but rarely guide shift-level decisions.
Examples of vanity metrics include:
- Broad social sentiment scores with no store-level relevance
- Too many long-range benchmark comparisons
- Corporate-level summary indices without local actionability
- Excessive historical trend charts with no threshold or target context
In retail dashboard building, less is often more. A concise dashboard with six strong KPIs will outperform a bloated dashboard with twenty weak ones.
Match each metric to an action
Every KPI should have a clear action rule. If the number moves, the manager should know what to do without interpretation delays.
Here is a practical action-mapping framework:
- Sales by hour below target: Reposition staff, check product availability, inspect display compliance, review conversion trend
- Conversion rate down with normal traffic: Investigate service levels, queue times, fitting room support, or customer engagement
- Average basket size below expected range: Reinforce cross-sell prompts, feature bundles, or reset impulse product placement
- Stock availability dropping: Trigger replenishment, validate backroom stock, escalate transfer needs
- Labor productivity weak: Adjust break timing, move staff to high-traffic areas, rebalance floor coverage
Add thresholds and simple status indicators such as:
- Green for on target
- Amber for attention needed
- Red for action required now
This reduces guesswork and makes the dashboard usable under pressure.

Step 3: Design the retail dashboard building process around speed and clarity
If store managers cannot scan the dashboard in under a minute, adoption will suffer. Good dashboard design is not about visual creativity. It is about cognitive efficiency.
Make the layout easy to scan in under a minute
Structure the dashboard by operational workflow, not by data source. That means grouping metrics based on how managers think and act during a shift.
A practical top-to-bottom layout may look like this:
- Immediate alerts and exceptions
- Sales performance
- Inventory and stock risk
- Staffing and labor coverage
- Customer experience or traffic indicators
This sequence works because it reflects store reality. Managers first need to know if anything requires immediate attention. Then they need to understand commercial performance, inventory constraints, workforce alignment, and customer impact.
Design principles that improve speed:
- Put the most time-sensitive metrics at the top
- Keep the number of widgets limited
- Avoid deep navigation for core actions
- Use fixed positions so managers build visual habits
- Show current status against target, not raw numbers alone
Use visuals that support quick decisions
In retail dashboard building, simple visuals usually win. Managers do not need decorative complexity. They need clarity under time pressure.
Best visual choices include:
- Line charts for hourly trend movement
- Bar charts for target versus actual comparisons
- Status cards for headline KPIs
- Alerts and icons for exceptions
- Heatmaps for time-period or zone-level hotspots, if easy to interpret
Avoid visuals that slow interpretation, such as:
- 3D charts
- Dense scatterplots without clear business meaning
- Overly segmented donut charts
- Multi-axis charts that require explanation
Consistency matters just as much as chart selection. Keep labels, color logic, and filter behavior consistent across the dashboard. If red means risk in one view, it should not mean strong performance elsewhere.
Step 4: Connect reliable data sources and keep the numbers trusted
No amount of design can save a dashboard that people do not trust. In store environments, trust is built on timely, consistent, and validated data.
Bring together core retail systems
A useful store dashboard usually pulls from several operational systems. The most common sources are:
- POS systems for transactions, sales, units, and basket metrics
- Inventory systems for stock on hand, replenishment, and availability
- Labor scheduling tools for staffing plans and worked hours
- Traffic counters or customer flow tools for visitor trends and conversion context
The key is not to connect every system possible. Connect the systems required to support the decisions you identified in Step 1.
Refresh timing should reflect operational needs:
- Near real-time or frequent refresh for sales by hour, stock risk, and traffic-sensitive metrics
- Daily refresh for metrics used in opening reviews or end-of-day summaries
- Weekly refresh for trend and performance coaching views
The right refresh frequency depends on how quickly managers need to respond.
Create rules for data quality
Retail dashboard building often fails because definitions drift across stores. One location counts stock availability one way, another excludes certain SKUs, and a third uses delayed inventory data. The result is confusion and skepticism.
To prevent that, define governance rules early.
Key data quality controls include:
- Standard KPI definitions: Ensure every store measures the same metric the same way
- Data completeness checks: Flag missing feeds or partial loads
- Latency monitoring: Detect when data is delayed beyond acceptable thresholds
- Anomaly detection: Catch unusual spikes or drops that may signal bad data
- Store comparability rules: Normalize calculations where store formats differ
Core Elements of a trusted retail dashboard
A trusted operational dashboard should include these core elements:
- Single Definition of Each KPI: No ambiguity in how sales, conversion, or stock availability is calculated
- Visible Refresh Timestamp: Managers can see how current the data is
- Threshold Logic: Clear rules for what counts as normal, warning, or critical
- Exception Flags: Automated indicators for missing, delayed, or suspicious data
- Role-Based Access: Managers only see the views relevant to their responsibilities
- Cross-System Validation: Key metrics align across POS, inventory, and labor systems where expected
If managers question the numbers every day, the dashboard has already failed.
Step 5: Test the dashboard with real store managers before rollout
Retail dashboards should be validated in live operating conditions, not just reviewed in conference rooms. Store managers will reveal friction points quickly when using the dashboard during actual routines.
Observe how managers use it during actual routines
Watch managers interact with the dashboard at the moments that matter most:
- At opening, when they assess overnight sales, staffing, and stock readiness
- Mid-shift, when traffic, labor, and conversion pressure are highest
- At close, when they review execution and prepare handoff notes
During testing, pay attention to:
- Where they pause or hesitate
- Which metrics they skip
- Which filters they never use
- What additional context they ask for
- Whether they can explain what action they would take from each KPI
These observations are more valuable than abstract design feedback. They show whether the dashboard supports operational thinking.
Refine the dashboard based on feedback
Once you have usage feedback, simplify aggressively.
Common refinements include:
- Removing widgets that nobody uses
- Renaming metrics with plain retail language
- Simplifying filter structures
- Moving high-priority KPIs to more visible positions
- Improving mobile or tablet usability for floor-based access
A dashboard that works on a desktop in the back office but fails on a tablet during a shift is not truly store-ready.
Step 6: Train for adoption and build dashboard habits
Even the best dashboard will underperform if managers are not trained to act on it. Adoption depends on habit formation, not just system access.
Show managers how to turn insights into action
Training should be practical and scenario-based. Do not teach the dashboard as software. Teach it as a decision tool.
Use short scenarios such as:
- Conversion drops during a traffic increase
- A promoted item begins to stock out by midday
- Labor is misaligned with customer flow
- Basket size falls below target despite stable transactions
For each scenario, make three things explicit:
- What metric signals the issue
- What immediate action is expected
- What can wait for end-of-day or weekly review
This reduces hesitation and increases confidence in the dashboard.
Build the dashboard into daily store routines
The dashboard becomes valuable when it is built into operating cadence.
Embed usage into routines such as:
- Morning huddles
- Shift handoffs
- Midday performance checks
- End-of-day reviews
- District leader coaching calls
District and regional leaders also play a role. They should reinforce consistent use by asking simple, action-oriented questions:
- What changed since the last check?
- Which KPI triggered action today?
- What issue is still unresolved?
- What store support is needed?
This keeps dashboard use tied to accountability and operational improvement.

Step 7: Improve the dashboard over time as store needs change
Retail operations change constantly. Product mix, promotions, staffing models, seasonal traffic, and store priorities all shift. A dashboard must evolve without becoming unstable.
Review what is working and what is ignored
A mature retail dashboard building process includes regular review of actual usage and impact.
Look for patterns such as:
- Which sections are viewed most often
- Which KPIs frequently trigger action
- Which widgets are consistently ignored
- Whether current metrics still align with store priorities
- Whether managers are using workarounds outside the dashboard
This analysis helps you remove clutter and focus on what drives performance.
Create a lightweight update process
Do not rebuild the dashboard every quarter. Use a lightweight update cycle that maintains familiarity while improving relevance.
A strong update process includes:
- Scheduled KPI relevance reviews
- Minor layout refinements based on usage patterns
- Controlled introduction of new metrics
- Clear version communication to store teams
- Minimal disruption to existing habits
The goal is continuous improvement without forcing managers to relearn the tool too often.
Build retail dashboard building into a scalable operating system with FineBI
At this point, the pattern should be clear: effective retail dashboard building is not just a design task. It requires KPI discipline, operational alignment, reliable data integration, user testing, training, and continuous refinement.
That is exactly why building this manually is complex.
For enterprise retailers, trying to assemble all of this through spreadsheets, disconnected BI layers, and one-off reporting logic creates unnecessary friction. It slows deployment, increases definition conflicts, and makes store-level adoption harder than it should be.
This is where FineBI becomes the practical solution.
With FineBI, retail teams can use ready-made templates and automate this entire workflow. Instead of starting from scratch, you can accelerate dashboard deployment with structured retail reporting views, connect core systems more efficiently, standardize KPI logic, and give store managers fast, usable dashboards that support daily decisions.
FineBI helps retailers:
- Consolidate POS, inventory, labor, and traffic data into one analytics layer
- Standardize KPI definitions across stores and regions
- Build dashboards optimized for speed, clarity, and operational use
- Support self-service analysis for store, district, and regional leaders
- Scale updates and governance without rebuilding every report manually
For decision-makers, that means less dashboard maintenance and more operational consistency. For store managers, it means a dashboard they will actually use.
If your current retail dashboard building approach is producing low adoption, stale metrics, or unclear action paths, do not just redesign the interface. Rebuild the workflow around real decisions, trusted data, and scalable execution. FineBI gives you a faster path to do exactly that.
FAQs
The first view should highlight live operational metrics that drive immediate action, such as sales by hour, stock risk on key items, queue pressure, and labor coverage. If a manager cannot spot what needs attention within a minute, the dashboard is too complex.
Adoption usually drops when dashboards are overloaded, slow to refresh, or focused on head office reporting instead of shift-level decisions. Store managers will ignore tools that do not help them act quickly on the floor.
A store dashboard should focus on a small set of high-impact metrics tied to daily decisions. Too many KPIs create noise and make it harder for managers to identify the next best action.
Track both usage and business outcomes, such as daily active usage, time to insight, action rate, stockout reduction, and labor efficiency. A useful dashboard should lead to faster responses and measurable operational improvement.
A live retail dashboard supports in-the-moment decisions during a shift, while a reporting dashboard is mainly used to review past performance and trends. Store managers need operational visibility first, not just summary reporting for leadership.


The Author
Yida YIn
FanRuan Industry Solutions Expert
Related Articles

Portfolio Reporting for PMOs: 9 Executive Metrics Every Weekly Portfolio Dashboard Should Include
Weekly portfolio reporting should help executives answer three questions fast: Are we delivering the right initiatives, are we putting outcomes at risk, and what decisions need leadership this week? For PMOs, that means
Yida Yin
Jul 01, 2026

How to Build an Investment Portfolio Reporting Dashboard for Executives: KPIs, Benchmarks, and Drill-Down Views
Investment portfolio reporting for executives is not about showing every holding, transaction, and chart your investment team can produce. It is about giving CEOs, CFOs, CIOs, boards, and investment committees a fast, re
Yida YIn
Jun 25, 2026

12 KPI Reporting Examples for Executive Dashboards: What to Show in Weekly, Monthly, and Quarterly Reviews
Executive leaders do not need more data. They need decision ready $1 examples that match how often they review the business and what actions they are expected to take. A weekly $1 should surface fast moving risks and per
Yida YIn
Jun 25, 2026