A financial dashboard gives you a clear, visual summary of your company’s key financial data—like revenue, expenses, and trends—so you can spot patterns, track performance, and make faster decisions. With dashboards, you turn numbers into actionable insights that drive your business forward.
Here are seven dashboards every modern company needs:
- Profit and Loss Financial Dashboard
- Revenue Dashboard
- Cash Flow Financial Dashboard
- Budget vs Actual Financial Dashboard
- Accounts Receivable Financial Dashboard
- Financial KPI Dashboard
- Forecasting Financial Dashboard
You know the finance world is changing fast. Many businesses run into issues like outdated systems, data management headaches, and siloed structures. FineBI steps in to help. It lets you build a cfo dashboard or a saas company dashboard, analyze data yourself, and share real-time decision support across your team. Check out how Founder Securities improved financial insights and financial performance after using FineBI.
| Feature | FineBI Dashboard | Traditional Reporting |
|---|---|---|
| Data Analysis Capability | Self-service multi-dimensional OLAP | Fixed-format reports |
| Customization | Users create custom dashboards | Limited customization options |
| Interactivity | High interactivity with real-time data | Low interactivity |
| Presentation of Metrics | Key indicators on a single page | Metrics spread across multiple pages |
With FineBI, you get actionable insights when you need them most.
1.Profit and Loss Financial Dashboard
A financial dashboard is a visual tool that brings together your company’s financial data, showing key metrics and trends in one place. You get a clear overview, spot issues quickly, and make smarter decisions without digging through spreadsheets.
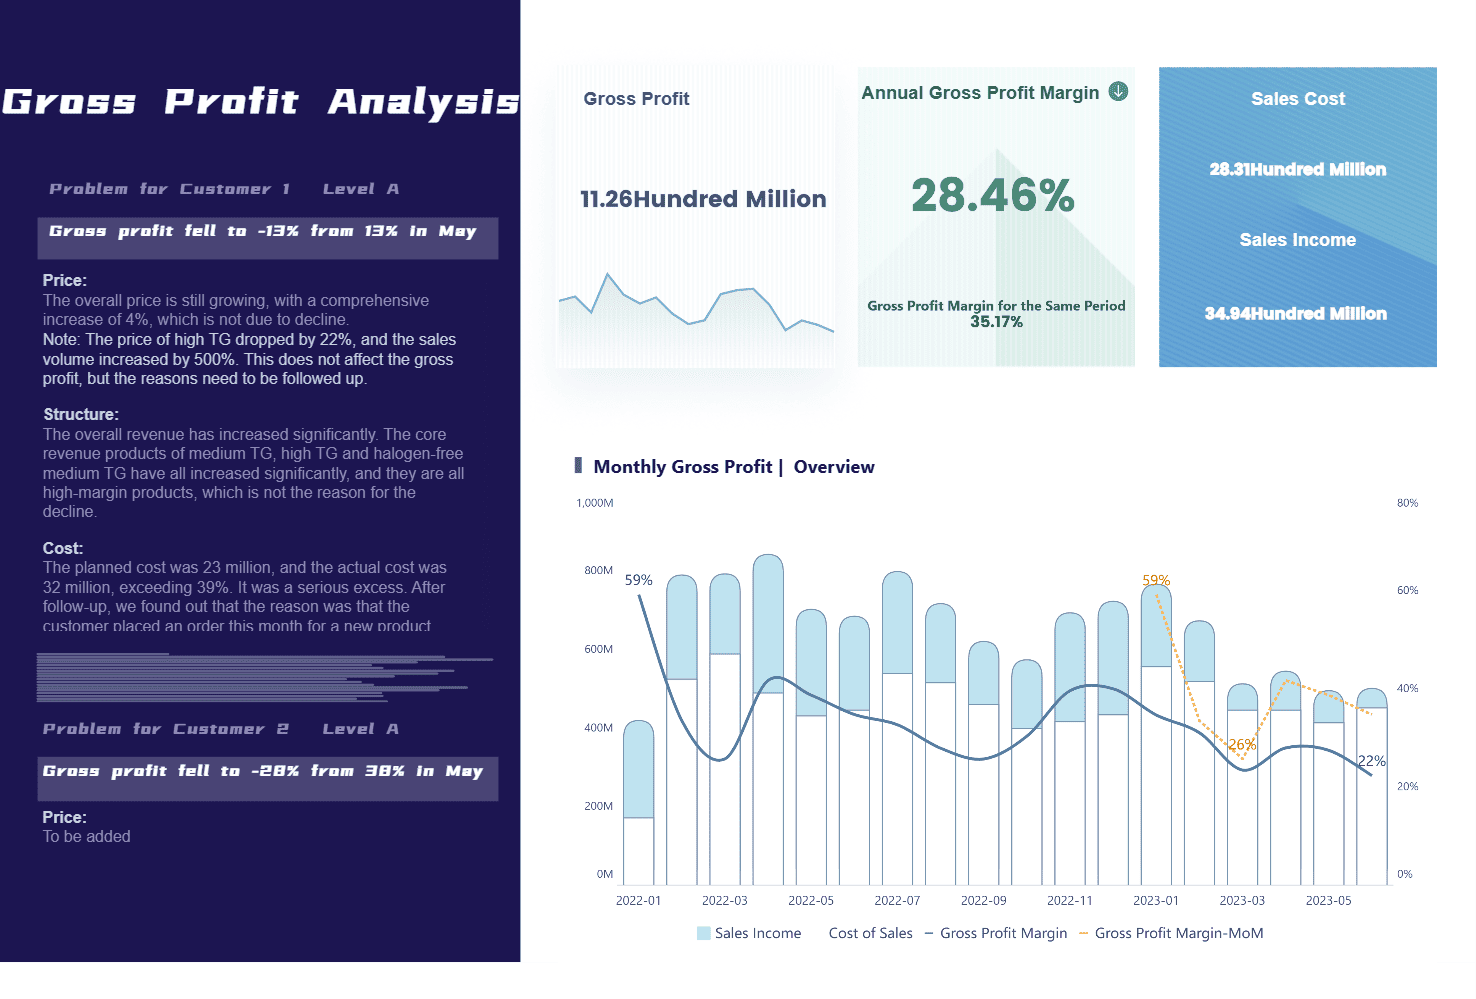
A profit and loss dashboard helps you track how your business is performing over time. You see your revenue, expenses, and net profit at a glance. This dashboard gives you the actionable insights you need to manage costs, boost profits, and stay ahead of problems.
Key Metrics
Here are the most important metrics you’ll want to see on your financial dashboard:
- Revenue: Break it down by product, service, or region for deeper analysis.
- Operating expenses: Track costs like rent, utilities, salaries, and marketing.
- Net profit: See your bottom-line results after all expenses.
- Net income: Find out what’s left after taxes and dividends.
- Net operating income: Focus on earnings from your main operations.
- Cost of goods sold: Measure profit after production costs.
Tip: Comparing these metrics with your balance sheet dashboard helps you understand your overall financial health.
FineBI Features
FineBI makes it easy to build a financial performance dashboard that pulls in data from all your sources. You don’t need to wait for IT. FineBI’s data engine connects to databases, spreadsheets, and cloud systems, so you get real-time updates and multi-dimensional analysis. You can automate data collection, visualize trends with charts and tables, and uncover hidden cost drivers. FineBI lets you create a cfo dashboard that supports proactive financial management. You get a single view of your financial data, making it simple to spot patterns and act fast.
| Feature | Benefit for You |
|---|---|
| Real-time updates | Always see the latest numbers |
| Automated collection | Save time and reduce manual errors |
| Visualizations | Make decisions with clear charts |
| Multi-source analysis | Get a complete picture of performance |

With FineBI, you turn your financial dashboard into a powerful tool for actionable insights.
2.Revenue Dashboard
A financial dashboard is a visual tool that helps you track, analyze, and understand your company’s financial data in real time, making it easier to spot trends and make smart decisions.
You want to know how your business is growing. A revenue dashboard gives you a clear view of your income streams, so you can see what’s working and where you need to adjust. When you monitor revenue trends, you react faster to market changes and stay ahead of the competition. Real-time revenue monitoring boosts your decision-making speed and helps you solve problems before they get out of hand.
Did you know? Companies using real-time insights are 2.2 times more likely to outperform competitors in revenue growth and customer satisfaction.
Metrics to Track
Your revenue dashboard should show the numbers that matter most. Here are some key metrics you’ll want to track:
- Total revenue
- Revenue by product or service
- Revenue growth rate
- Monthly Recurring Revenue (MRR)
- Annual Recurring Revenue (ARR)
- Gross margin
- Customer Acquisition Cost (CAC)
- Customer Lifetime Value (CLV)
- Churn rate
- Net revenue retention
Tracking these metrics helps you understand your revenue stability and business health. SaaS companies especially rely on MRR, ARR, CAC, CLV, and churn rate to measure ongoing performance.
| Metric | Why It Matters |
|---|---|
| Total Revenue | Shows overall business growth |
| MRR/ARR | Tracks recurring income |
| CAC/CLV | Measures customer value and cost |
| Churn Rate | Reveals customer retention |
| Growth Rate | Highlights expansion or decline |
FineBI Capabilities
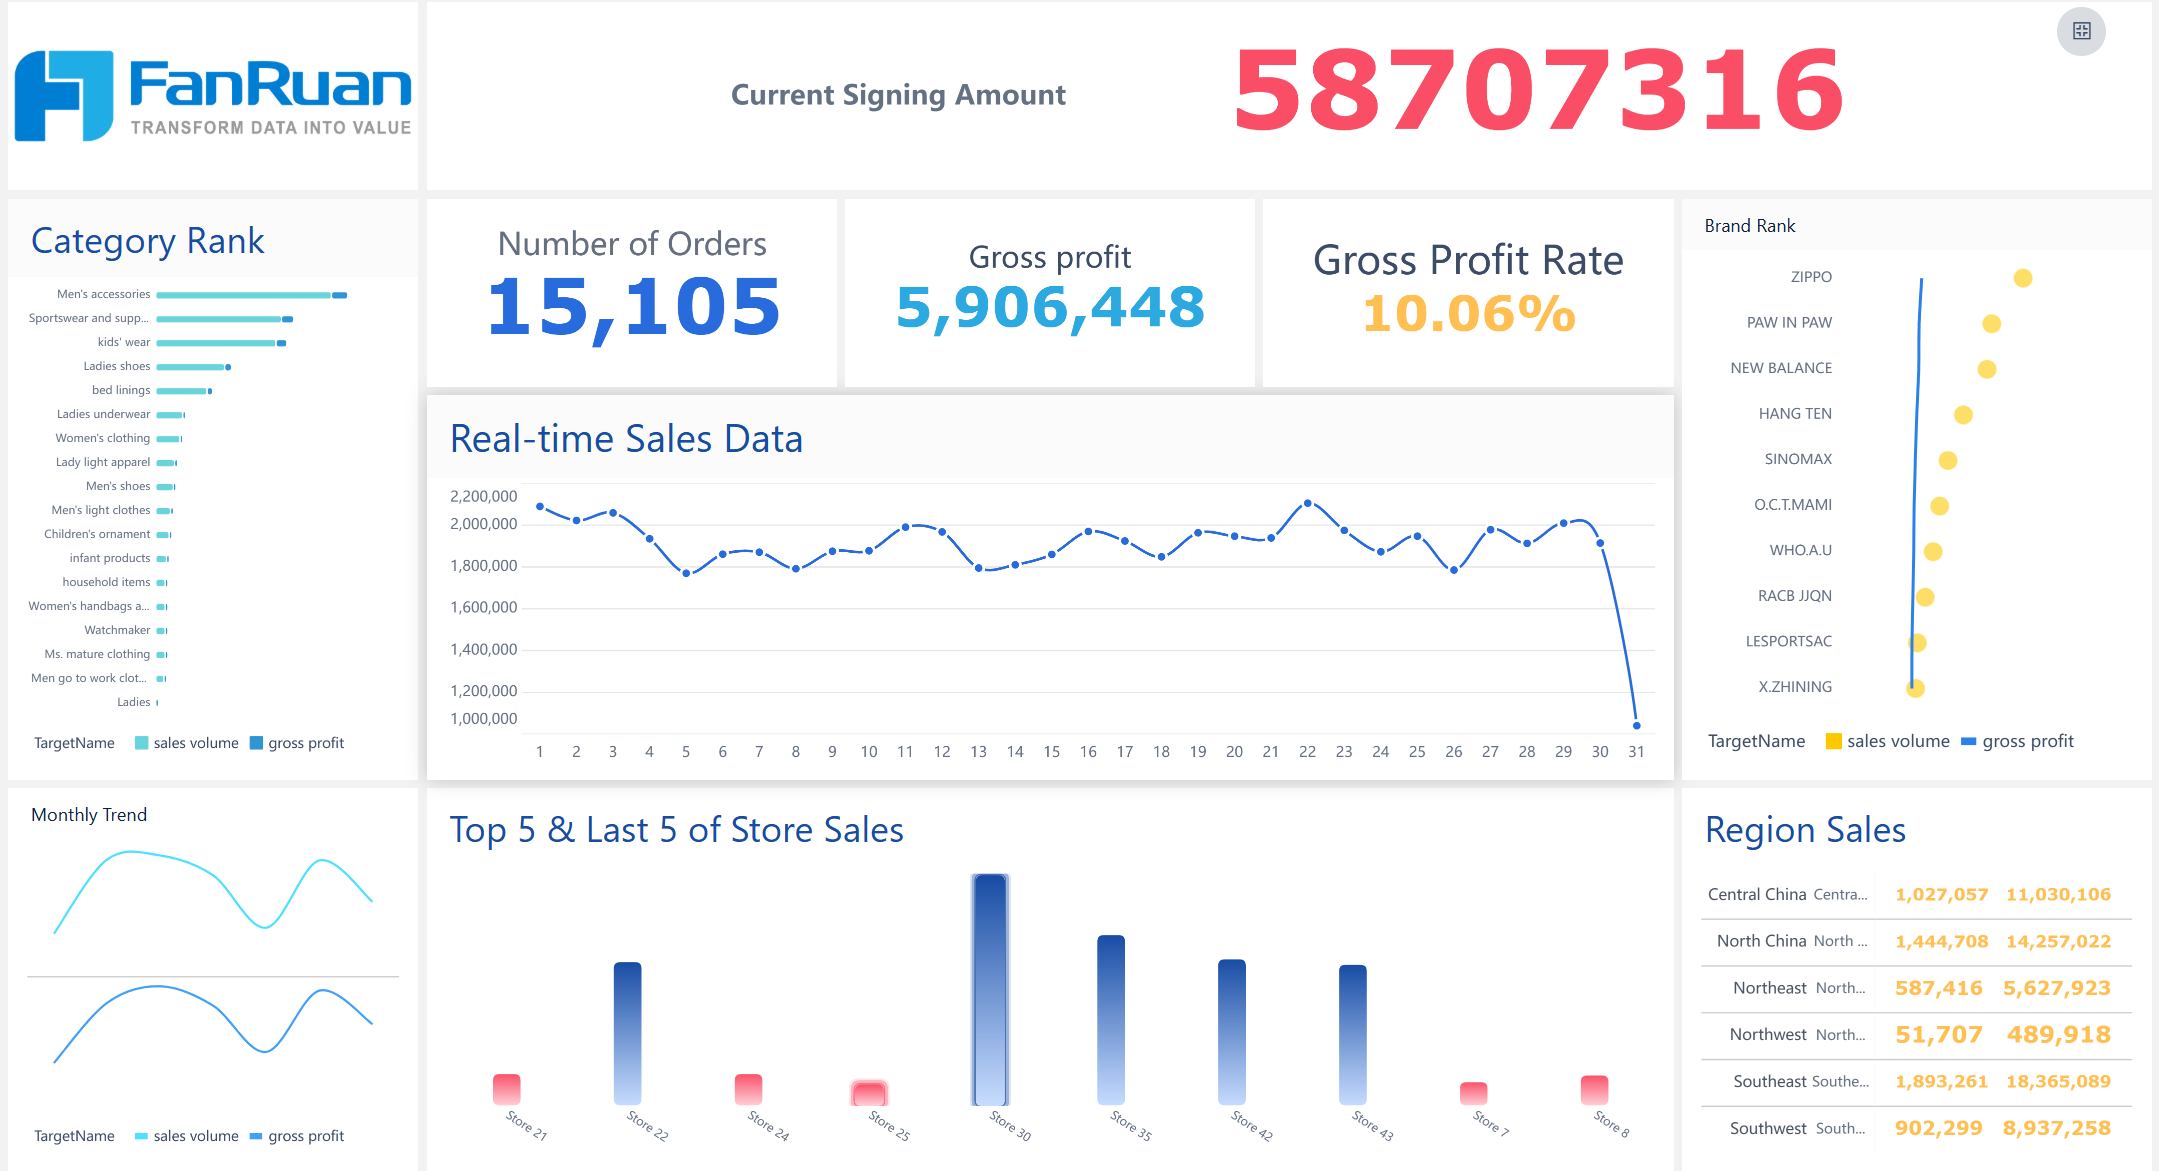
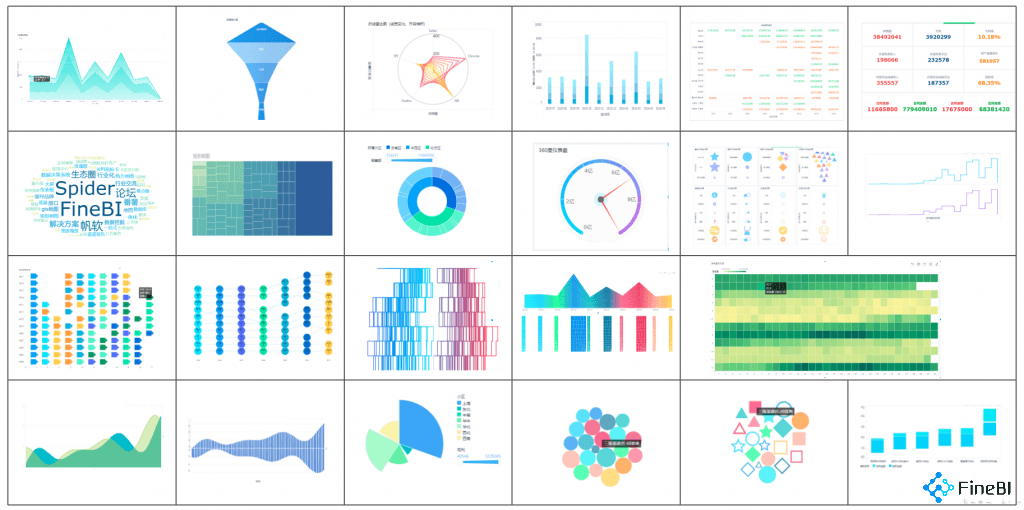
FineBI makes building a revenue dashboard simple. You can connect multiple data sources, like databases and spreadsheets, and see everything in one place. The drag-and-drop interface lets you create custom reports fast. FineBI processes financial data in real time, so you always work with the latest numbers. You get over 50 chart types, plus tools for drilling down and filtering your data. The powerful computing engine handles large datasets with ease.
- Create custom dashboards with advanced visualizations
- Integrate data from different systems for a complete view
- Analyze trends instantly with real-time updates
- Drill down into details and filter by product, region, or time
A cfo dashboard built with FineBI helps you compare revenue with your balance sheet dashboard, giving you a full picture of your company’s financial health.

3.Cash Flow Financial Dashboard
Cash flow is the lifeblood of your business. If you want to stay ahead, you need to know exactly how much money comes in and goes out. A cash flow dashboard helps you manage liquidity, spot risks, and plan for the future. You see your financial health in real time, which means you can act fast when things change.
Essential Metrics
When you build a cash flow dashboard, focus on the numbers that matter most. Here are some key metrics you should track:
- Cash Flow From Operations: Shows how much cash your core business activities generate.
- Working Capital: Tells you if you have enough resources to cover short-term obligations.
- Days Sales Outstanding: Measures how quickly you collect payments from customers.
- Days Payable Outstanding: Tracks how long you take to pay suppliers.
- Accounts Receivable Turnover: Reveals how efficiently you collect money owed.
- Accounts Payable Turnover: Shows how quickly you pay your bills.
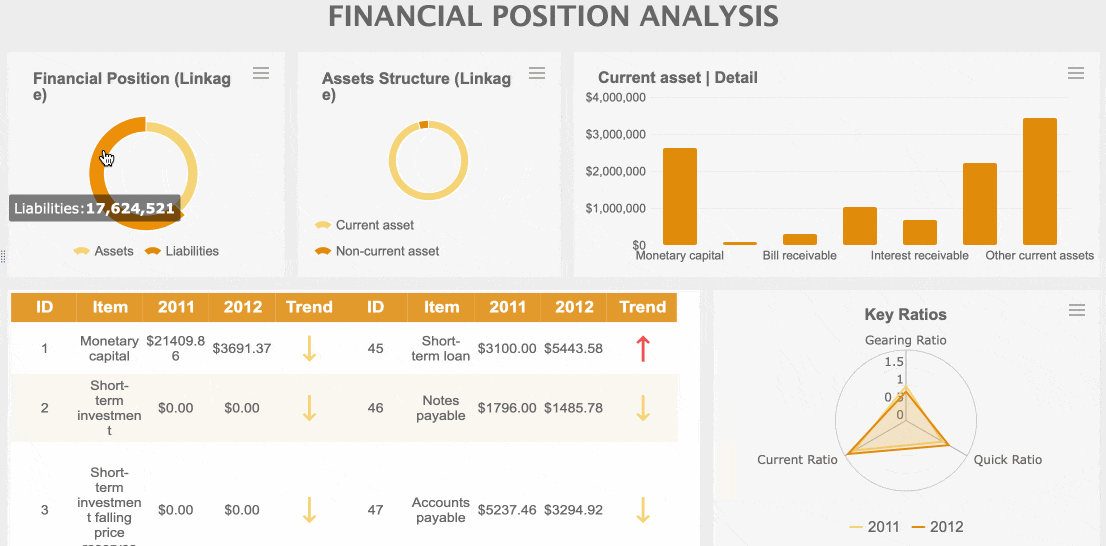
- Current Ratio: Compares assets to liabilities for a snapshot of financial stability.
- Free Cash Flow: Indicates how much cash you have after expenses.
- Cash Flow Coverage Ratio: Assesses your ability to meet financial commitments.
Tip: Compare these metrics with your balance sheet dashboard to get a full picture of your company’s financial position.
A cash flow dashboard gives you real-time insights into cash inflows and outflows. You can analyze historical data, model different scenarios, and develop contingency plans. Tracking these KPIs helps you avoid surprises and keep your business running smoothly.
FineBI Integration
FineBI makes cash flow monitoring simple and powerful. You see every payment and expense as they happen. The platform connects to all your financial data sources, so you get immediate visibility. FineBI’s real-time alerts flag unusual patterns in cash outflows, letting you adjust spending or vendor terms before problems grow.
- You can automate the monitoring of key indicators, which means less time scanning spreadsheets and more time solving big issues.
- FineBI sends timely alerts to stakeholders when critical thresholds are reached, so everyone stays informed.
- The cfo dashboard in FineBI helps you take quick action to prevent cash flow issues and keep your business healthy.

AI-powered features identify trends and flag risks early. You can use predictive analytics to anticipate future challenges and adjust your strategies based on current financial data. FineBI improves productivity and helps you make decisions faster, so you never lose sight of your cash position.
4.Budget vs Actual Financial Dashboard
Ever wonder if your spending matches your plans? A budget vs actual financial dashboard helps you compare what you planned to spend with what you actually spent. You see where you’re on track and where you need to adjust. This dashboard gives you a clear view of your financial health and helps you stay accountable.
Comparison Metrics
You want to know how your actual results stack up against your budget. Here are some common metrics you’ll find on a financial performance dashboard:
| Technique Type | Description |
|---|---|
| Percentage Variance Formula | Calculates the percentage difference between actual and budgeted amounts. |
| Dollar Variance Formula | Shows the absolute difference between actual and budgeted amounts. |
| Budget Variance Reports | Compares actual results to budgeted amounts and explains variances. |
| Trend Analysis Reports | Analyzes historical performance to spot patterns over time. |
| Cash Flow Reports | Illustrates the inflow and outflow of cash within the business. |
You can also track metrics like customer acquisition cost, conversion rates, and return on ad spend. Running monthly reports helps you catch overages or shortfalls early, so you can make smart decisions and keep your cfo dashboard up to date.
Tip: Tracking actual performance against your budget improves transparency and accountability. You get real-time insights that help you plan for long-term success.
FineBI Analysis Tools
FineBI makes it easy to analyze budget vs actual figures. You don’t need to code or wait for IT. With FineBI’s self-service tools, you build dashboards using a drag-and-drop interface. You get real-time updates, so your financial dashboard always shows the latest numbers.
| Feature | Description |
|---|---|
| Drag-and-drop GUI | Build complex visualizations without coding. |
| Real-time data processing | See immediate updates and analyze data as soon as it changes. |
| Integrated ETL tools | Prepare and clean data for easy budget vs actual analysis. |
| Robust data modeling | Handle complex relationships for deeper insights. |

FineBI lets you drill down into details, filter by department or time period, and uncover the reasons behind variances. You can share dashboards with your team, so everyone stays informed and can act fast. This helps you manage your financial data efficiently and keep your business moving forward.
5.Accounts Receivable Financial Dashboard
A financial dashboard is a visual tool that brings together your most important financial data, helping you track trends, spot issues, and make better decisions quickly.
You want your business to get paid on time. Tracking accounts receivable (AR) is the key to keeping your cash flow healthy and your operations running smoothly. If you let invoices pile up, you might struggle to cover bills or miss growth opportunities. That’s why a cfo dashboard with strong AR tracking is so valuable.
Here’s a quick look at why AR matters:
| Key Area | Explanation |
|---|---|
| Cash flow and working capital | Every unpaid invoice means less cash for daily expenses. Tracking AR keeps your business liquid. |
| Business health | Late payments can signal bigger problems. Regular AR checks help you spot risks early. |
| Benchmarks and goals | Setting AR targets helps your team focus and improve collections. |
You control how fast you turn sales into cash. Delays in collecting payments can hurt your working capital, even if your profits look good on paper. Consistent AR tracking helps you avoid unpaid invoices turning into losses.
AR Metrics
When you build a financial dashboard for AR, focus on these key metrics:
- Days Sales Outstanding (DSO): Shows how long it takes to collect payments.
- Aging Buckets: Groups receivables by how overdue they are.
- Collection Effectiveness Index (CEI): Measures how well your team collects money owed.
- Average Days Delinquent (ADD): Tracks how long invoices stay overdue.
- Top Customers by Outstanding Balance: Helps you prioritize follow-ups.
- Payment Pattern Analysis: Spots changes in customer payment habits.
- Invoice Status Overview: Lets you see which invoices are paid, pending, or disputed.
Tracking these metrics gives you a clear picture of your AR process and helps you act before small issues become big problems.
FineBI Visualization
FineBI makes AR analysis simple and powerful. You can connect all your data sources, clean up messy records, and build interactive dashboards without coding. FineBI’s drag-and-drop tools let you create charts and tables that show overdue invoices, customer payment trends, and collection rates in real time. You can filter by customer, region, or time period to find the details you need fast. Sharing your AR dashboard with your team keeps everyone on the same page and helps you reach your collection goals.

6.Financial KPI Dashboard
A financial dashboard is a visual tool that brings together your company’s key numbers, making it easy to track performance, spot trends, and make smart decisions—all in one place.
You want to know if your business is heading in the right direction. That’s where key performance indicators come in. A kpi overview dashboard helps you keep an eye on the numbers that matter most. You get a clear view of your financial health, so you can act quickly and confidently.
KPI Examples
Here are some of the most important KPIs you’ll want to track on your cfo dashboard:
- Revenue growth
- EBITDA margin
- Gross profit margin
- Net profit margin
- Compound annual growth rate (CAGR)
- Budget variance
- Return on assets
- Operating cash flow
- Working capital
- Debt to equity
- Current ratio
- Quick ratio
- Earnings before interest, taxes, depreciation, and amortization (EBITDA)
- Accounts payable turnover
- Days sales outstanding (DSO)
- Return on equity
Tip: Monitoring these KPIs gives you accurate, up-to-date data for informed decisions. You spot issues early and adjust before they become big problems.
KPIs turn complex financial data into actionable insights. They guide you through tough choices and help you stay focused on your goals.
FineBI Collaboration
FineBI makes it easy to build and share a financial dashboard that fits your needs. You can customize your kpi overview dashboard with drag-and-drop tools. You choose the metrics, set up real-time updates, and share dashboards across teams. Everyone stays on the same page.
- FineBI lets you collaborate with your team, so you can discuss results and plan next steps together.
- You can set up role-based access, keeping sensitive data secure while sharing key insights.
- The platform supports mobile access, so you check your dashboard anywhere, anytime.

With FineBI, your financial dashboard becomes a compass for your business. You get real-time feedback and long-term direction, helping you make smarter decisions every day.
7.Forecasting Financial Dashboard
A financial dashboard gives you a real-time, visual summary of your company’s key numbers, helping you track performance and make smarter decisions fast.
You want to know what’s coming next for your business. A forecasting financial dashboard helps you look ahead, plan for changes, and avoid surprises. With this dashboard, you can spot trends, test different scenarios, and make decisions that keep your company on track.
Forecasting dashboards play a big role in planning and risk management. Here’s why you need one:
- You can model different financial scenarios and see how choices might affect your future.
- You track historical data to spot trends and create more accurate forecasts.
- Real-time insights let you adjust your strategy quickly, so you can minimize risks and grab new opportunities.
- You get a deep look at your financial data, which helps you see possible future outcomes based on different assumptions.
- You can explore the impact of decisions before you make them, which is key for smart planning.
- You forecast cash positions and spot risks early, so you can act before problems grow.
- You get actionable intelligence that helps you make quick, informed decisions—even under pressure.
Forecast Metrics
When you build a forecasting dashboard, you want to track the right numbers. Here are some of the most important metrics to include:
| Metric | Description |
|---|---|
| Monthly balance sheet summary | Shows a summary of your balance sheet and compares it to previous months. |
| Monthly trend in net assets | Tracks how your net assets change over time. |
| Actual vs budgeted revenue | Compares what you earned to what you planned. |
| Profit & Loss summary | Summarizes profits and losses, with comparisons to budget and last month. |
| Actual vs budgeted employee headcount | Shows if your staffing matches your plan. |
| Profit margin | Measures how much profit you make from your revenue. |
| Revenue per employee | Tells you how efficiently your team generates income. |
You might also want to track:
- EBITDA
- Cash-to-cash cycle time
- Total manufacturing cost per unit (excluding materials)
- Net operation profit
- Net return on assets
These key performance indicators help you see where your business stands and where it’s headed. A good kpi overview dashboard brings all these numbers together, so you can make better plans.
FineBI Predictive Tools
FineBI makes forecasting easy and powerful. You can use its predictive analytics to spot trends and forecast future results. The platform lets you model different scenarios, so you can see what might happen if you change your strategy.
- FineBI connects to all your data sources, so you always work with the latest numbers.
- You can drag and drop to build custom forecasting dashboards—no coding needed.
- The system uses AI to analyze patterns and predict what’s next.
- You can test “what-if” scenarios and see the impact of different choices before you act.
- FineBI’s real-time updates mean you can react fast when things change.
With FineBI, you turn your forecasting financial dashboard into a tool that helps you plan ahead, manage risks, and keep your business moving forward.
Choosing the Right Financial Dashboard
A financial dashboard is a visual tool that brings together your most important financial data, letting you track performance, spot trends, and make smarter decisions—all in one place.
Choosing the Right Financial Dashboard
Needs Assessment
Choosing the right dashboard starts with knowing what your business needs. Here’s how you can match your goals to the right solution:
- Set clear objectives. Decide if you want to optimize cash flow, boost profitability, or improve forecasting.
- Pick tools that fit your team. Look for platforms like FineBI that work with your current systems and feel familiar.
- Make sure your data is accurate. Use automated data entry and real-time syncing to keep numbers up to date.
- Design dashboards that are easy to use. Customizable layouts help you focus on the metrics that matter most.
- Review and update regularly. Check your dashboard often to keep it relevant as your business grows.
Tip: The best dashboard is the one your team actually uses. Keep it simple, clear, and focused on your top priorities.
FineBI Success Story
FineBI stands out for its flexibility and ease of use. Founder Securities, a leading financial services company, transformed its operations with FineBI. Over 2,000 employees now access and analyze data independently. This shift improved decision-making, streamlined workflows, and supported a major merger without disrupting daily business.
When you roll out a new dashboard, follow these best practices:
| Best Practice | Description |
|---|---|
| User Customization | Let users save and share their own dashboard setups. |
| Real-time Data Updates | Make sure everyone sees the latest numbers instantly. |
| Mobile Responsiveness | Give access on any device, anywhere. |
| Data Integration | Bring together data from all your sources for a complete view. |
| User Interface Design | Keep layouts clean and information easy to find. |
| Data Visualization | Use the right charts to tell your story clearly. |
| Security Measures | Protect sensitive information with strong permissions. |
| User Feedback | Ask for feedback and improve your dashboard over time. |
FineBI makes it easy to implement these steps, so your financial dashboard becomes a powerful tool for your whole team.
A financial dashboard is a visual tool that shows your company’s key numbers in one place. You get clear insights, spot trends, and make smarter choices for your business. FineBI helps you track performance, predict patterns, and collaborate with your team.
| Key Feature | Description |
|---|---|
| Improved Integration | Connects data from different systems |
| Scalability | Grows with your needs |
| Customization | Fits your goals and preferences |
| Advanced Features | Supports deeper analysis |
| User Adoption | Easy for everyone to use |
- AI-driven analytics help you see patterns.
- Interactive dashboards make data easy to understand.
- Real-time updates keep you informed.
- Self-service tools let you explore data on your own.
- Collaboration features support teamwork.
Ready to take control? Explore FineBI’s financial dashboard solutions and see how other companies succeed.
Continue Reading About Financial Dashboard
Empower Your Business: Best Financial Reporting Tools 2025
How to Create a Financial Report Sample for Your Business
What Financial Analysis Means and Why It Matters


FAQ

The Author
Lewis
Senior Data Analyst at FanRuan
Related Articles

How to Build an Investment Portfolio Reporting Dashboard for Executives: KPIs, Benchmarks, and Drill-Down Views
Investment portfolio reporting for executives is not about showing every holding, transaction, and chart your investment team can produce. It is about giving CEOs, CFOs, CIOs, boards, and investment committees a fast, re
Yida YIn
Jun 25, 2026

12 KPI Reporting Examples for Executive Dashboards: What to Show in Weekly, Monthly, and Quarterly Reviews
Executive leaders do not need more data. They need decision ready $1 examples that match how often they review the business and what actions they are expected to take. A weekly $1 should surface fast moving risks and per
Yida YIn
Jun 25, 2026

How to Build a Digital Marketing Reports Dashboard: Executive Examples, KPIs, and Templates
A $1 is the control layer that helps executives and marketing leaders turn scattered channel data into fast, confident decisions. If you are a CEO, CMO, operations director, or marketing analytics lead, the real problem
Yida Yin
May 07, 2026