Smarter insights from report generation tools drive better business outcomes. Here are the top 10 report generation tools help you to automate analysis, detect patterns, and deliver actionable insights that improve data-driven decision-making:
- FineReport by FanRuan
- Microsoft Power BI
- Tableau
- Looker
- Domo
- Klipfolio
- Qlik Sense
- Sisense
- Supermetrics
- Databox
Recent research shows that AI-powered reporting transforms business intelligence by consolidating data and uncovering trends early. When choosing reporting tools, experts look for features such as user-friendly report design, automation, interactive dashboards, and security. These criteria ensure that report generation supports business analytics, aligns with business goals, and boosts profitability.
Quick Comparison of Report Generation Tools
Choosing the right report generation tools can make a big difference for any business. Teams want reporting tools that offer easy report design, flexible dashboard creation, and strong integration options. Let’s look at how the top solutions stack up.
Features Overview
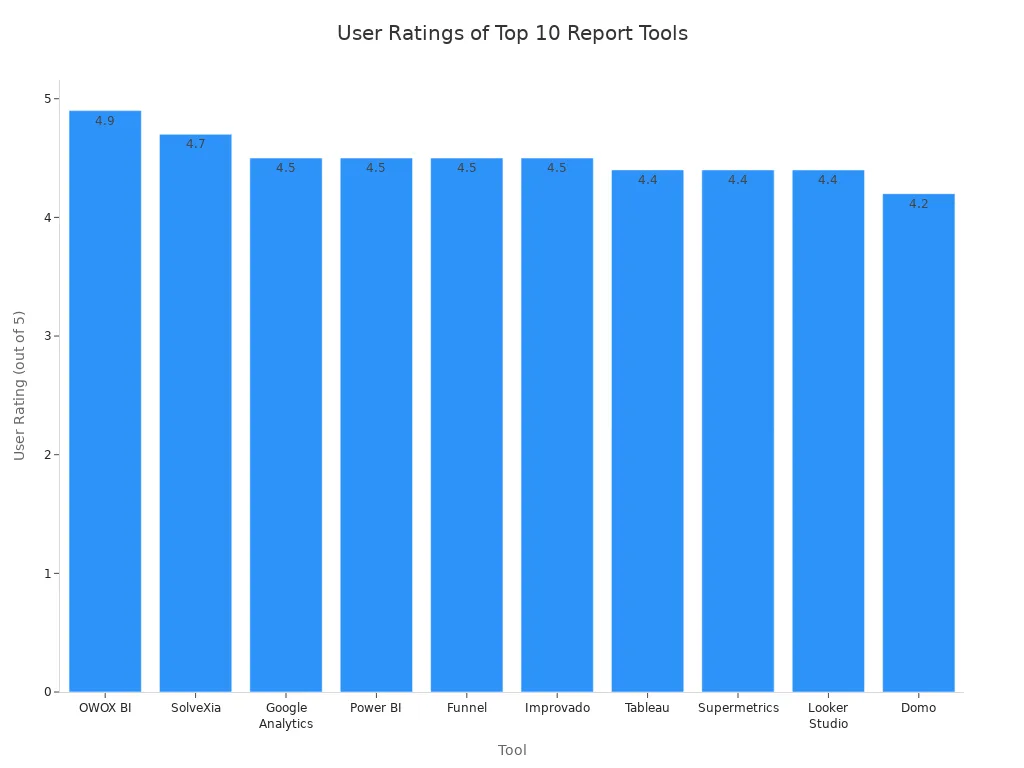
Here’s a quick table comparing the key features, pricing, best use cases, and user ratings for the leading report generation tools:
| Tool | Key Features & Strengths | Pricing Highlights | Best Use Cases | User Rating (G2Crowd) |
|---|---|---|---|---|
| FineReport | Drag-and-drop report designer, pixel-perfect reports, multi-source integration, automated scheduling, mobile dashboard | Tiered plans, free trial available | Enterprise reporting, dashboard creation, real-time analytics | 4.8/5 |
| Power BI | AI-powered analytics, seamless MS integration, interactive dashboard | Bundled with MS licensing, tiered | Enterprises using Microsoft ecosystem, business intelligence | 4.5/5 |
| Tableau | Advanced visualization, wide integration, flexible dashboard | Subscription-based, enterprise plans | Data visualization, analytics, cross-industry | 4.4/5 |
| Looker Studio | Google integration, easy-to-use, customizable reports | Free | Marketing analytics, small business reporting | 4.4/5 |
| Domo | Robust data integration, customizable dashboard, mobile BI | Subscription-based, enterprise plans | Large-scale dashboard, executive reporting | 4.2/5 |
| Klipfolio | Real-time dashboard, cloud-based, easy sharing | Tiered subscription | Marketing, sales, SMB dashboard | 4.3/5 |
| Qlik Sense | Associative engine, scenario analysis, cloud-agnostic | Tiered, enterprise pricing | Finance, pharma, complex data exploration | 4.4/5 |
| Sisense | Embedded analytics, scalable dashboard, API integration | Subscription-based | Embedded analytics, product teams | 4.3/5 |
| Supermetrics | Wide integrations, automated reporting, time-saving | Tiered subscription | Marketing, agencies, automated report generation | 4.4/5 |
| Databox | Mobile dashboard, KPI tracking, easy setup | Free plan, paid tiers | SMBs, startups, mobile reporting | 4.3/5 |
Pricing Snapshot
Report generation tools offer flexible pricing. Most reporting tools use subscription-based models with tiered plans. Some, like FineReport and Domo, provide free trials so users can test features before buying. Dynamic pricing helps businesses adjust costs based on usage. Geographic pricing lets companies pay based on their location. These options make it easier for organizations of all sizes to find a plan that fits their needs.
Tip: Always check if the reporting tool offers free trials or entry-level plans. This helps teams evaluate features and total cost before making a decision.
Best Use Cases
Each report generation tool shines in different scenarios. FineReport works well for enterprises needing complex report design and real-time dashboard analytics. Power BI fits companies using Microsoft products and needing business intelligence. Tableau stands out for data visualization across industries. Supermetrics and Klipfolio help marketing teams automate report generation and dashboard sharing. Databox is perfect for startups and SMBs that want mobile dashboard access.
Teams should match their reporting tools to their business size and industry. Finance and pharmaceutical companies often choose Qlik Sense for detailed scenario analysis. Product teams prefer Sisense for embedded analytics. The right report generation tool can boost productivity and help managers make smarter decisions.
Top 10 Report Generation Tools for 2025
1.FineReport by FanRuan
Website: https://www.fanruan.com/en/finereport
FineReport by FanRuan stands out as a leading enterprise-level reporting tool in 2025. Many businesses choose FineReport for its intuitive drag-and-drop report builder, which makes it easy to generate reports without coding. Users can create pixel-perfect documents, interactive dashboards, and complex data visualizations with just a few clicks. FineReport connects to multiple data sources, allowing teams to blend information from databases, spreadsheets, and cloud platforms.
The drag-and-drop report builder supports a wide range of report types, including cross reports, grouped reports, and master-detail reports. Teams can also automate report scheduling and distribution, ensuring that stakeholders always receive up-to-date information. FineReport’s mobile dashboard feature lets users access actionable insights on any device, making it a flexible choice for modern organizations.
FineReport’s drag-and-drop report builder empowers users to design, customize, and share reports quickly. This tool helps organizations generate reports that drive smarter decisions and deliver actionable insights across departments.
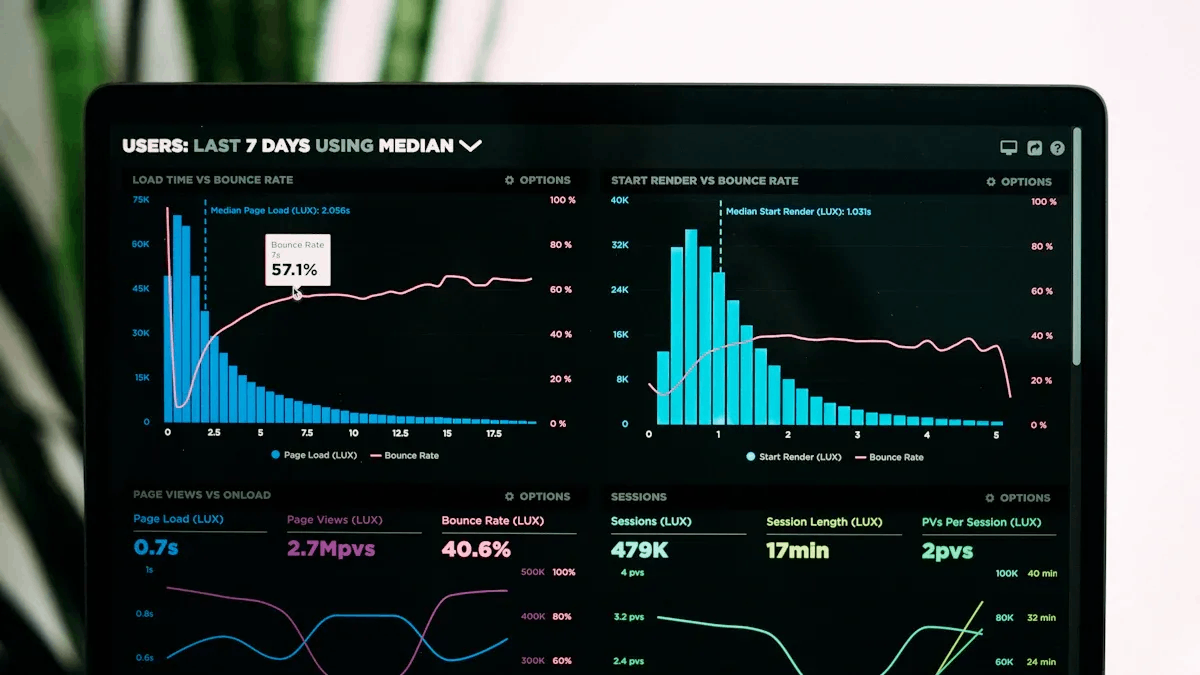
Below is a Production Comprehensive Analysis Dashboard created by FineReport.
2.Power BI

Website: https://www.microsoft.com/en-us/power-platform/products/power-bi
Power BI remains a favorite among reporting tools, especially for companies invested in the Microsoft ecosystem. In 2025, Power BI introduces several unique features that set it apart. The new Copilot experience allows users to query all accessible data, not just the current report, while respecting permissions. This makes Power BI a powerful ai report generator for organizations seeking advanced analytics.
Some standout features include:
- A drag-and-drop report builder for easy dashboard creation.
- AI Data Schema and Verified Answers for tailored, accurate AI responses.
- Automation with Translytical task flows, letting users automate actions and write back data directly from reports.
- Innovative visualizations like the Dandelion Chart and Dynamic Radial Bar Chart.
- Improved language understanding for more reliable insights.
Power BI’s blend of automation, AI, and visualization tools helps teams generate reports that are both interactive and insightful.
3.Tableau

Website: https://www.tableau.com/
Tableau is well-known for its advanced data visualization and interactive dashboard capabilities. Many users appreciate its drag-and-drop report builder, which simplifies the process of creating visually stunning reports. Tableau supports a wide range of chart types and interactive elements, making it easy to uncover trends and patterns.

However, when it comes to integration, Tableau focuses mainly on Salesforce products. This approach may require additional payment and can limit flexibility compared to other reporting tools.
| Platform | Integration Strengths | Limitations Compared to Tableau |
|---|---|---|
| Tableau | Primarily integrates with Salesforce products (CRM Analytics, Data Cloud) with extra cost required. | Limited to Salesforce ecosystem; less flexible and broader integration options. |
| Power BI | Deep integration with Microsoft products (Excel, Azure, SharePoint) enabling direct data pulls. | More flexible pricing and better vendor support. |
| Looker | Deep integration with Google Cloud Platform and open-source data technologies; semantic modeling. | More responsive customer support; stronger ecosystem integration. |
Tableau’s drag-and-drop report builder makes it a top choice for users who want to generate reports with advanced visualizations, but those needing broader integration may look elsewhere.
4.Looker Studio

Website: https://lookerstudio.google.com/navigation/reporting
Looker, part of the Google ecosystem, is a user-friendly reporting tool that appeals to both small businesses and large enterprises. Its drag-and-drop report builder allows users to create custom metrics and calculated fields, supporting detailed analysis without technical expertise.
Common use cases for Looker Studio include:
- Building interactive dashboards for marketing analytics.
- Aggregating data from multiple sources for comprehensive business insights.
- Collaborating with teams using version history and revision tracking.
- Seamless integration with Google Suite products like BigQuery and Google Sheets.
Looker Studio’s drag-and-drop report builder and integration with Google tools make it a go-to choice for marketing teams and data analysts who want to generate reports quickly and efficiently.
5.Domo
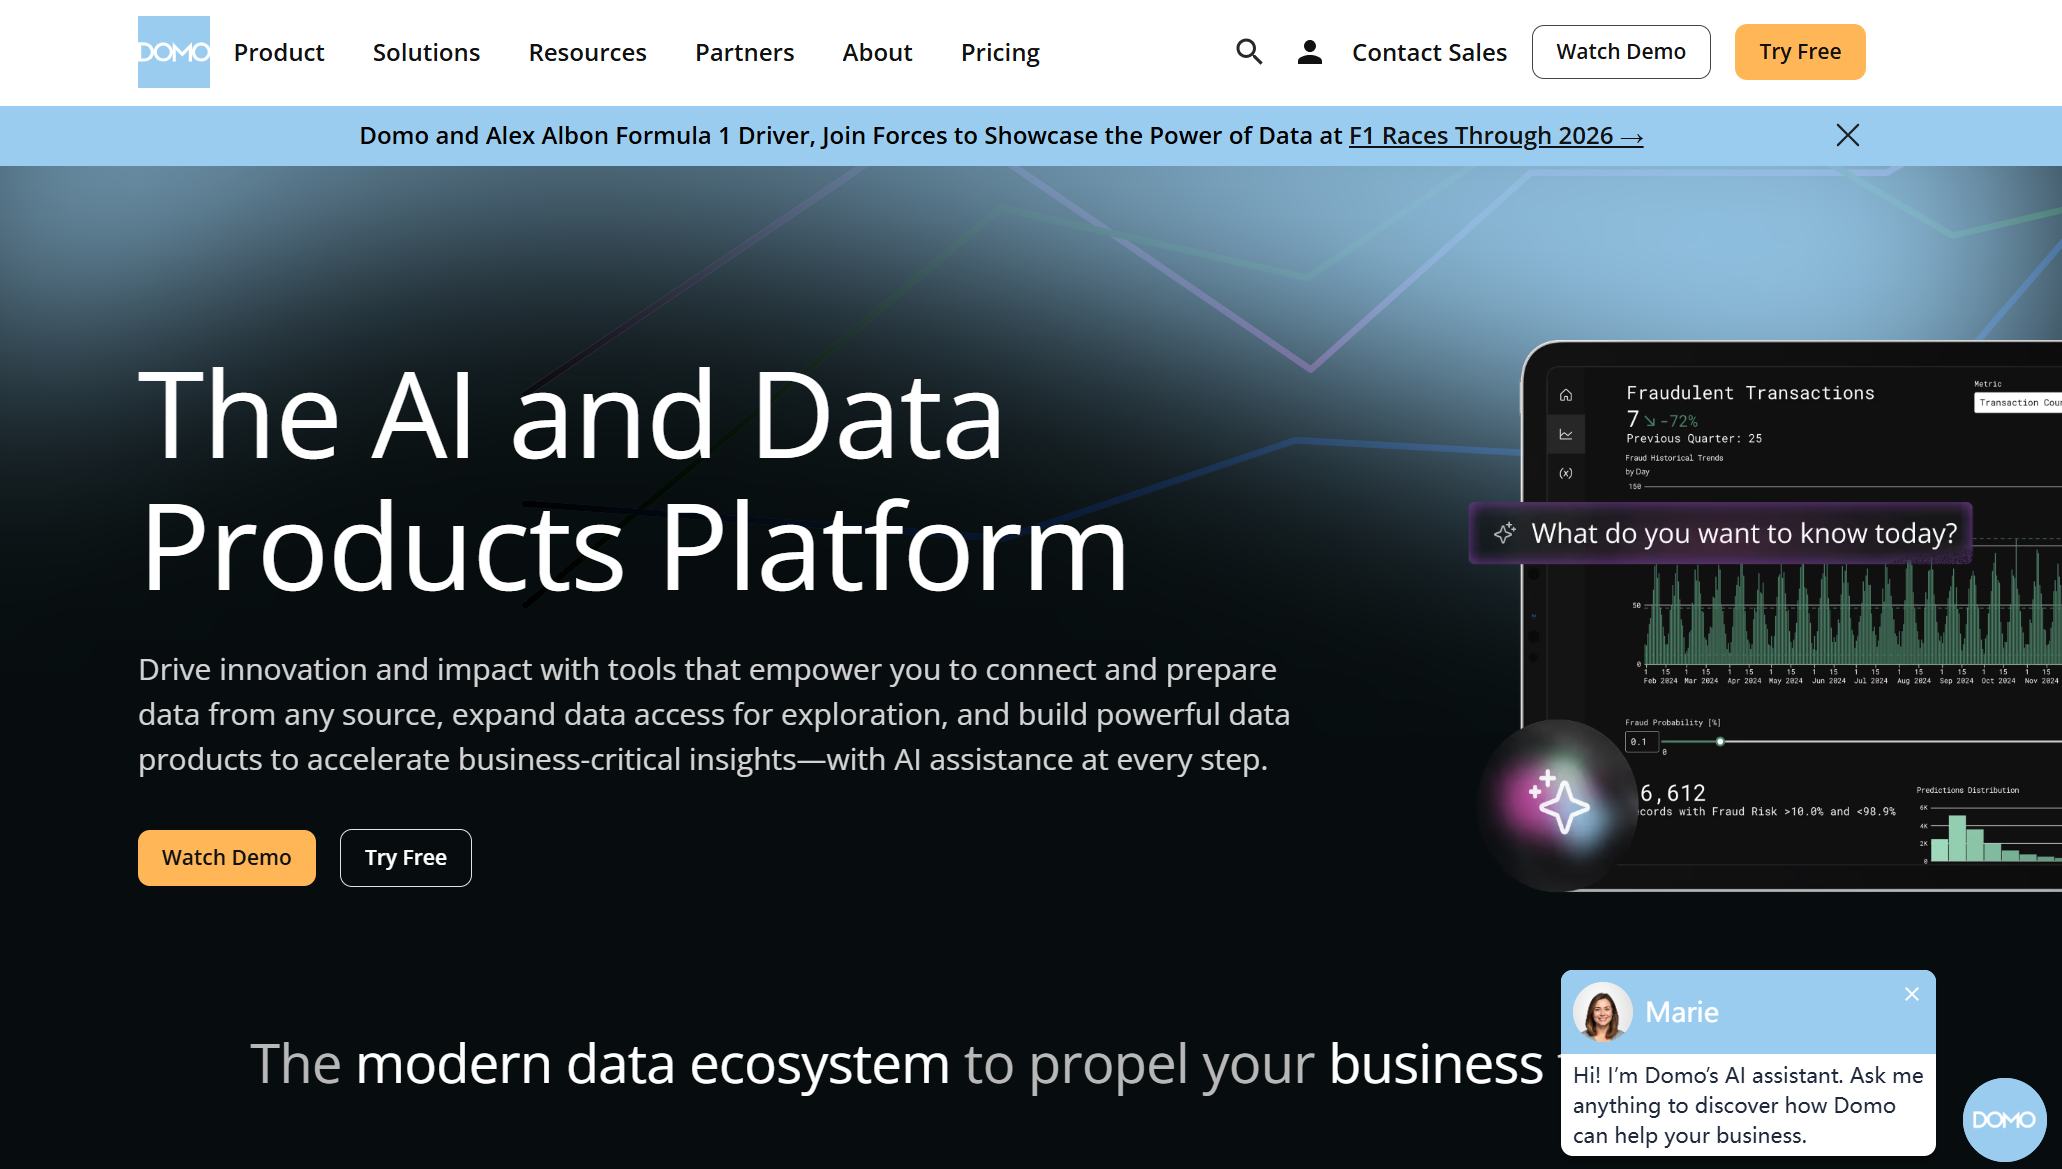
Website: https://www.domo.com/
Domo is a cloud-based platform that excels in automation and workflow integration. Its drag-and-drop report builder lets users design dashboards and reports with ease. Domo’s automation capabilities improve reporting efficiency by:
- Automating data collection, processing, and report generation with AI-powered workflows.
- Offering low-code workflow design for both technical and business users.
- Using AI Agents to execute tasks and adapt to changing business needs.
- Providing automated alerts and scheduled updates for real-time insights.
- Reducing human error and improving report accuracy.
Domo’s focus on automation and its drag-and-drop report builder help organizations generate reports faster, freeing up time for strategic analysis.
6.Klipfolio
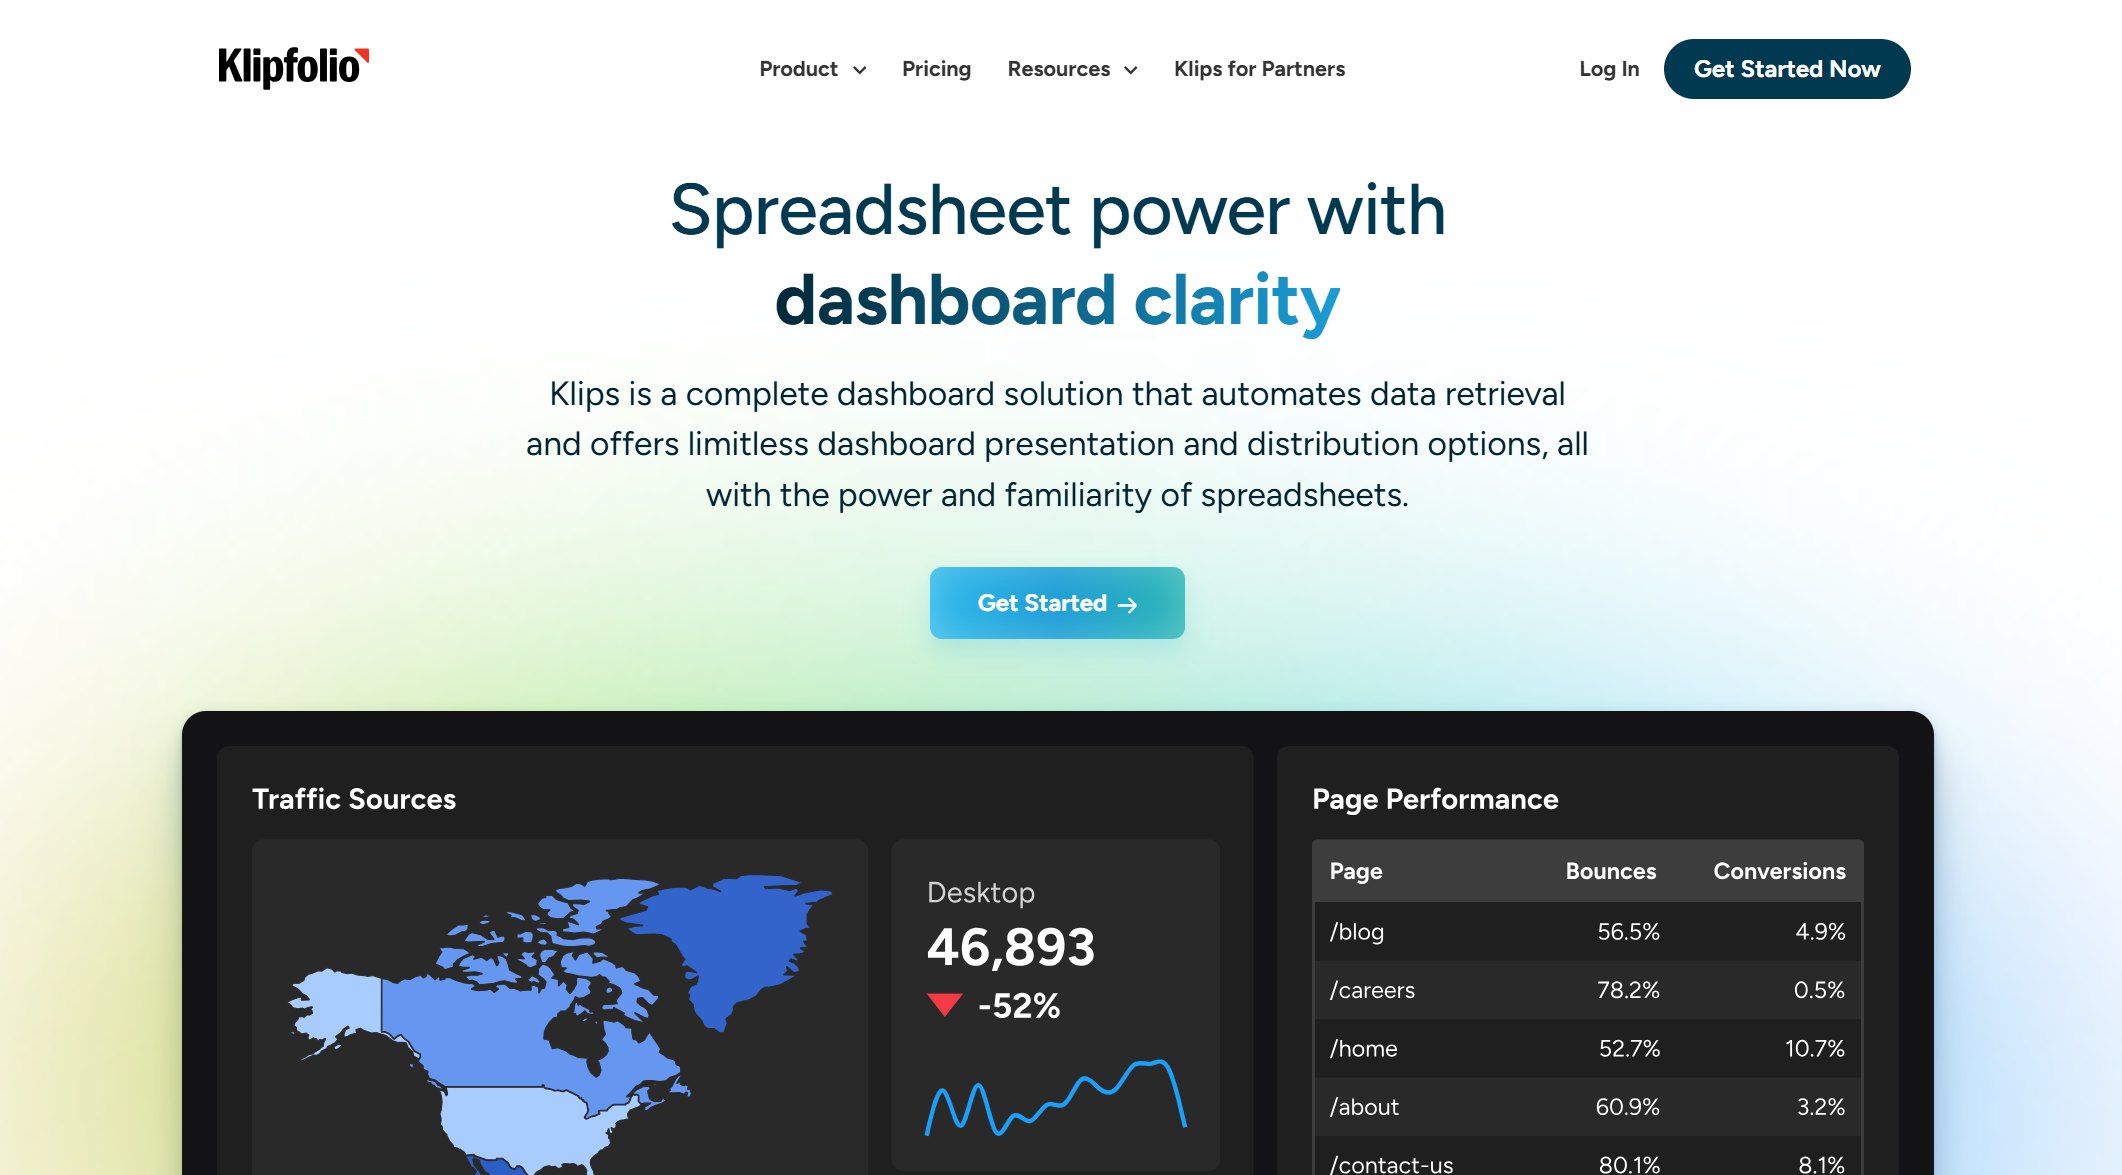
Website: https://www.klipfolio.com/
Klipfolio is a favorite among teams that need real-time data visualization. Its drag-and-drop report builder supports the creation of customizable, interactive dashboards. Klipfolio integrates with over 130 data sources, making it easy to consolidate information from different platforms.
Key advantages include:
- Powerful customization with metric-centric analytics.
- Real-time insights by consolidating data from multiple sources.
- Collaborative dashboard sharing and customization.
- An API for advanced data management and automation.
- Professional, presentation-ready visualizations.
Klipfolio’s drag-and-drop report builder and real-time dashboard features help teams track performance and uncover actionable insights quickly.
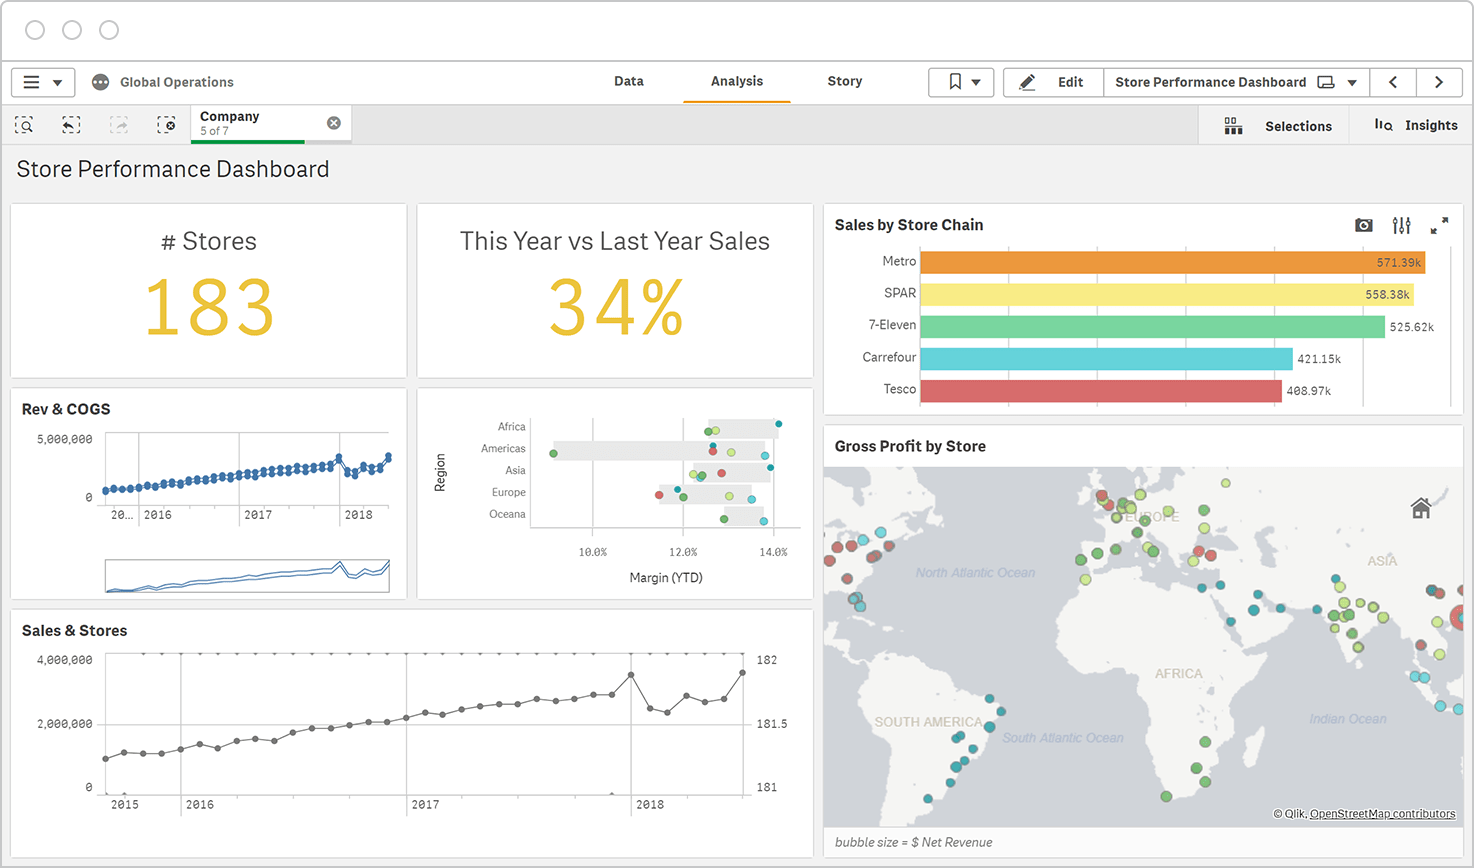
7.Qlik Sense

Website: https://www.qlik.com/us/products/qlik-sense
Qlik Sense leverages AI to enhance report generation in 2025. Its drag-and-drop report builder allows users to create interactive dashboards without advanced coding skills. Qlik Answers, a generative AI-powered assistant, provides textual explanations and insights layered on organizational data.
Qlik Sense’s AI-driven analytics automatically detect key relationships and trends, helping users generate reports that support strategy development. The platform also emphasizes data quality and governance, ensuring reliable inputs for AI processes. Qlik Sense’s drag-and-drop report builder and AI features make it a strong choice for enterprises seeking actionable insights.
8.Sisense

Website: https://www.sisense.com/
Sisense is designed for organizations that need scalable reporting solutions. Its drag-and-drop report builder supports the creation of complex reports and dashboards. Sisense unifies data from multiple sources into a centralized platform, supporting fast, real-time analysis.
Scalability features include:
- Flexible deployment options: on-premise, cloud, or hybrid.
- High-performance ElastiCube engine for large datasets.
- Embedded analytics with extensive APIs and multi-tenancy support.
- Tiered pricing and support plans for growing organizations.
Sisense’s drag-and-drop report builder and scalable architecture make it ideal for enterprises with technical teams and expanding data needs.

9.Supermetrics
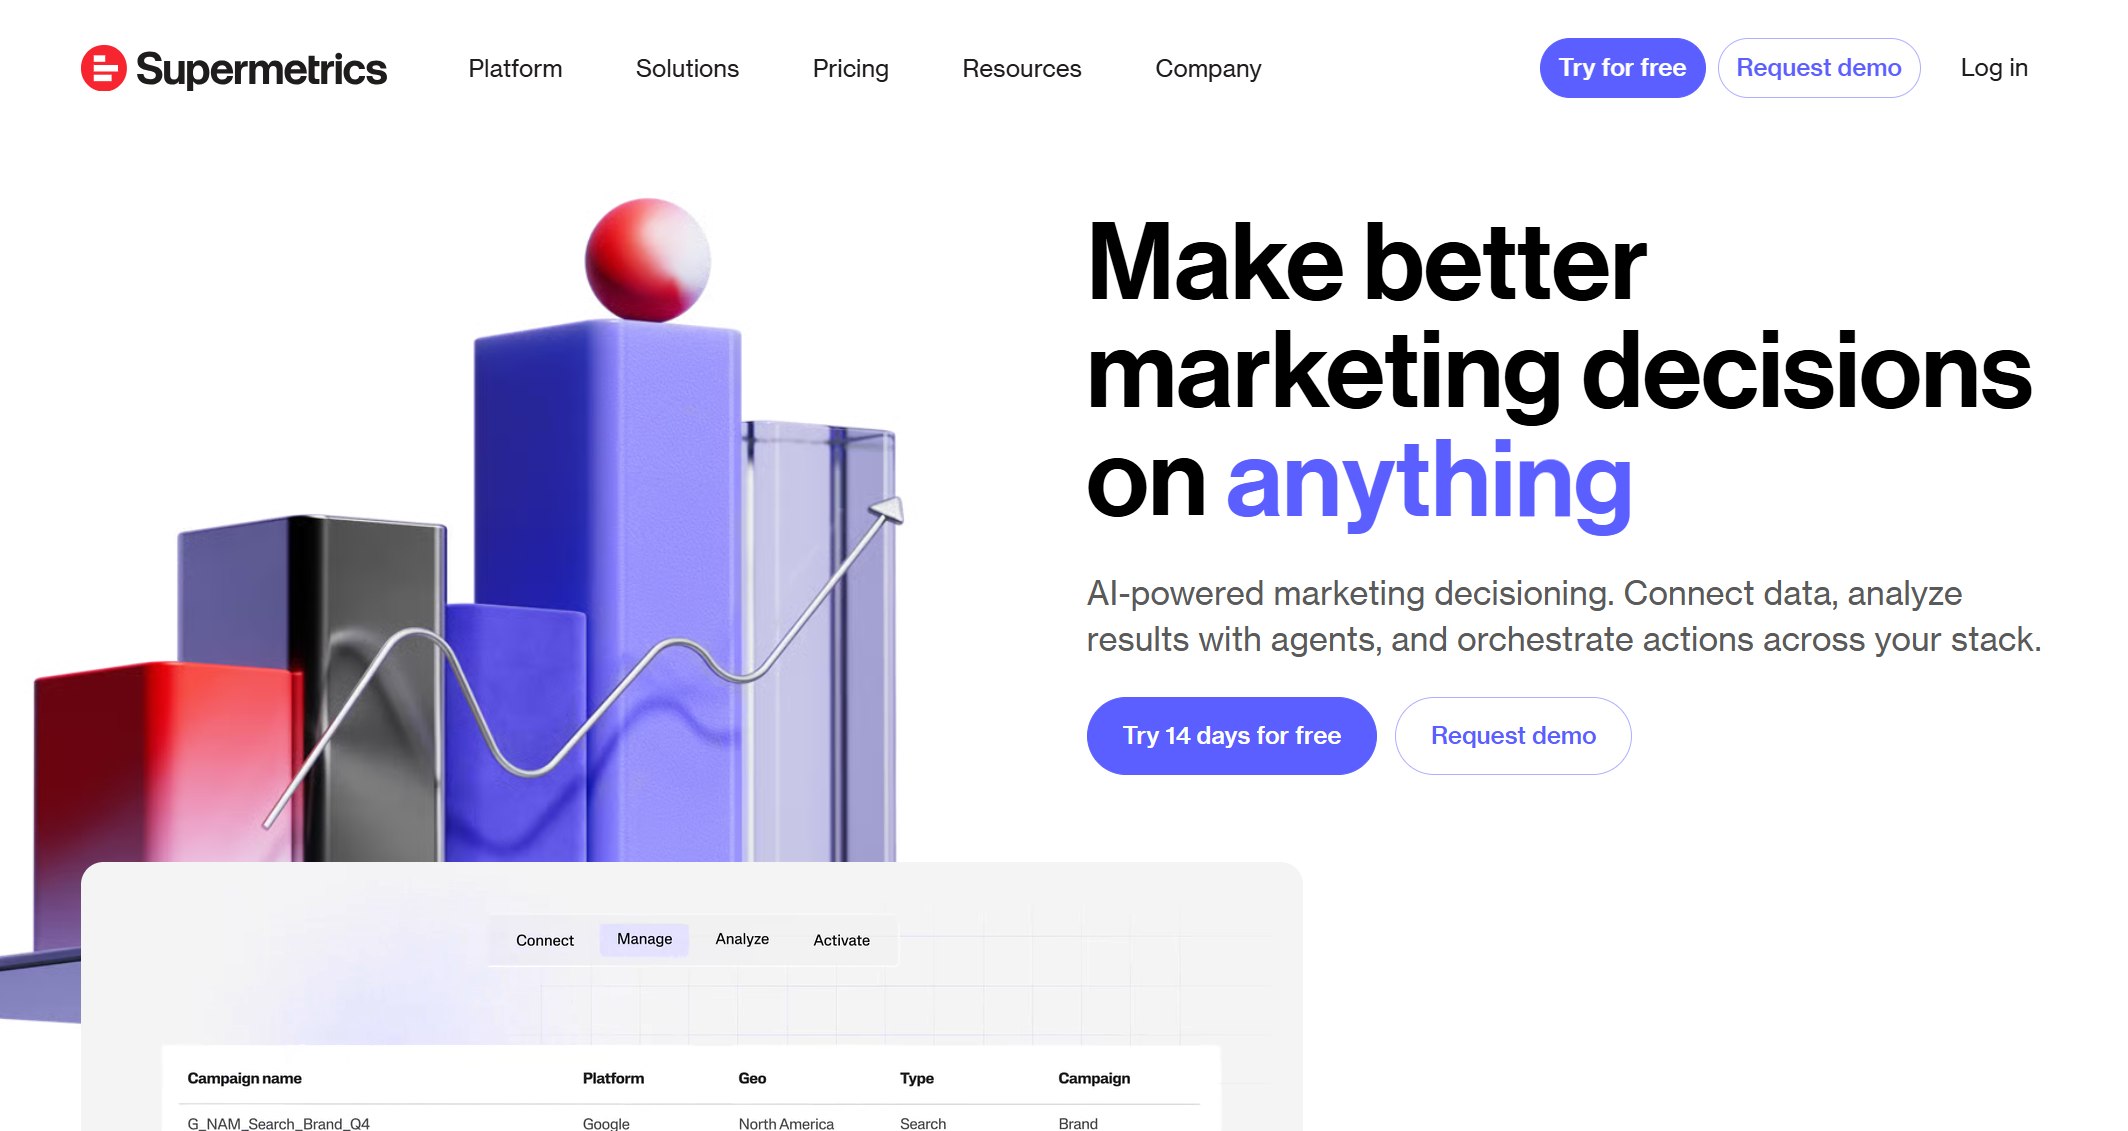
Website: https://supermetrics.com/
Supermetrics specializes in marketing data integration and automation. Its drag-and-drop report builder enables marketing teams to generate reports from over 150 platforms without coding. Supermetrics uses encrypted caches for secure data delivery and complies with SOC 2 Type II, GDPR, and CCPA standards.
Benefits for marketing teams include:
- Instant integration with popular platforms like Google Analytics, Facebook Ads, and HubSpot.
- Custom data import for offline or non-API data.
- Fully managed data pipelines for quick, unified reporting.
- Transparent, scalable pricing for businesses of all sizes.
- Reliable, granular data access for efficient campaign tracking.
Supermetrics’ drag-and-drop report builder streamlines the reporting process, helping teams access actionable insights and improve marketing ROI.
10.Databox
Website: https://databox.com/
Databox is a mobile-first reporting tool that helps startups and SMBs track KPIs on the go. Its drag-and-drop report builder makes it easy to design dashboards and generate reports without technical skills. Databox supports integration with popular business apps, allowing users to monitor performance from anywhere.
Teams use Databox to:
- Track sales, marketing, and operational metrics in real time.
- Set goals and receive automated alerts for key performance indicators.
- Share dashboards with stakeholders for collaborative decision-making.
Databox’s drag-and-drop report builder and mobile dashboard features make it a practical choice for businesses that value agility and real-time insights.
FineReport: Drag-and-Drop Report Generation Tools
Key Features
FineReport’s drag-and-drop report builder makes report creation easy for everyone. Users can build reports by dragging data fields onto the canvas. They do not need coding skills. The drag-and-drop report builder supports pixel-perfect layouts, so teams can design reports that look professional. FineReport lets users create dashboards, charts, and tables with just a few clicks. The drag-and-drop report builder also helps users track KPIs and build customizable reports quickly.
A multinational retailer used FineReport’s drag-and-drop report builder and saw a 40% drop in IT dependency. Marketing teams built real-time dashboards without waiting for IT support. McKinsey found that self-service tools like drag-and-drop report builder cut report generation time by half. FineReport’s drag-and-drop report builder helps non-technical users create reports fast and get insights sooner.
Tip: The drag-and-drop report builder saves time and helps teams focus on business goals.
Use Cases
FineReport’s drag-and-drop report builder fits many business needs. Companies use it for custom report creation, financial analysis, and sales tracking. HR teams build employee data entry forms and onboarding reports. Managers design dashboards to monitor performance. The drag-and-drop report builder helps teams create reports for inventory, customer records, and project management.
- Sales teams track monthly targets with interactive dashboards.
- HR managers collect employee data using entry forms.
- Executives review business trends with visual reports.
FineReport’s drag-and-drop report builder makes reporting simple for every department.
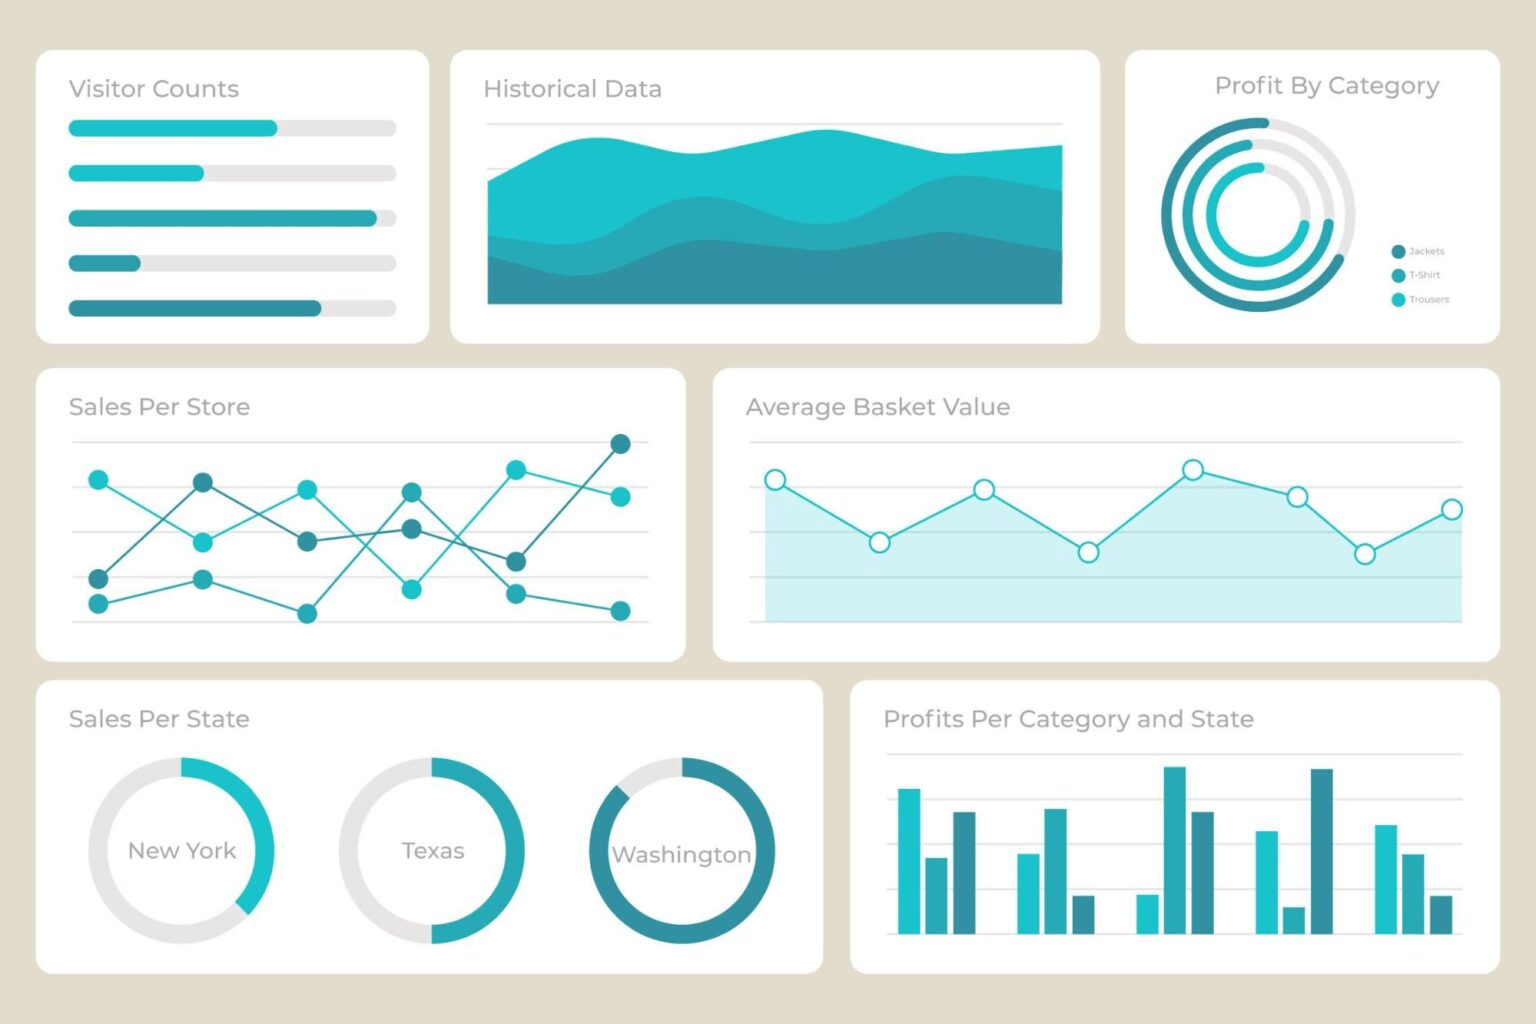
Below is a Hotel Group Management Dashboard created by FineReport.
Integration Capabilities
FineReport’s drag-and-drop report builder connects to over 100 data sources. Users can blend data from databases, spreadsheets, and cloud apps. The drag-and-drop report builder supports real-time data integration, so reports always show the latest numbers. FineReport works with FineDataLink to sync data across systems. The drag-and-drop report builder also lets users export reports in formats like Excel, PDF, and Word.
FineReport’s drag-and-drop report builder fits into any workflow. Teams can automate report scheduling and share reports by email or mobile app. The drag-and-drop report builder helps businesses keep data organized and accessible.
Selecting the right report generation tool shapes business growth and smarter insights. Companies see productivity rise and errors drop when they automate report tasks. FineReport stands out for delivering actionable, AI-powered report features and real-time dashboards. Teams use these tools to unify data, scale quickly, and create reports that drive decisions. Businesses should review their needs, compare report options, and choose solutions that fit their goals. The right report tool brings faster processes, better customer understanding, and growth. For more on FineReport and advanced report solutions, start free trail!

Continue Reading about Report Generation Tools
Top 10 Data Reporting Tools for Business Intelligence
The Best Open Source Reporting Tools for Your Business in 2025
Build Reporting and Visualization with Data Factory Solution


FAQ

The Author
Lewis
Senior Data Analyst at FanRuan