Dashboard
Transport Management System Dashboard Main Features for Modern Logistics
Lewis Chou
Mar 20, 2026
A transport management system dashboard helps you see your logistics work clearly. You get updates right away, can track shipments, and manage routes easily. If you use a tool like FineReport by FanRuan, it makes hard data easy to understand. You can use this information to make better choices. Studies show that using real-time data helps logistics. It lets you see more, plan better routes, and talk to others faster.
What Is a Transport Management System Dashboard
Dashboard Definition and Purpose
A transport management system dashboard is a digital tool. It helps you see and handle your logistics work in one spot. You can use it to follow shipments, watch routes, and check delivery status. The dashboard gathers data from many places. It shows the data in charts, tables, and maps. This helps you understand what is happening in your supply chain.
The main goal of a transport management system dashboard is to give you real-time information. You can find problems fast and make smarter choices. With a dashboard, you do not need to read lots of reports or call different teams. Everything you need is on one screen. FineReport by FanRuan helps you build dashboards. You can link data from many systems and make custom views for your needs.
Role in Logistics Operations
You use a transport management system dashboard to control and improve logistics operations. It lets you see every step in your supply chain. You can track shipments as they move from the warehouse to the customer. The dashboard shows where each truck or package is at any time.
Here are some ways a dashboard helps you in logistics:
- You get real-time updates about shipments and inventory.
- You can check performance with reports and analytics.
- You can track and trace goods locally and globally on one platform.
- You can share information fast with carriers, warehouses, and customers.
With these features, you save money and make your supply chain work better. You can automate tasks, keep goods safe during transit, and deliver items faster. FineReport by FanRuan helps you make dashboards and connect them, so it is easier to handle logistics data and help customers.
Key Transport Management System Dashboard Features
A transport management system dashboard gives you helpful tools for logistics. You can see shipments, routes, and how carriers are doing in one place. FineReport by FanRuan helps you make dashboards with easy connections, clear charts, and mobile access. Here are the main features you should look for in modern transportation management systems.
Real-Time Tracking and Visibility
You need to know where your shipments are all the time. Real-time tracking lets you follow shipments as they move. With a tms dashboard, you get updates on shipment locations and arrival times. This helps you fix problems fast and avoid delays.
- Real-time visibility helps you control your shipments.
- You get alerts if something changes, so you can act quickly.
- You can see all your shipments on a map, which makes tracking easy.
FineReport lets you connect data from different places. You can see shipment tracking, warehouse activity, and fleet status in one dashboard. Kintetsu used FineReport to make a dashboard that shows real-time customer and cargo data. Their teams now fix problems faster and keep customers happy.
Route Optimization Tools
Route optimization helps you save time and money. A tms dashboard uses smart tools to plan the best delivery routes. You can lower fuel costs, make more deliveries, and keep customers happy.
- Route optimization tools look at stops, delivery windows, and vehicle types.
- AI and machine learning help guess traffic and service times.
- Dynamic route changes let you handle emergencies or last-minute jobs.
With FineReport, you can see route data and find which routes work best. In manufacturing supply chain management, companies use dashboards to track shipments and change routes in real time. This cuts fuel use and makes sure deliveries are on time.
Carrier and Order Management
Managing carriers and orders is easier with a transportation management system dashboard. You can automate order entry, assign shipments, and track carrier performance.
| Feature | Description |
|---|---|
| Order Entry | Automates order details, assigns transport, and calculates ETA. |
| Order Overview | Shows orders, routes, and documents for planners and drivers. |
| Predictive Visibility | Uses real-time and past data to forecast delivery times and alert risks. |
You can see which carriers deliver on time and which ones need to do better. The dashboard tracks important numbers like on-time delivery rate, transit time, and freight cost per shipment. This helps you pick the best carriers and keep your logistics running well.
- Automated processes save time and cut mistakes.
- Real-time shipment tracking makes customers happier.
- Proactive management keeps your supply chain working smoothly.
Analytics and Reporting
Analytics and reporting are important for every tms dashboard. You can turn raw data into clear information. FineReport gives you tools to make custom reports and dashboards that show the numbers you care about.
| Metric | Description |
|---|---|
| Freight cost per mile | Helps you check transportation expenses and lower costs. |
| Carrier performance | Shows on-time delivery rates and claims, helping you pick the right carrier. |
| Delivery time variance | Finds delays and helps improve schedules. |
| Fuel consumption trends | Tracks fuel use for better efficiency and sustainability. |
| CO₂ emissions and sustainability | Supports green goals by tracking emissions. |
| Real-time shipment status | Lets you manage shipments and talk to customers quickly. |
| Order-to-ship cycle times | Shows how fast you process and deliver orders. |
| Lane profitability | Finds the most cost-effective routes. |
You can use different kinds of reports, like real-time status, bottleneck finding, and cost analysis. These reports help you spot problems, compare performance, and make better choices. FineReport’s dashboards let you look deeper into data and share information with your team.
Data Integration and Mobile Access
Data integration brings all your information together. A tms dashboard connects to ERP, WMS, and other systems, so you see everything. FineReport supports over 100 data sources, making connections easy.
- Real-time data exchange keeps your plans and estimates correct.
- Predictive analytics help you find patterns and avoid delays.
- End-to-end oversight gives you control over every shipment.
Mobile access means you can check your dashboard anywhere. FineReport’s mobile dashboards let you track shipments, view analytics, and get alerts on your phone or tablet. This keeps you connected and ready to act, even when you are not at your desk.
These features make transportation management systems great tools for modern logistics. You get real-time visibility, smart route optimization, strong carrier management, deep analytics and reporting, and easy integration. FineReport by FanRuan helps you use these benefits, just like Kintetsu and top manufacturers do every day.
Benefits of Transportation Management Systems Dashboards
Efficiency and Cost Reduction
You want your logistics to work well and save money. A tms dashboard helps you do this. You see all your data in one spot. This makes it simple to find problems and fix them fast. You use real-time shipment status to watch every delivery. This helps you stop delays and lower extra costs.
- A tms helps you plan the best routes. You use less fuel and take fewer trips.
- Load planning tools help fill each truck. You do not waste space or money.
- You check carrier performance with clear data. You pick the best partners for your business.
- Real-time tracking gives updates on shipment status. You can act fast if something goes wrong.
- Watching performance metrics helps you make changes that improve efficiency.
FineReport by FanRuan supports these features. You connect data from many places and see it all in one dashboard. This helps you work better and control costs.
Enhanced Customer Service
You want your customers to be happy and know what is happening. A tms dashboard gives you tools to help customers. You share real-time shipment status with them. They always know where their orders are. This builds trust and keeps them coming back.
When you use a tms, you send automatic updates about orders. Customers get alerts if there are delays or changes. They see new delivery times right away. This clear communication means fewer questions and more peace of mind. Fast deliveries and smart carrier choices also help customer service.
FineReport helps you set up dashboards that show order tracking and delivery updates. You give your customers the data they need. This helps you work better and build strong relationships.
Informed Decision-Making
You make better choices when you have good data. A tms dashboard turns raw data into helpful information. You see trends, find problems, and look for ways to improve. You use analytics to compare routes, carriers, and costs.
With a tms, you do not guess. You use data to plan and change your logistics. You see which routes save time and which carriers do best. You track efficiency and make changes that help your business grow.
FineReport by FanRuan gives you strong tools for data analysis. You make custom dashboards and reports. You share ideas with your team and act fast. This keeps your logistics strong and ready for anything.
Trends in Transport Management System Dashboards
The world of tms is changing fast. You see new technology every year. Companies want better ways to manage shipments and make smart choices. The market for tms is growing quickly. Look at this table to see how much it is expected to grow:
| Year | Market Revenue (US$) | CAGR (%) |
|---|---|---|
| 2024 | 8.76 billion | - |
| 2034 | 23.35 billion | 10.3 |
The rise of e-commerce and the need for real-time tracking push more companies to use tms. Cloud-based solutions are becoming popular. By 2034, these will make up most of the market.
AI and Predictive Analytics
You now use tms with AI and advanced analytics. These tools help you learn from data and make better decisions. AI in tms gives you real-time learning and smart tips. Predictive analytics helps you see problems before they happen. For example, you can spot delivery delays or know when a truck needs repairs. You can also use these tools for route optimization. This means you save time and money by picking the best routes. FineReport supports advanced analytics and lets you build dashboards that show trends and forecasts. You get clear answers and can act fast.
- AI helps you forecast demand and plan routes.
- Predictive analytics lets you fix issues before they cause trouble.
- You can use tms to lower risks and keep deliveries on time.
IoT Integration and Advanced Tracking
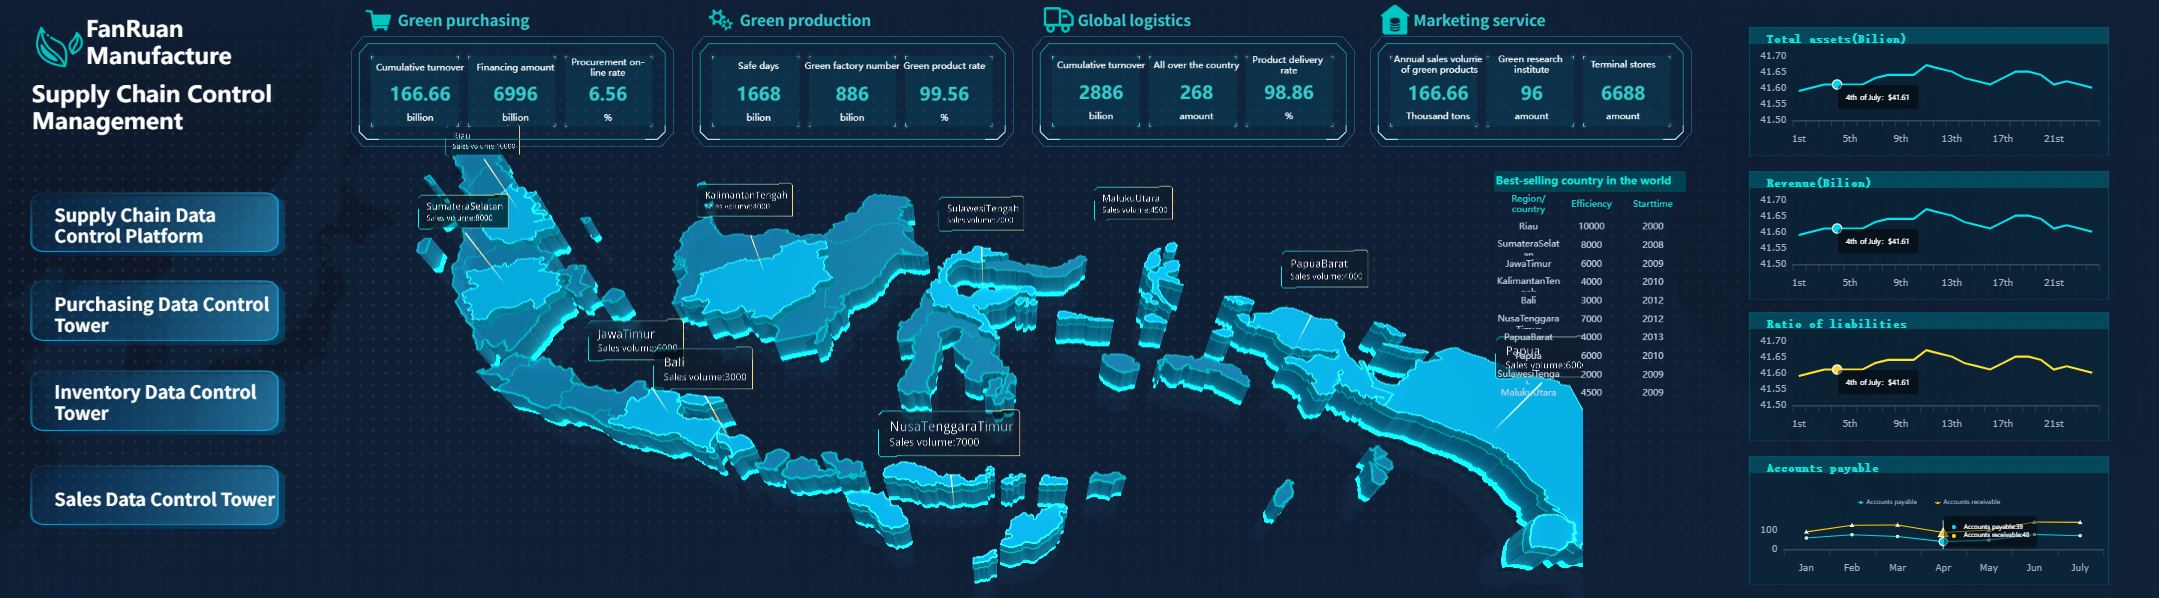
Modern tms uses IoT to track shipments in real time. You get updates on where your trucks are and how drivers perform. You can connect GPS and telematics to your tms. This gives you alerts if something goes wrong, like a delay or a route change. FineReport’s 3D dashboards let you see all this data in one place. You can watch fuel use, shipment status, and driver actions. This helps you keep control and improve your logistics.
- Real-time tracking keeps you informed.
- Alerts help you act quickly if there is a problem.
- IoT makes your tms smarter and more reliable.
Customization and User Experience
You want a tms that fits your needs. Custom dashboards let you pick what you see. This makes your work easier and helps you make good choices. FineReport lets you create dashboards that match your job. You can use mobile BI to check data anywhere. This means you always have the information you need.
| Feature | Benefit |
|---|---|
| Customizable Dashboard Views | Lets you build layouts that help you decide faster and see more clearly. |
A good tms gives you control and makes your job simple. You get the right data at the right time. This helps you keep your supply chain strong and ready for the future.
You get real benefits from using a transport management system dashboard. FineReport by FanRuan helps you watch how things are going and look at reports. You can spend less money, trust your deliveries more, and fix problems faster.
| Benefit | Description |
|---|---|
| Reduced costs | Companies spend less on fuel, workers, and sending things again. |
| Improved reliability | Automatic steps mean fewer missed deliveries. |
| Faster response times | Real-time updates help you change plans fast if there is a problem. |
| Better team coordination | One place for info helps teams work together. |
| Competitive differentiation | Better tools help you stand out from others. |
When picking a dashboard, find one that connects easily, shows live data, lets you change views, and has good analytics. These things help you do better in logistics.


FAQ

The Author
Lewis Chou
Senior Data Analyst at FanRuan
Related Articles

How to Build an Investment Portfolio Reporting Dashboard for Executives: KPIs, Benchmarks, and Drill-Down Views
Investment portfolio reporting for executives is not about showing every holding, transaction, and chart your investment team can produce. It is about giving CEOs, CFOs, CIOs, boards, and investment committees a fast, re
Yida YIn
Jun 25, 2026

12 KPI Reporting Examples for Executive Dashboards: What to Show in Weekly, Monthly, and Quarterly Reviews
Executive leaders do not need more data. They need decision ready $1 examples that match how often they review the business and what actions they are expected to take. A weekly $1 should surface fast moving risks and per
Yida YIn
Jun 25, 2026

How to Build a Digital Marketing Reports Dashboard: Executive Examples, KPIs, and Templates
A $1 is the control layer that helps executives and marketing leaders turn scattered channel data into fast, confident decisions. If you are a CEO, CMO, operations director, or marketing analytics lead, the real problem
Yida Yin
May 07, 2026