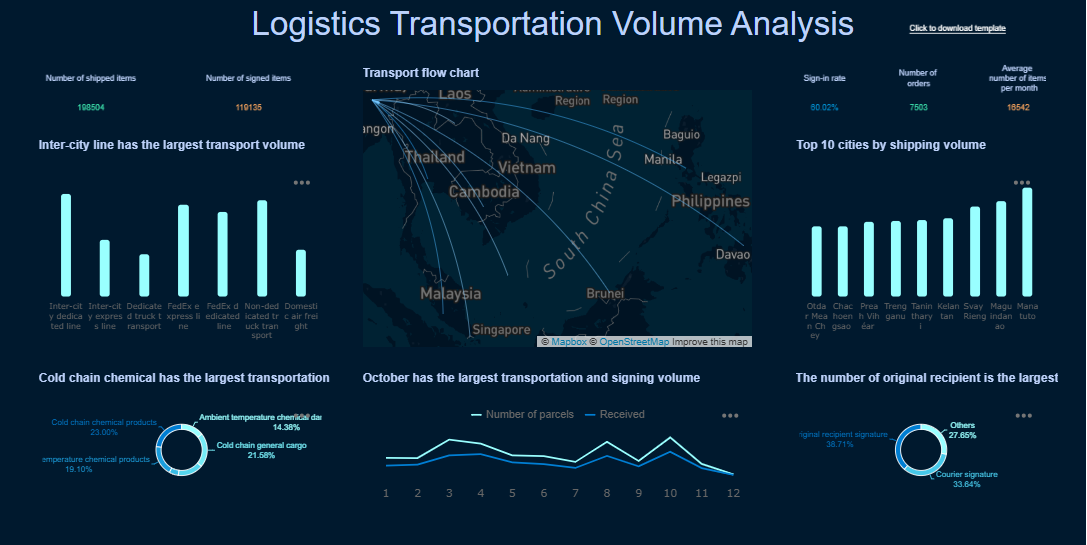
A logistics dashboard gives you real-time visibility into your supply chain. You track shipments, inventory, and supplier performance with immediate access to data. This dashboard helps you respond quickly to changes, optimize operations, and reduce risks. See how it improves your business:
| Benefit | Description |
|---|---|
| Real-time data visibility | Immediate insights into supply chain operations |
| Improved decision-making | Data-driven choices for procurement and production |
| Performance tracking | Monitors key metrics and supplier efficiency |
| Risk reduction | Early identification of potential disruptions |
| Comprehensive view | Holistic management of the entire supply chain |
A modern logistics dashboard, especially with FineReport, transforms your daily workflow and empowers smarter decisions.

A logistics dashboard is a digital tool that gives you a real-time overview of your supply chain activities. You use it to monitor shipments, inventory, and supplier performance, all in one place. This dashboard helps you make faster decisions and respond to changes as they happen.
You rely on a logistics dashboard to track key metrics and visualize complex data. It integrates information from multiple sources, providing a unified view that eliminates blind spots. With this tool, you gain continuous insight into your operations, which is essential for maintaining efficiency and control.
A logistics dashboard serves several important functions in supply chain management:
Tip: Use your dashboard to spot issues early and take action before they disrupt your supply chain.
You connect your logistics dashboard to various data sources, such as warehouse systems, transportation platforms, and supplier databases. The dashboard collects and updates information automatically, displaying it through interactive charts and tables. This real-time integration enhances visibility and operational agility.
When you use a logistics dashboard, you benefit from:
You see the entire supply chain at a glance, making it easier to collaborate, address issues, and drive improvements.
A logistics dashboard is a digital platform that gives you a real-time overview of your supply chain. You use it to track shipments, monitor inventory, and measure supplier performance. This dashboard helps you make quick decisions and maintain control over logistics operations.
When you rely on a logistics dashboard, you gain instant access to critical data. You see the status of shipments, inventory levels, and supplier activities all in one place. This visibility allows you to respond quickly to changes and keep your logistics running smoothly.
You need visibility to manage logistics effectively. A logistics dashboard centralizes information from different systems, giving you a clear view of your entire supply chain. You track key performance indicators and spot issues before they become problems.
FineReport strengthens visibility and control by integrating data from various systems like ERP, MES, and SRM. You interact with comprehensive data visualizations on a single dashboard, which simplifies analysis and enhances decision-making. The unified interface reduces communication costs between departments, making your logistics operations more efficient.
A logistics dashboard helps you optimize processes and reduce costs. You use real-time data to make informed decisions that improve delivery times and lower expenses.
| Contribution Area | Benefits |
|---|---|
| Route Optimization | Improved delivery times, reduced fuel consumption, and enhanced delivery efficiency. |
| Predictive Maintenance | Reduced downtime and overall fleet maintenance costs, leading to cost savings. |
| Inventory Management | Optimized stock levels, reduced holding costs, and better demand planning. |
| Performance Metrics and KPI Monitoring | Data-driven decisions, improved efficiency, and alignment with business goals. |
| Vendor and Supplier Performance | Data transparency, stronger supplier relationships, and informed decision-making. |
| Real-Time Risk Management | Proactive problem-solving, faster response times, and enhanced resilience to disruptions. |
You see measurable improvements in logistics operations when you use a dashboard. You optimize routes, reduce fuel costs, and improve delivery efficiency. Predictive maintenance lowers downtime and fleet expenses. Better inventory management means you avoid overstocking and reduce holding costs. You monitor performance metrics and KPIs, which helps you align operations with business goals. You build stronger relationships with vendors and suppliers through transparent data. Real-time risk management lets you solve problems quickly and keep your supply chain resilient.
FineReport's low-code functionality simplifies data integration and eliminates silos. You benefit from actionable insights that drive efficiency and cost savings across your logistics operations.

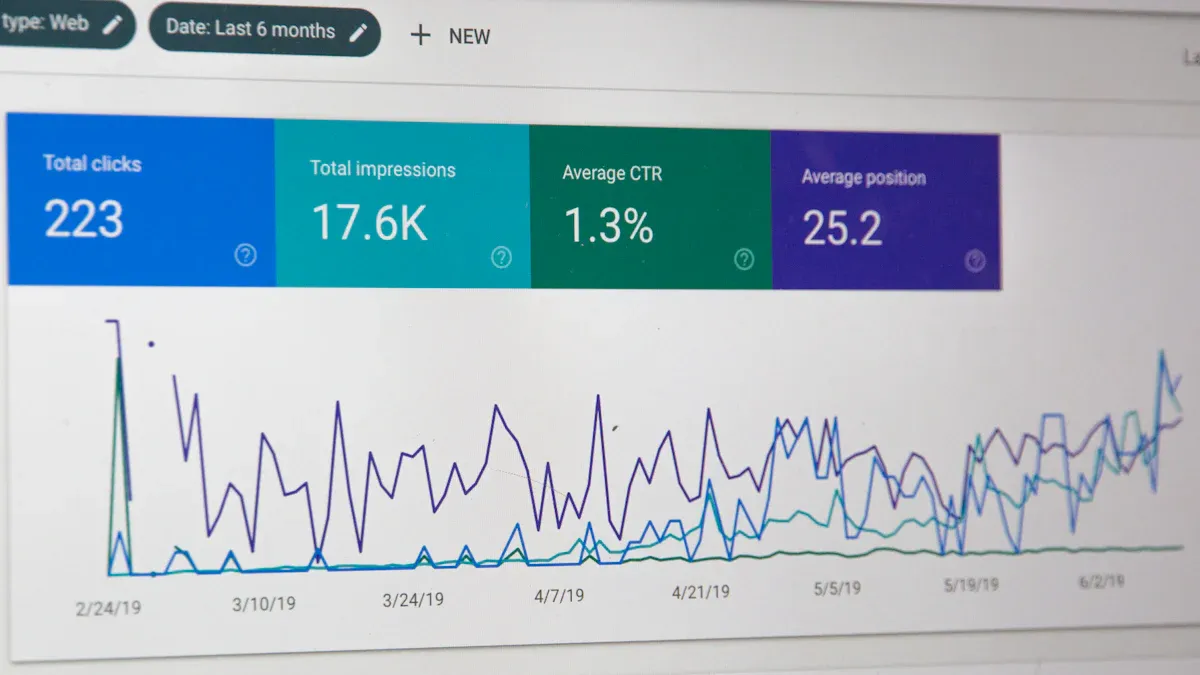
A logistics dashboard empowers you to make smarter decisions. You use real-time data to monitor key metrics and respond proactively rather than reactively.
Data visualization tools transform decision-making in logistics. You see trends and patterns instantly, which helps you adjust strategies and improve outcomes. When you align business intelligence technologies with company objectives, you enhance your decision-making process. Management involvement ensures you optimize the use of BI tools.
A global transportation company improved decision-making by using dashboards to monitor operational, financial, and compliance performance. This led to a 33% increase in profitability and a 24% improvement in on-time performance for key accounts.
FineReport enables you to integrate data from multiple sources and visualize it on a single dashboard. You gain actionable insights from raw data, which supports better decisions. The Kintetsu World Express case shows how FineReport helped sales teams access comprehensive customer data, streamline reporting, and improve operational efficiency. You see the impact of real-time dashboards in enhancing information management and driving business success.
Tip: Use your logistics dashboard to turn raw data into actionable insights. This helps you make informed decisions and stay ahead in a competitive market.
A logistics dashboard is a digital platform that gives you a real-time overview of your supply chain. You use it to track shipments, monitor inventory, and measure supplier performance. This dashboard helps you make quick decisions and maintain control over logistics operations.
When you use a logistics dashboard, you rely on key performance indicators (KPIs) to measure and improve your logistics operations. These KPIs help you identify strengths and weaknesses, optimize processes, and deliver better results for your business. A kpi dashboard in logistics focuses on the most important metrics that drive efficiency and customer satisfaction.
You need to track delivery and inventory KPIs to ensure your logistics dashboard provides actionable insights. The most frequently monitored KPIs include:
Tracking these KPIs on your logistics dashboard helps you maintain high standards and meet customer expectations.
Transportation and cost metrics play a vital role in logistics. You use your kpi dashboard to monitor these metrics and control expenses. The table below shows how key transportation metrics impact shipping costs:
| Metric | Impact on Shipping Costs |
|---|---|
| Cost Per Unit Shipped | Lower costs through shipment consolidation and improved efficiency. |
| On-Time Delivery Rates | Better efficiency and customer satisfaction, leading to lower shipping costs. |
| Perfect Order Rates | Higher performance and trust, resulting in reduced costs. |
By tracking these metrics, you can optimize routes, reduce fuel consumption, and improve overall logistics efficiency.
Order accuracy and fulfillment are essential for successful logistics operations. When you monitor these KPIs on your dashboard, you reduce errors and improve customer satisfaction.
A kpi dashboard in logistics gives you the data you need to track these metrics and make informed decisions. FineReport enables you to visualize and analyze all these KPIs in one place, making it easier to manage and improve your logistics performance.
You need a logistics dashboard that adapts to your business needs. Customization features let you select templates, filter data, and adjust layouts for clear communication. You can choose from pre-designed templates that match your brand and reporting style. Data filtering helps you focus on the most relevant information. Custom visualizations, such as charts and graphs, make complex data easy to understand. You can adjust the layout, font, and color scheme to create visually appealing reports. Language support allows you to generate reports for diverse audiences.
| Customization Feature | Description |
|---|---|
| Template Selection | Choose from a variety of pre-designed report templates that align with brand and reporting style. |
| Data Filtering | Apply filters to create targeted reports focusing on the most relevant information. |
| Visualizations | Customize charts and graphs to effectively communicate complex data insights. |
| Layout and Design | Adjust layout, font, and color scheme for visually appealing reports. |
| Language Support | Generate reports in multiple languages for diverse audiences. |
Usability plays a key role in user adoption. A well-designed dashboard lets you extract insights quickly and make informed decisions. Customizable views and interactive filters keep users engaged. Slow dashboards erode trust and reduce usage. Companies using interactive dashboards find timely insights and higher engagement.
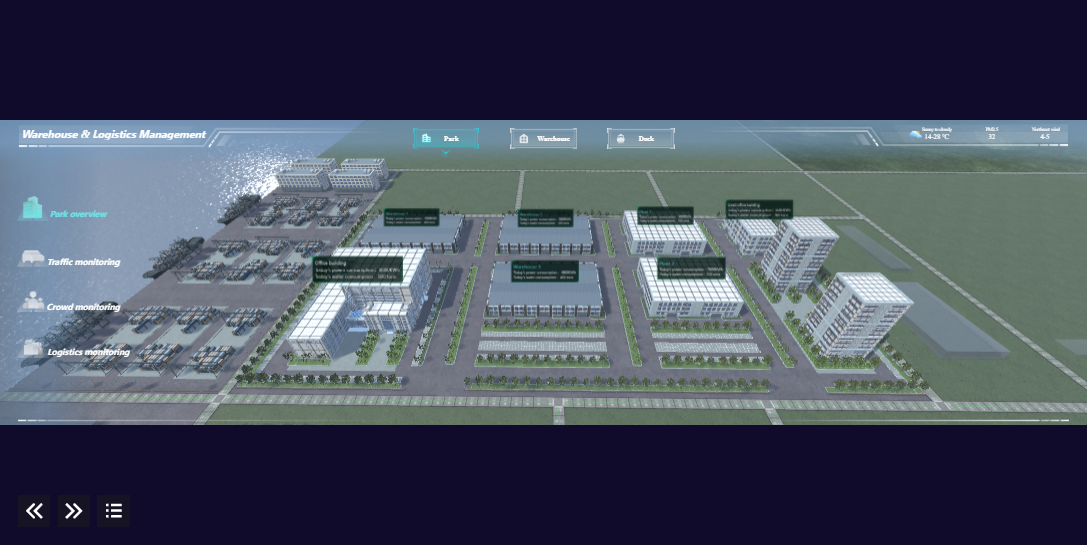
You need access to logistics data wherever you are. Mobile dashboards provide on-the-go access, improving the accessibility and actionability of insights. In a mobile-centric environment, you can monitor inventory, logistics, and supplier performance in real time. Live data updates help you respond swiftly to unexpected demand changes or supply chain disruptions.
FineReport offers mobile dashboards that work on smartphones and tablets. You can customize your dashboard for mobile viewing, ensuring you stay connected to your operations. FineReport’s 3D dashboards deliver interactive visualizations, making it easier to analyze complex logistics scenarios and optimize performance.

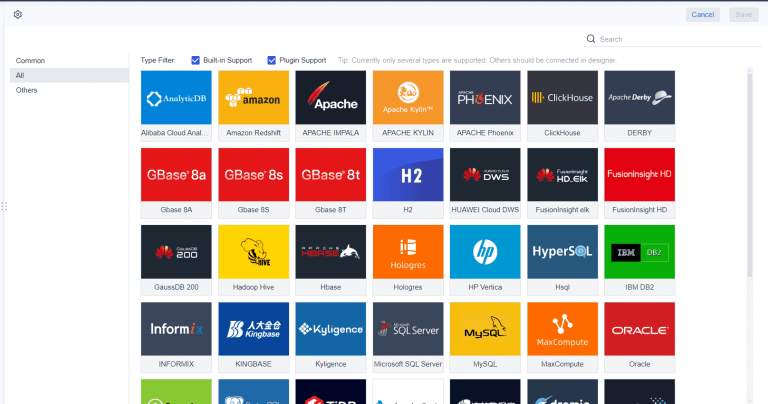
Integration ensures your logistics dashboard connects to all relevant data sources. You need seamless data flow between warehouse systems, transportation platforms, and supplier databases. FineReport’s decision-making platform supports integration with ERP, MES, and SRM systems, providing a unified view of your operations.
Security is essential for protecting sensitive logistics data. You should implement encryption, firewalls, and access controls. Role-based access restricts data visibility. Regular backups and disaster recovery procedures safeguard your information. FineReport supports these protocols, helping you comply with regulations and maintain data integrity.
Tip: Define clear objectives, choose the right metrics, and design for usability to create actionable dashboards that drive business results.
A logistics dashboard gives you the power to boost efficiency, gain real-time visibility, and make data-driven decisions. Many businesses use dashboards to build resilience and optimize performance. According to recent surveys, most supply chain leaders report improved outcomes after adopting dashboards. You see clear advantages over traditional tools:
| Feature | Logistics Dashboards | Traditional Tools |
|---|---|---|
| Data Insights | Real-time, visual | Static, delayed |
| Decision-Making | Fast, data-driven | Manual, slower |
| Efficiency Gains | Significant | Limited |
Evaluate your current logistics processes. Consider FineReport to unlock the full potential of your logistics dashboard.

Best Dashboard Apps for Business Insights
What is a Call Center Dashboard and Why Does It Matter
What is a Reporting Dashboard and How Does it Work
What is An Interactive Dashboard and How Does It Work
What is a Call Center Metrics Dashboard and How Does It Work

The Author
Lewis
Senior Data Analyst at FanRuan
Related Articles

Payment Analytics Dashboard: 12 KPIs Every Operations Leader Should Track to Cut Revenue Leakage
Losing revenue to declines? Discover 12 essential KPIs to track in your payment analytics dashboard to stop leakage and manage disputes.
Lewis Chou
May 05, 2026

SOC Dashboard Explained: 12 Essential KPIs, Views, and Workflows Security Teams Use
Learn about SOC dashboards, the 12 essential KPIs for security teams, and how they centralize alerts and workflows for faster threat detection and response.
Lewis Chou
May 05, 2026

EMR Dashboard Guide: 12 Metrics to Track for Faster Clinical and Operational Decisions
Learn the 12 essential EMR dashboard metrics to track for faster clinical and operational decisions, improving patient flow and revenue cycle management.
Lewis Chou
May 05, 2026


