Financial analysis helps you evaluate a business’s health and performance by examining financial data, such as statements and reports. When you use financial analysis, you gain insights into profitability, liquidity, and risk. This process supports smarter decisions for leaders, investors, and analysts. You see how financial analysis uses ratios and trends to compare results and forecast outcomes. Modern tools like FineReport make financial analysis more accessible, allowing you to visualize key metrics and act quickly. With these solutions, you turn complex data into clear, actionable insights.
You use financial analysis to understand how a business performs and where it stands financially. This process involves examining a company’s financial statement, such as the income statement, balance sheet, and cash flow statement. By reviewing these documents, you can see how much money comes in, how much goes out, and what resources the business owns or owes.
Financial analysis goes beyond just looking at numbers. You also compare results over time, check how the business stacks up against competitors, and spot trends that might affect future performance. When you perform financial statement analysis, you use different tools and methods to break down the data and make sense of it.
Tip: Financial analysis is not just for accountants. As a business leader or investor, you rely on these insights to make better decisions and manage risks.
The key components of financial analysis help you get a complete picture of a company’s financial health. Here are the main elements you should focus on:
You also need reliable data sources for financial analysis. Here is a table showing some common sources and their features:
| Data Source | Description / Key Features |
|---|---|
| Bloomberg | Major financial data platform; offers Excel plugin for data extraction and analysis. |
| Capital IQ | Provides extensive financial data; supports Excel plugin; includes Standard & Poor's data via WRDS. |
| Datastream | Includes Worldscope data; accessible via WRDS; covers broad financial datasets. |
| Global Financial Data | Offers large raw financial datasets; API available with account and permission; supports data grouping. |
| Preqin | Specializes in Private Equity and Venture Capital data; large data downloads available; accessible via WRDS. |
| LSEG Workspace | Formerly Refinitiv; provides API access; supports Python integration; includes corporate and market data. |
| SDC Platinum | Covers mergers & acquisitions, corporate governance, venture capital, and public finance data; via WRDS. |
| Wind | Available selectively; Excel plugin available; used mainly by NYU Shanghai and select scholars. |
| WRDS | Supports querying via statistical software (SAS, R, Python, etc.); includes datasets like CRSP, Compustat. |
You can also use primary data, such as surveys or experiments, and secondary data, like government records or company reports, to support your analysis.
When you conduct financial analysis, you aim to achieve several important goals. These objectives of financial analysis guide your efforts and help you focus on what matters most for your business or investment decisions.
Note: By focusing on these objectives of financial analysis, you create a strong foundation for business growth and long-term success.
Financial statement analysis helps you see the big picture and the details. When you use the key components of financial analysis, you gain the insights needed to drive your business forward.
You rely on financial analysis to guide your business toward growth and stability. This process gives you a clear view of your company’s financial health by examining key statements and ratios. When you understand your financial performance, you can make smarter decisions about where to invest, how to cut costs, and when to expand.
Financial analysis acts as a foundation for your business strategy. By reviewing profitability analysis and cash flow analysis, you see which areas generate the most value and which need improvement. You use these insights to set realistic goals and track progress over time.
Regularly reviewing your profit and loss, cash flow, and balance sheet reports helps you spot trends and adjust your plans quickly.
You also use financial analysis to manage risk. Identifying and assessing risks—such as market changes or liquidity issues—protects your business from unexpected losses. You can develop strategies like diversification or building cash reserves to prepare for disruptions. This proactive approach supports long-term growth and keeps your business resilient.
Here are some ways you use financial analysis in your daily operations:
Research shows that financial analysis is vital for improving profitability and resource efficiency. It supports business growth by providing accurate insights, helping you balance short-term gains with long-term success. Studies also reveal that tracking profitability trends, rather than just static numbers, better predicts future performance and helps you create effective growth strategies.
Financial analysis gives investors and stakeholders the confidence they need to support your business. When you provide clear, accurate financial data, you show that your company is transparent and well-managed. This transparency builds trust and attracts more investment.
You use financial analysis to evaluate your company’s ability to generate returns. Investors look at metrics like return on investment, liquidity ratios, and profitability analysis to decide if your business is a good choice. Lenders assess your financial health and cash flow analysis to determine if you can repay loans.
Here are the main benefits financial analysis brings to investors and stakeholders:
Financial analysis also plays a key role in mergers, acquisitions, and partnerships. It helps all parties assess value, negotiate terms, and plan for the future.
Statistical methods, such as ratio analysis and predictive analytics, help you turn complex data into actionable insights. You use these tools to forecast earnings, assess risk, and identify trends. Companies like Amazon and Walmart have shown that data-driven decisions can lead to significant improvements in revenue and efficiency.
You also use financial analysis to support portfolio management and market analysis. By applying quantitative techniques, you optimize asset allocation and develop strategies that align with your goals. This approach ensures you make evidence-based decisions that drive long-term success.
You approach financial analysis using two main types: quantitative and qualitative. Quantitative financial analysis relies on numbers and measurable data. You use this approach when you want precise answers about a company’s financial health. For example, you might look at revenues, expenses, or ratios from a financial statement. Qualitative financial analysis, on the other hand, focuses on the story behind the numbers. You consider factors like management quality, business strategy, or market conditions. This helps you understand the context of financial results.
Here is a table that highlights the differences between these two types of financial analysis:
| Aspect | Quantitative Financial Analysis | Qualitative Financial Analysis |
|---|---|---|
| Nature of Data | Numerical, measurable data such as revenues, expenses, cash flows, financial ratios | Subjective, descriptive information like management commentary, business strategies, risks, market conditions |
| Expression | Numbers, percentages, currency amounts | Words, explanations, narratives |
| Objectivity | Objective and precise | Subjective and interpretive |
| Purpose | Assess financial performance with hard facts and figures | Provide context and insight behind the numbers |
| Examples | Financial statements, profit margins, growth rates | Explanations for trends, risk descriptions, strategic plans |
You gain the most insight when you combine both types of financial analysis. Numbers show what happened, while context explains why.
You use several methods of financial statement analysis to evaluate a company’s financial health. Each method gives you a different perspective on performance and risk. Here are some of the most common methods of financial statement analysis:

You often use these methods together to get a complete view of a company’s financial statement and overall financial health. By applying different types of financial analysis, you make more informed decisions and spot opportunities or risks early.
You use financial analysis to guide your company’s direction and make informed decisions. As a business leader, you rely on financial data to set goals, allocate resources, and measure progress. You review key metrics, such as profitability and cash flow, to understand where your business stands. This process helps you identify strengths, spot risks, and plan for growth. When you analyze trends and compare results with industry benchmarks, you gain a clear view of your company’s position in the market. Financial analysis gives you the confidence to make strategic choices that drive success.
Finance teams play a central role in daily financial analysis. You use customizable dashboards to visualize important metrics for different users, making it easier to monitor performance and communicate results. Real-time reporting and analytics give you up-to-date information, so you can act quickly. You connect financial analysis software with other systems, such as ERP and CRM, to bring all your data together and reduce silos. Scenario planning and modeling help you assess risks and opportunities. Automation handles routine tasks like data consolidation and report generation, which increases accuracy and saves time. You also use budgeting, forecasting, and planning tools to support your company’s financial management every day. AI-powered systems and automation eliminate repetitive work, freeing you to focus on strategy and analysis.
Many people outside the finance department use financial analysis to make decisions. Here is a table showing who uses it and why:
| Stakeholder Category | Stakeholders Included | Purpose of Using Financial Analysis |
|---|---|---|
| Internal | Managers, Employees, Management Board | Planning, controlling, decision-making, job security, accountability, compensation |
| Main External | Owners, Lenders, Suppliers, Customers, Donors | Evaluating returns and risks, assessing creditworthiness, monitoring stewardship, cost-effectiveness |
| Other External | Government Agencies, Communities, Competitors, Public | Taxation, economic policy, employment impact, environmental concerns, transparency |
Investors and shareholders use financial analysis to check profitability and risk. Creditors and lenders focus on liquidity and repayment ability. Employees may look at financial data to understand job security or profit-sharing. Even government agencies and local communities review financial information for policy and transparency.
Financial analysis supports better decisions for everyone involved with your business, from leaders to employees and external partners.
You need a reliable solution to make sense of your company’s financial data. FineReport gives you the power to perform financial analysis with speed and accuracy. Over 85% of financial firms in the U.S. now use financial analytics software, showing how important these tools have become for business success. FineReport stands out by helping you streamline your financial processes, from budgeting to forecasting and scenario analysis. You can automate KPI calculations, reduce errors, and save valuable time. This means you spend less time on manual tasks and more time focusing on strategic planning.
FineReport connects to multiple data sources, including SQL databases, Excel files, and cloud services. You can bring all your financial data together in one place. The platform’s secure access controls protect sensitive information, so you can share insights with confidence. With FineReport, you gain a clear view of your company’s financial health and can make informed decisions that drive growth.
FineReport empowers you to monitor key financial metrics, analyze trends, and respond quickly to changes in your business environment.
FineReport’s Financial Dashboard transforms complex financial data into clear, actionable insights. You can visualize real-time data with dynamic charts and graphs, making it easy to track performance and spot trends. The dashboard supports interactive features like filters and drill-downs, so you can explore data in detail. Customizable layouts let you focus on the metrics that matter most to your business.

You benefit from seamless integration with your existing systems, which streamlines your workflow. Scheduled reporting ensures you always have the latest information at your fingertips. Mobile compatibility means you can access dashboards and reports from any device, keeping you connected wherever you are.
Financial dashboards like those in FineReport help you communicate results clearly with stakeholders. You can make faster, data-driven decisions and improve your company’s financial performance.

You gain several advantages when you use financial statement analysis to guide your business. First, you see a clear picture of your financial health. This helps you forecast revenue, match income with expenses, and allocate resources where they matter most. You also build trust with stakeholders by showing transparent financial management.
Saks Global, Intel, and Siemens have all improved their financial performance by using financial statement analysis to optimize cash flow, control costs, and reduce risk. These real-world examples show how effective analysis leads to better outcomes.
You may face several obstacles when you analyze your financial statement. Verifying data accuracy can be tough, especially if you rely on static spreadsheets. Integrating data from multiple systems often slows down your process and makes it hard to get a complete view of your financial health.
| Challenge | Description |
|---|---|
| Data Accuracy | Manual entry and version control issues can lead to errors. |
| Integration Difficulties | Combining data from different sources is complex and time-consuming. |
| Collaboration Gaps | Finance and nonfinance teams may not share insights or work together easily. |
| Data Interpretation | Telling a clear story with your numbers can be difficult for stakeholders. |
| Timeliness | Meeting reporting deadlines is critical but often challenging. |
You also need to manage stakeholder expectations and handle large amounts of data. Global operations add complexity with different accounting standards and currencies.
You can overcome these challenges by following proven strategies:
When you use these best practices, you make your financial performance analysis more reliable and actionable. This helps you plan for the future and respond to changes with confidence.
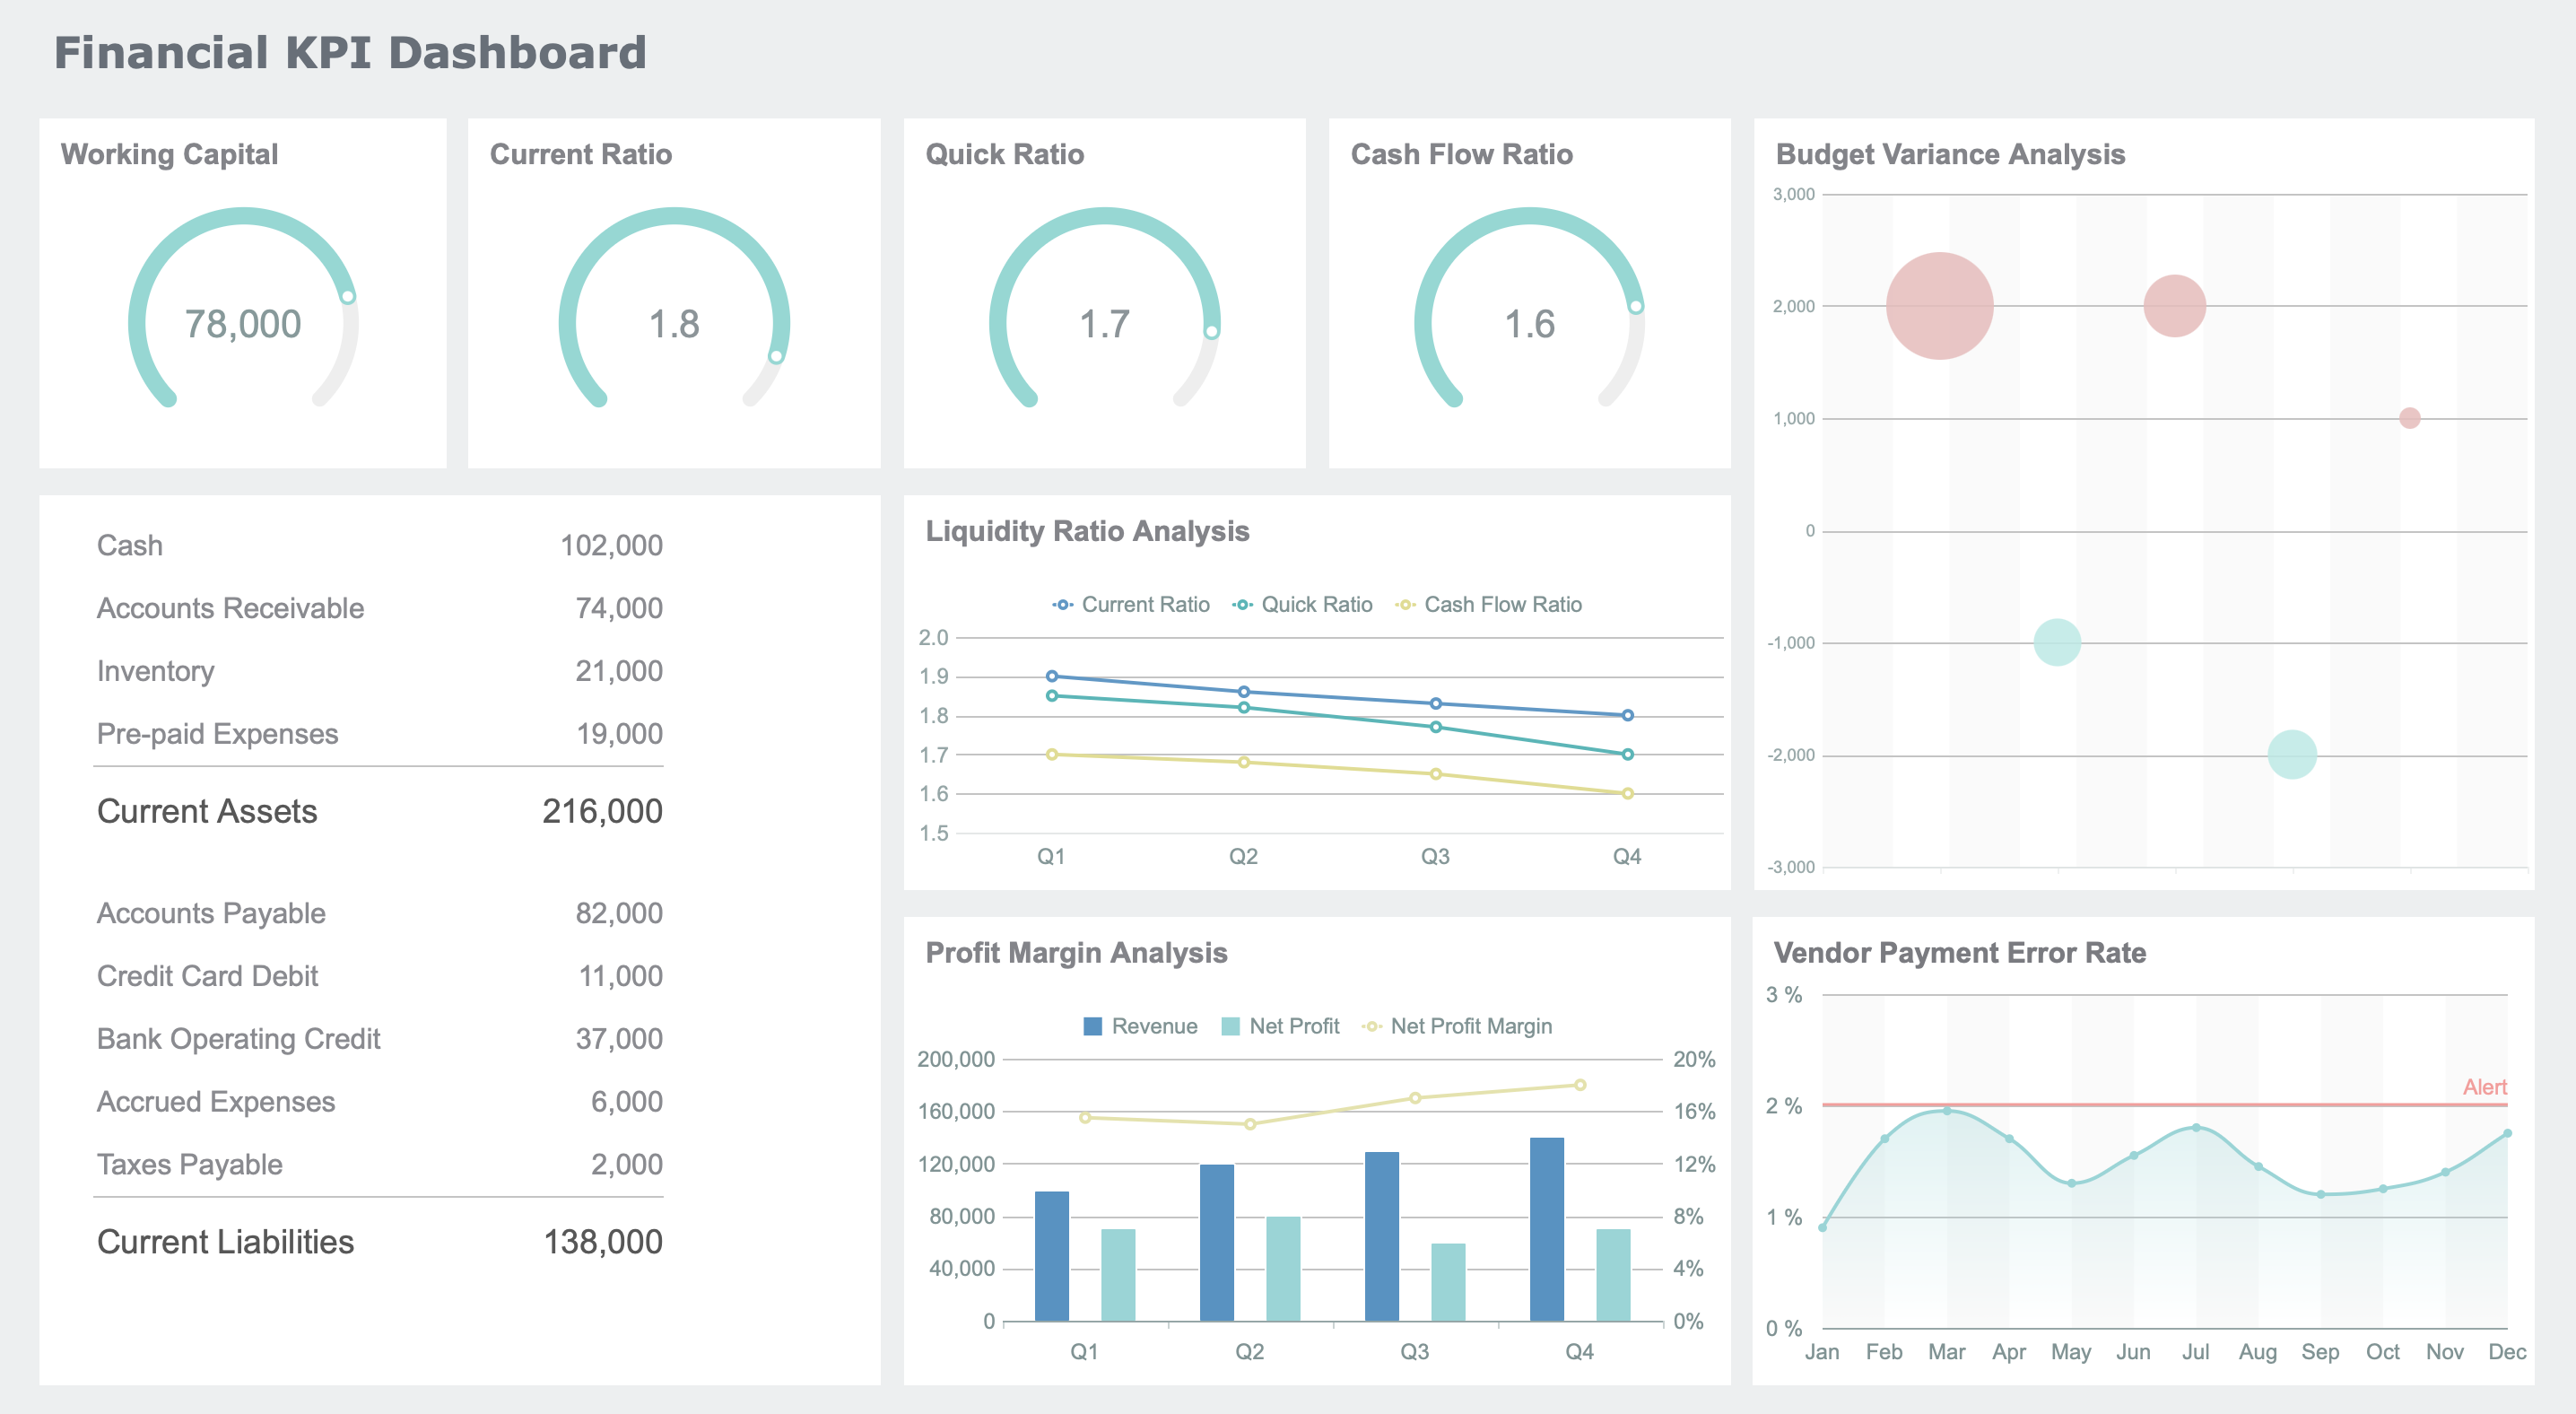
You need a clear view of your company’s financial health. FineReport’s Financial KPI Dashboard gives you that clarity. This dashboard brings together essential performance indicators in one place, making it easy for you to monitor and manage your business. You see both financial and non-financial metrics, which helps you make better decisions every day.
Here are some key metrics you can track with this dashboard:
The dashboard consolidates these critical metrics into intuitive, customizable visualizations. You can monitor performance, spot trends, and track progress toward your goals. Real-time data access, interactive filters, and drill-down features help you explore details quickly. Automation reduces manual errors and saves you time. You shift from reactive reporting to strategic execution, focusing on forecasting and long-term growth.
With FineReport, you gain a reliable tool for profitability analysis and financial performance assessment. You make smarter, faster decisions that drive your business forward.
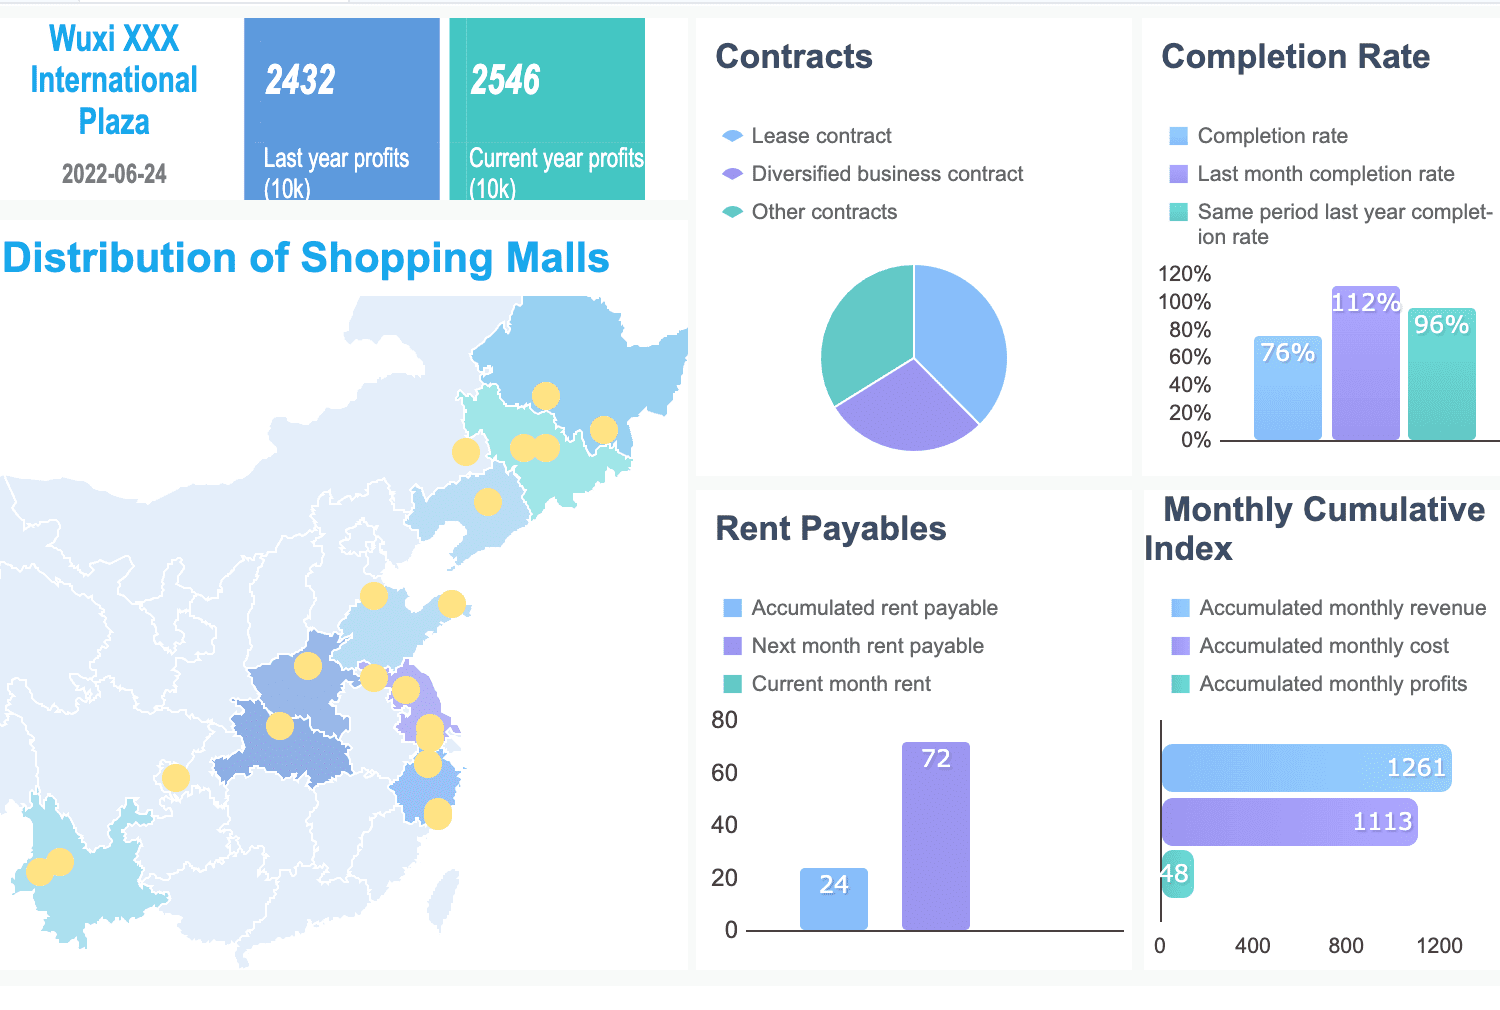
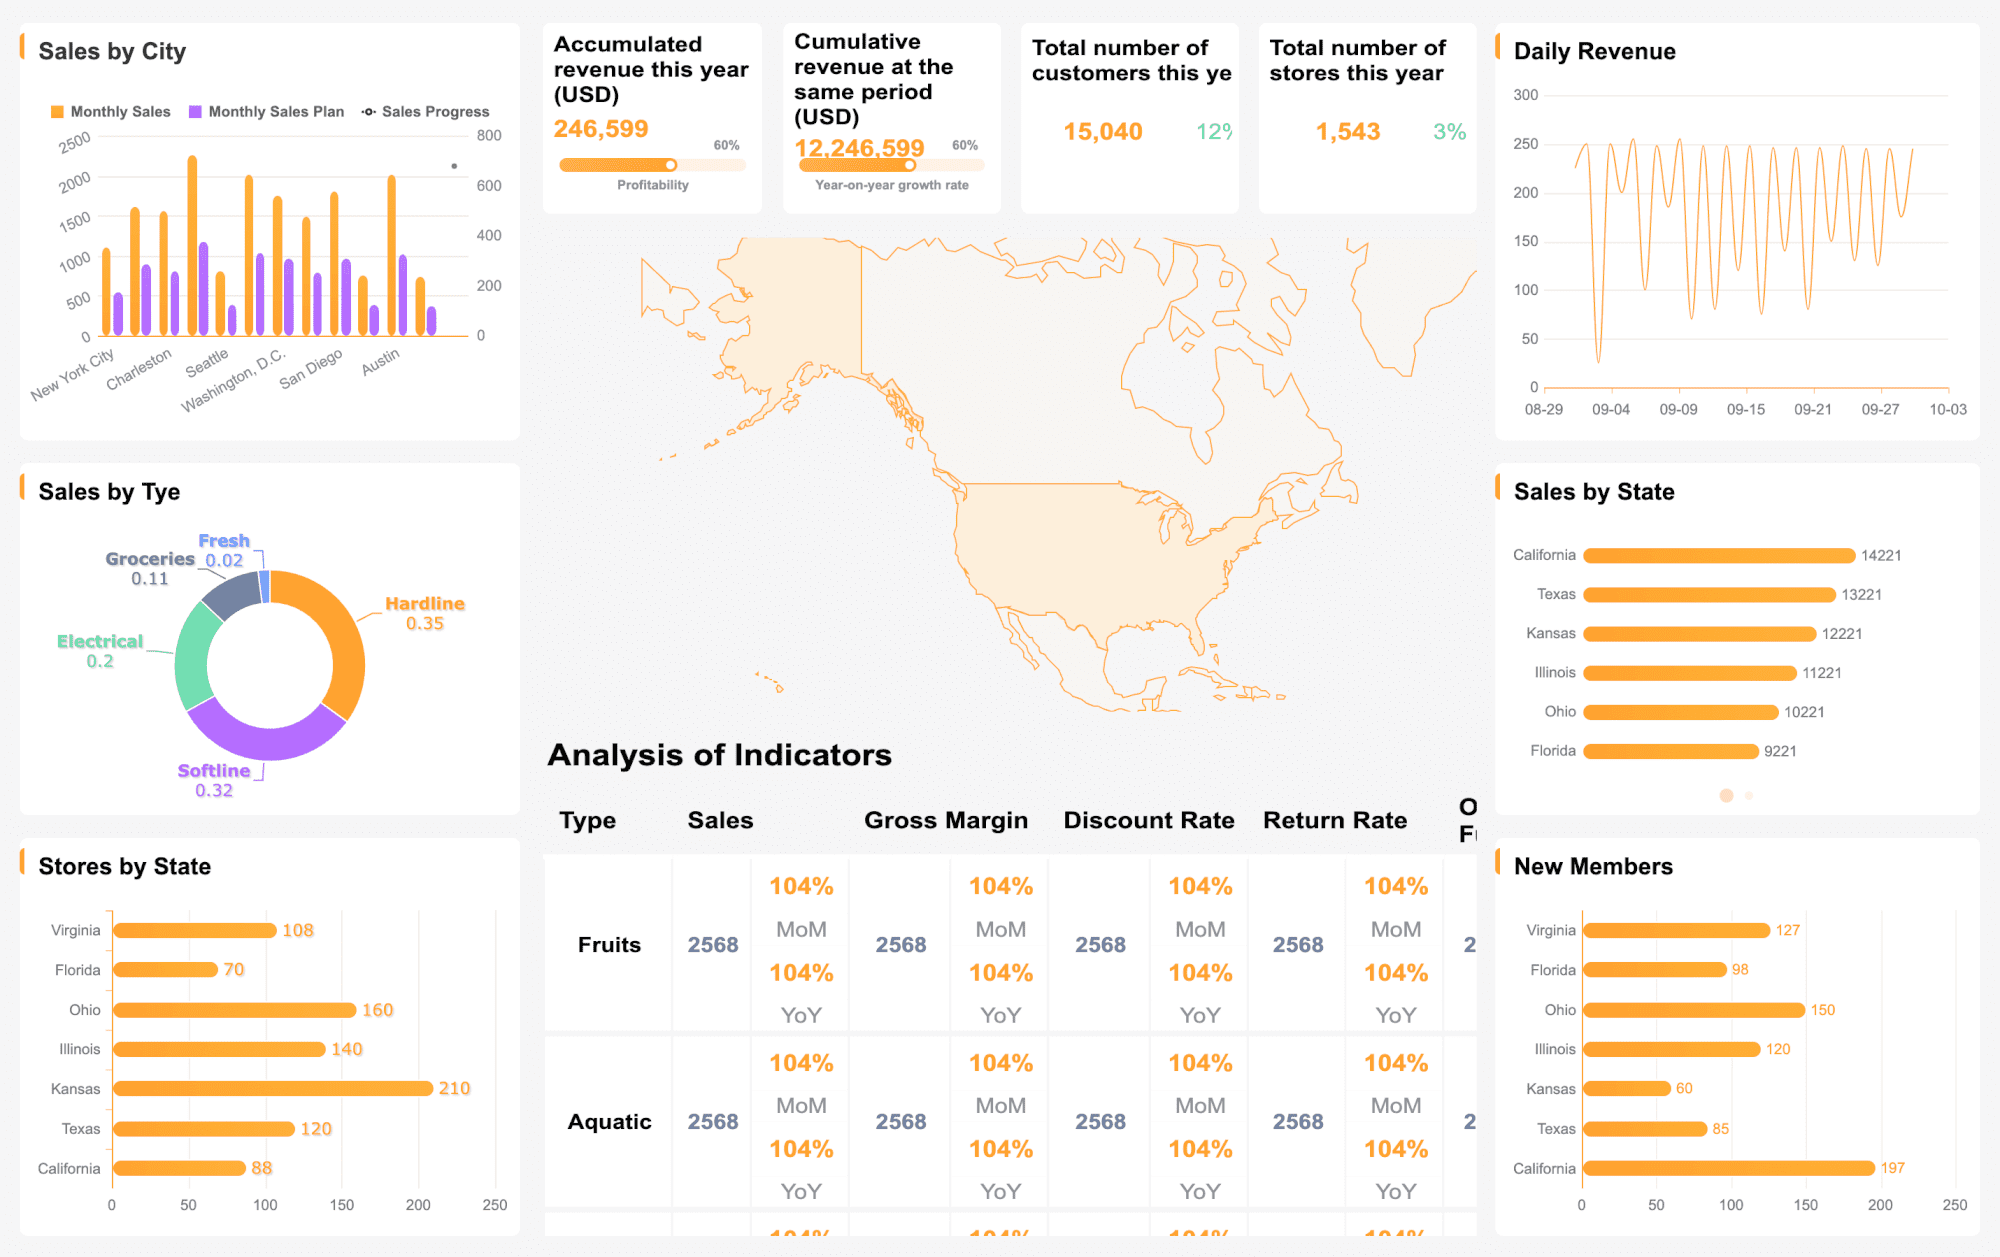
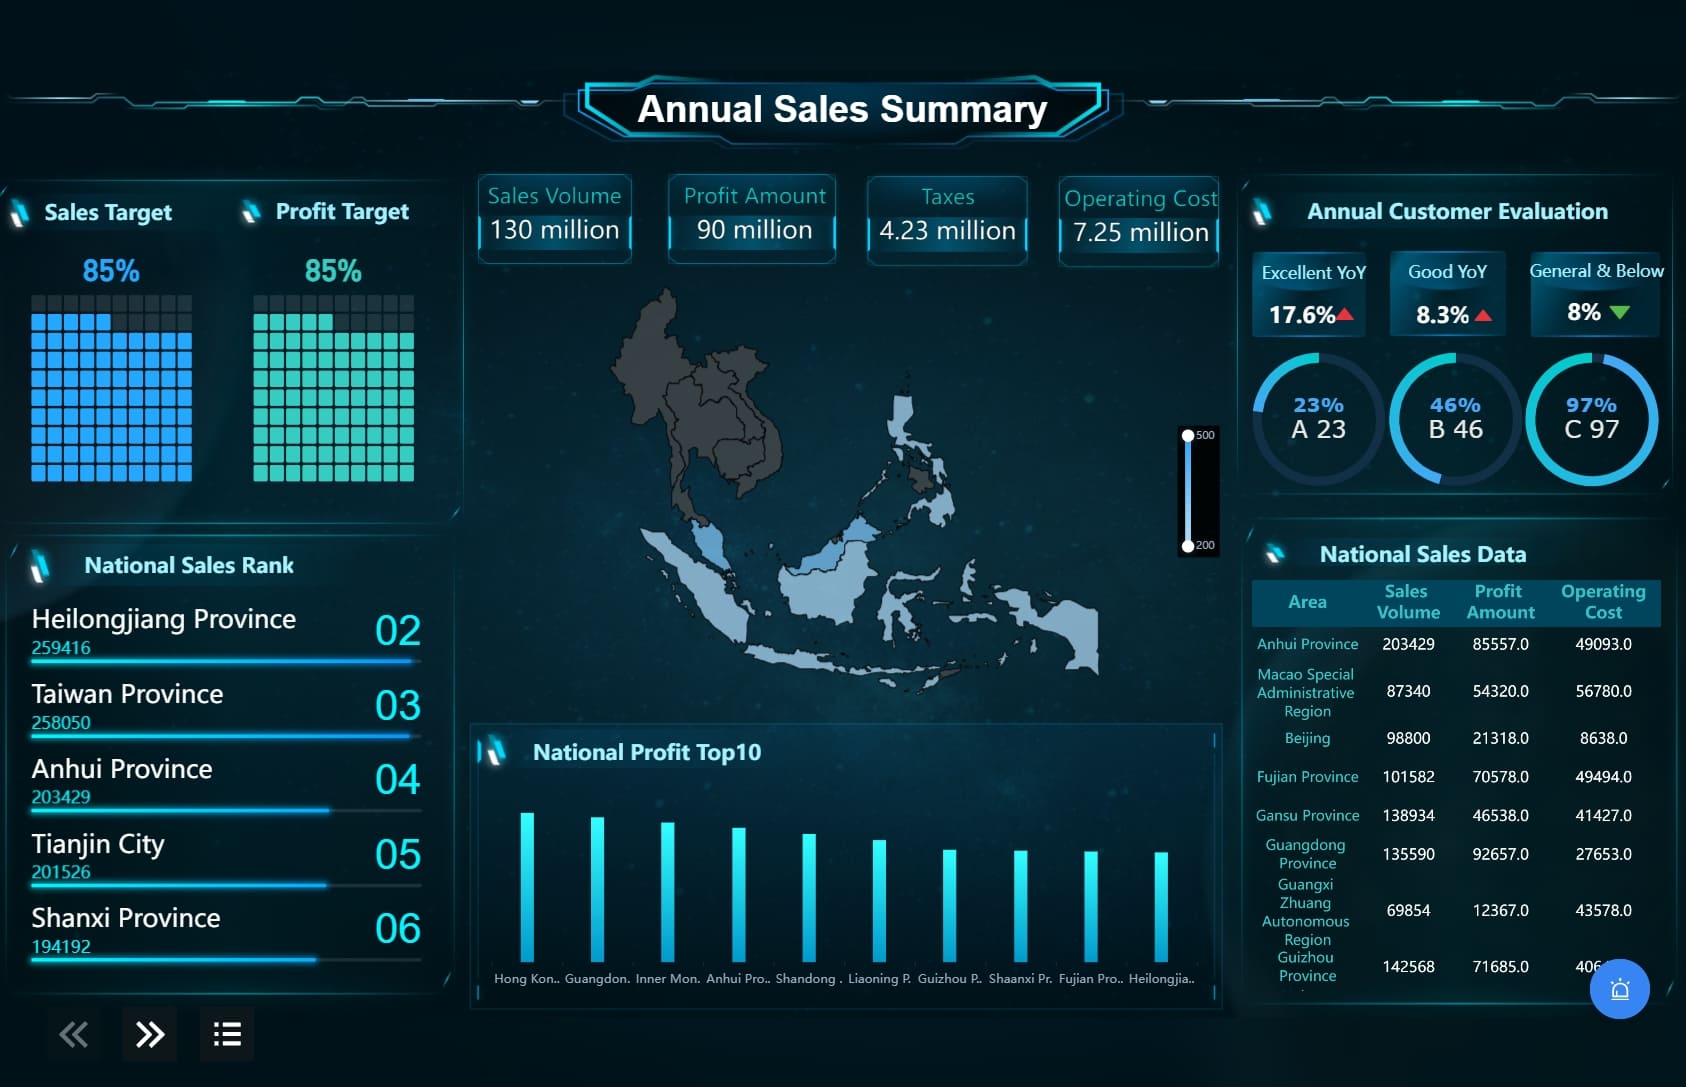
You want to understand your company’s financial performance from every angle. FineReport’s Financial Performance Dashboard helps you do just that. This dashboard visualizes a wide range of business data, making complex information easy to interpret.
| Data Type / Business Area | Visualization Type(s) | Typical Application / Description |
|---|---|---|
| Business Data | Mini Figure (bar, line, area charts) | Stock trends, market conditions |
| Sales and Personnel Data | Combination Chart (bar + pie charts) | Quarterly classification, departmental series |
| Financial Data | Sankey Diagram | Financial flow and composition analysis |
| Energy and Material Composition | Sankey Diagram | Visual analysis of energy and material flows |
| Percentage / Progress Data | Dynamic Water Balloon | Display of single percentage data and progress |
| Logistics Fleet Management | Trackmap | Real-time tracking of terminal devices |
You receive regular updates—daily, weekly, monthly, or yearly—so you always have the latest financial data. The dashboard supports trend analysis by comparing current indicators with previous periods. You can identify factors that influence changes in revenue, expenses, and cash flow. Customizable views ensure each stakeholder gets the information they need. Visualizations like graphs and charts simplify complex data, supporting continuous monitoring and transparent reporting.
FineReport’s dashboards help you stay on top of your financial performance, ensuring your business remains on track with its growth plans.
You gain a clear view of your business’s health and future by using financial analysis. FineReport makes this process easier for you through features such as:
| Future Trend | Description |
|---|---|
| Big Data & Predictive Tools | Data-driven insights and automation shape decision-making |
| Self-service Analytics | Advanced visualization improves understanding |
| AI and Automation | Real-time, personalized insights become standard |
Stay ahead by embracing these tools and trends. You empower yourself to make smarter, faster business decisions.
Click the banner below to try FineReport for free and empower your enterprise to transform data into productivity!

Effective Financial Analysis in 3 Steps
Financial Dashboard: Definition, Examples, and How-tos
A Beginner’s Guide to Financial Report: Definition, Types, Tools & Templates

The Author
Lewis
Senior Data Analyst at FanRuan
Related Articles
Data Analyst Dashboard: A Scenario-Based Guide to KPI Views That Drive Better Business Decisions
Learn how data analyst dashboards turn raw data into actionable KPI views for operational, analytical, and strategic decisions. Drive better business outcomes.
Lewis Chou
May 03, 2026

Self-Service Analytics Defined and Why You Need It
Self-service analytics lets you analyze data without IT help, empowering faster, data-driven decisions and boosting agility for your business.
Lewis
Jan 04, 2026
Best Self-Service Tools for Analytics You Should Know
See which self-service tools for analytics let business users access data, build dashboards, and make decisions faster—no IT help needed.
Lewis
Dec 29, 2025


