Ratio analysis helps you evaluate a company’s financial health by comparing different figures from its financial statements. You use ratio analysis to measure profitability, liquidity, solvency, and efficiency. This approach allows you to see how well a business manages its resources and meets its financial obligations.
When you understand key financial ratios, you make better decisions about investments and resource allocation. Ratio analysis offers several benefits:
- It highlights strengths and weaknesses in financial health.
- It supports informed decision-making.
- It enables benchmarking against industry standards.
- It increases transparency and accountability.
- It assists with risk management.
Modern BI tools like FineBI make ratio analysis and financial reporting faster and more accurate by automating calculations and visualizing results.
Ratio Analysis Overview
What Is Ratio Analysis
Ratio analysis gives you a structured way to evaluate a company’s financial performance. You use data from financial statements to calculate financial ratios that measure profitability, liquidity, solvency, and operational efficiency. Leading financial authorities define ratio analysis as a method that helps you assess these areas by comparing figures over time, against industry benchmarks, or with other businesses. When you apply ratio analysis, you turn complex financial data into clear metrics that support quick decision-making.
You often see financial ratios like the current ratio, quick ratio, and debt-to-equity ratio in reports. The current ratio shows if a company can meet short-term obligations. The quick ratio provides a stricter view of liquidity by excluding inventory. The debt-to-equity ratio reveals how much leverage a company uses, which can indicate financial risk. These financial ratios help you understand how well a business manages its resources and meets its obligations.
Why Ratio Analysis Matters
Ratio analysis plays a vital role in financial management. You rely on financial ratios to measure profitability, assess operational efficiency, ensure liquidity, and determine the financial health of an organization. The table below highlights the primary objectives of ratio analysis:
| Objective | Description |
|---|---|
| Measure Profitability | Understand if a business yields enough profits using ratios like gross profit and net profit. |
| Assess Operational Efficiency | Evaluate how efficiently a company manages assets and resources. |
| Ensure Easy Cash Availability | Use liquidity ratios to confirm the company can meet cash requirements. |
| Determine Financial Health | Assess long-term solvency and stability with ratios such as debt-equity ratio. |
| Compare Performance | Benchmark against industry standards and previous years to guide improvement. |
Ratio analysis improves the accuracy of financial health assessments. You benefit from several advantages:
- Simplifies complex data into manageable metrics.
- Enables meaningful comparisons across companies and industries.
- Identifies trends early, allowing you to respond proactively.
- Supports strategic planning by informing financial projections.
When you use ratio analysis regularly, you gain deeper insights into a company’s strengths and weaknesses. This process helps you make informed decisions and supports long-term success.
Key Financial Ratios

Understanding key financial ratios is essential for effective ratio analysis. These ratios help you evaluate a company’s financial performance from multiple perspectives. Each category of financial ratios provides unique insights into how a business operates, manages resources, and creates value for stakeholders. By mastering these ratios, you can make more informed decisions and compare companies across industries.
The table below summarizes the main categories of financial ratios, their descriptions, and common examples:
| Category | Description | Examples |
|---|---|---|
| Profitability | Measures how successful a company is at running its business | Gross Margin, Return on Equity |
| Market/Valuation | Assesses investors' view of company performance and value | P/E Ratio, Dividend Yield |
| Liquidity | Evaluates a company’s ability to meet short-term obligations | Current Ratio, Quick Ratio |
| Leverage/Solvency | Examines the level of debt and financial risk | Debt-to-Equity, Interest Coverage |
| Efficiency/Activity | Analyzes how well a company uses its assets and manages liabilities | Inventory Turnover, Asset Turnover |
You can use ratio analysis to compare these financial ratios over time, against industry benchmarks, or with competitors. This approach reveals strengths, weaknesses, and trends that may not be obvious from raw financial statements.
Profitability Ratios
Profitability ratios show how well a company generates profit relative to sales, assets, or equity. These ratios help you assess whether a business is making efficient use of its resources to create value. Common profitability ratios include:
| Ratio | Formula |
|---|---|
| Gross Profit Margin | (Revenue – Cost of Sales) / Revenue × 100 |
| Operating Profit Margin | Operating Profit / Revenue × 100 |
| EBITDA Margin | EBITDA / Revenue × 100 |
| Net Profit Margin | Net Income / Revenue × 100 |
| Return on Assets (ROA) | Annualized EBIT / Total Assets × 100 |
| Return on Equity (ROE) | Annualized Net Income / Opening Total Equity × 100 |
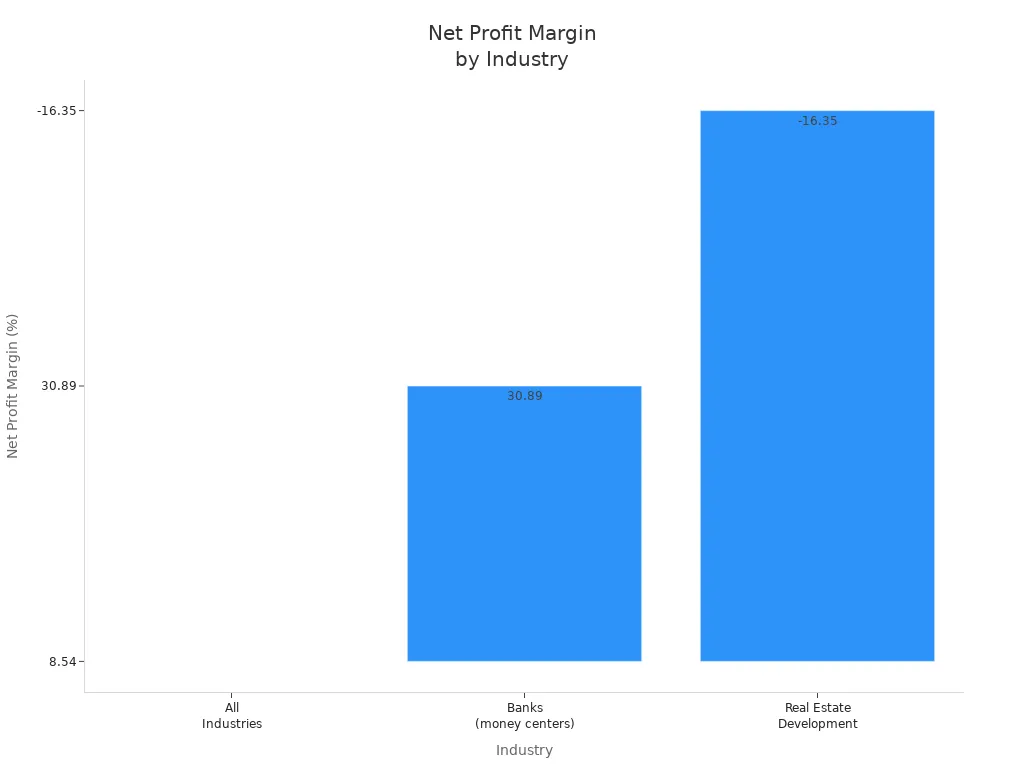
You can use profitability ratios to compare a company’s performance with industry averages. For example, the average gross profit margin across all industries is 36.56%, while banks often report much higher margins. The net profit margin for banks averages 30.89%, but real estate development can show negative margins, such as -16.35%. These differences highlight the importance of context in ratio analysis.
Return on equity (ROE) is another critical measure. It shows how effectively a company uses shareholders’ equity to generate profits. A higher ROE usually signals strong management and efficient use of capital.
Liquidity Ratios
Liquidity ratios measure a company’s ability to meet its short-term obligations. These financial ratios are crucial for assessing whether a business can pay its bills on time. The most common liquidity ratios include:
- Current Ratio: Compares current assets to current liabilities. A ratio above 1 suggests the company can cover its short-term debts.
- Quick Ratio: Excludes inventory from current assets, offering a stricter view of liquidity.
- Cash Ratio: Focuses only on cash and cash equivalents, providing the most conservative measure.
Liquidity ratios help you determine if a company has enough resources to handle unexpected expenses or downturns. A strong liquidity position reduces financial risk and increases confidence among investors and creditors.
Solvency Ratios
Solvency ratios provide insight into a company’s long-term financial stability. These ratios show how much of the business is financed by debt versus equity and whether the company can meet its long-term obligations. Key solvency ratios include:
- Debt-to-Equity Ratio: Compares total liabilities to shareholders’ equity. A lower ratio indicates less reliance on debt.
- Debt-to-Assets Ratio: Measures the percentage of assets financed by debt.
- Interest Coverage Ratio: Assesses the company’s ability to pay interest on outstanding debt.
- Equity Ratio: Shows the proportion of assets financed by equity.
For example, the average debt-to-equity ratio in the technology sector is 0.48, while industrials range from 0.28 to 2.18. Monitoring solvency ratios helps you manage financial risk and compare a company’s standing with industry benchmarks.
Activity Ratios
Activity ratios, also known as efficiency ratios, evaluate how well a company uses its assets and manages its operations. These financial ratios help you track operational effectiveness, such as inventory management and receivables collection. Common activity ratios include:
- Inventory Turnover Ratio: Measures how many times inventory is sold and replaced during a period.
- Accounts Receivable Turnover Ratio: Indicates how quickly a company collects payments from customers.
- Total Asset Turnover Ratio: Shows how efficiently a company uses its assets to generate sales.
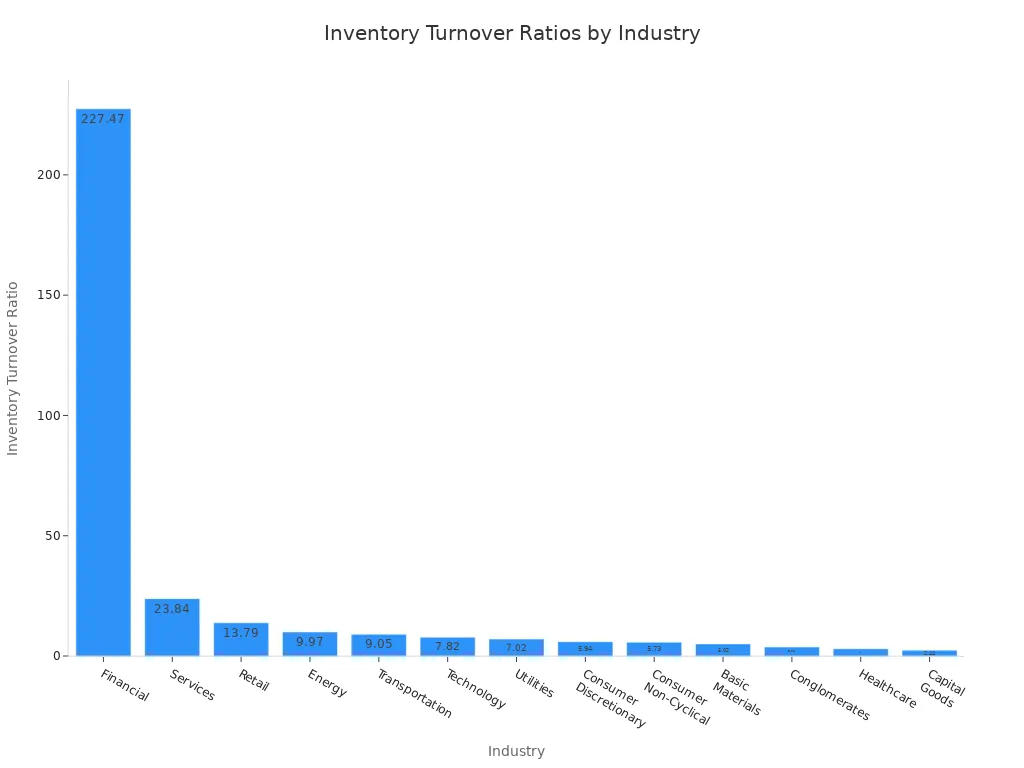
The average inventory turnover ratio varies by industry. Retail businesses average 13.79, while financial firms report much higher numbers. In retail, the accounts receivable turnover ratio typically ranges from 8 to 12 times per year.
By analyzing activity ratios, you can identify areas for improvement in operations and compare efficiency with peers.
Valuation Ratios
Valuation ratios help you determine whether a company’s shares are fairly priced in the market. These financial ratios are essential for investors who want to assess the attractiveness of a stock. Common valuation ratios include:
| Valuation Ratio | Description |
|---|---|
| Price-to-Earnings (P/E) | Compares stock price to earnings per share, indicating if the stock is cheap or expensive. |
| Price/Sales (P/S) | Measures stock price relative to revenue per share. |
| Price/Book (P/B) | Compares stock price to book value per share. |
| Dividend Yield | Shows return from dividends, calculated as annual dividend per share divided by stock price. |
| Market Capitalization | Total market value of outstanding shares. |
Valuation ratios allow you to compare companies within the same industry. For example, leading S&P 500 companies have varying P/E ratios: NVIDIA at 52.03, Apple at 39.79, and Microsoft at 37.89.
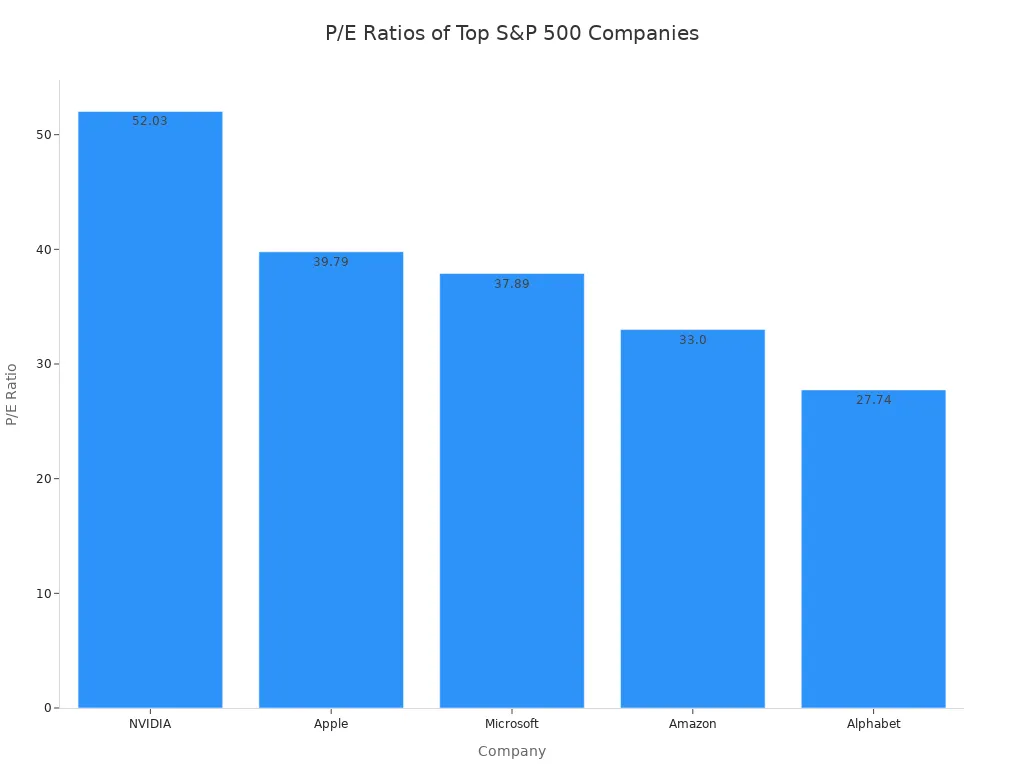
These ratios help you decide if a stock is undervalued, overvalued, or fairly priced.
How FineBI Streamlines Ratio Analysis
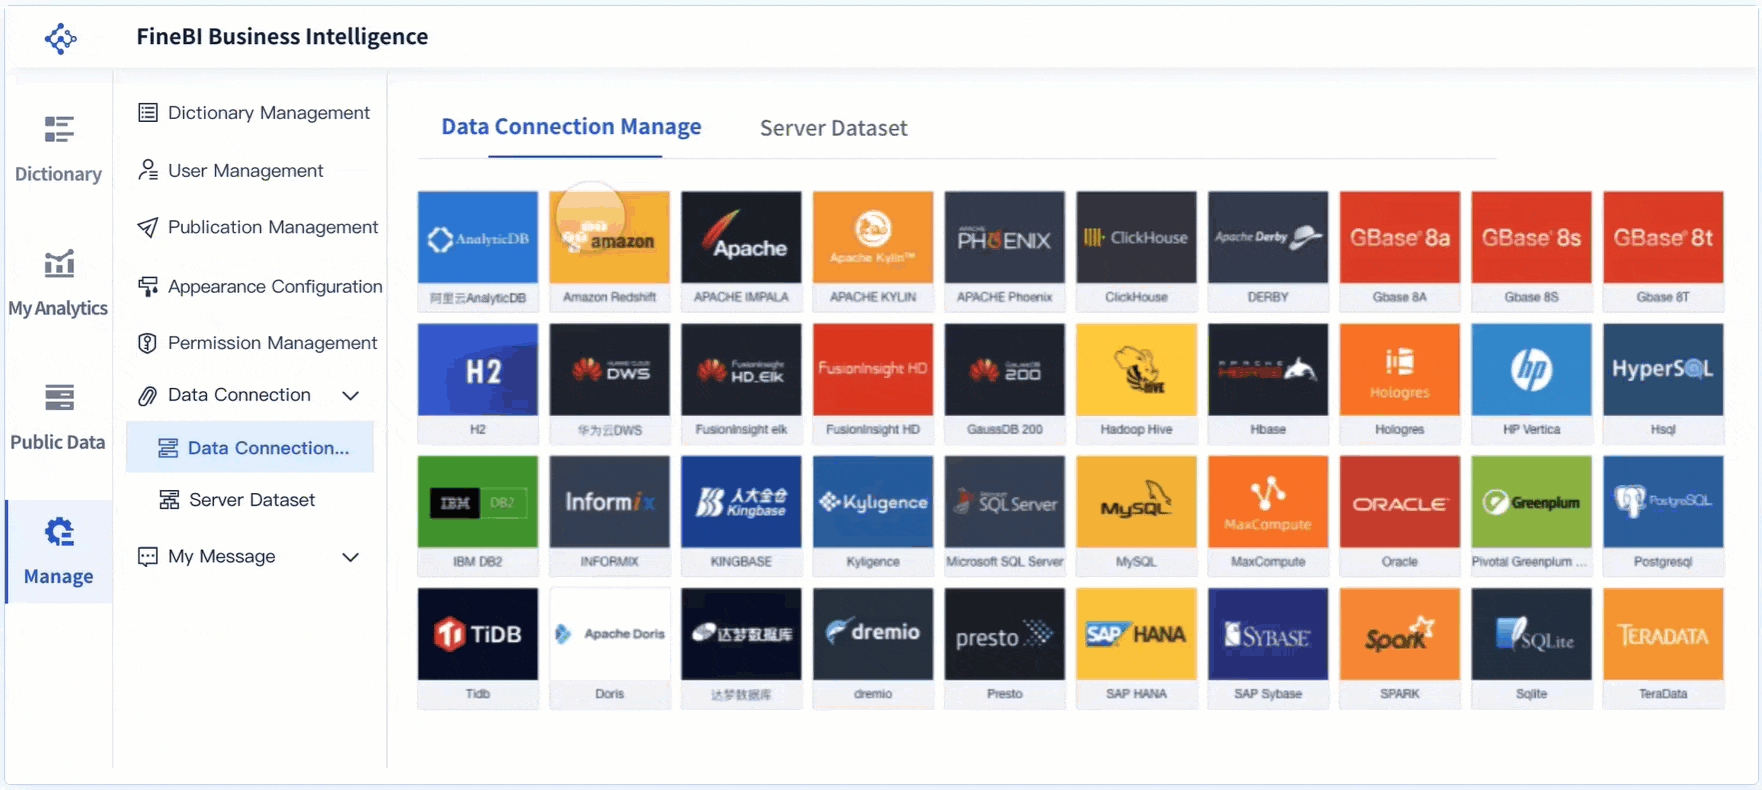
Business intelligence tools like FineBI make ratio analysis more efficient and accessible. FineBI connects to multiple data sources, aggregates financial data, and automates the calculation of financial ratios. You can use interactive dashboards to visualize trends, compare ratios across periods, and benchmark against industry standards.
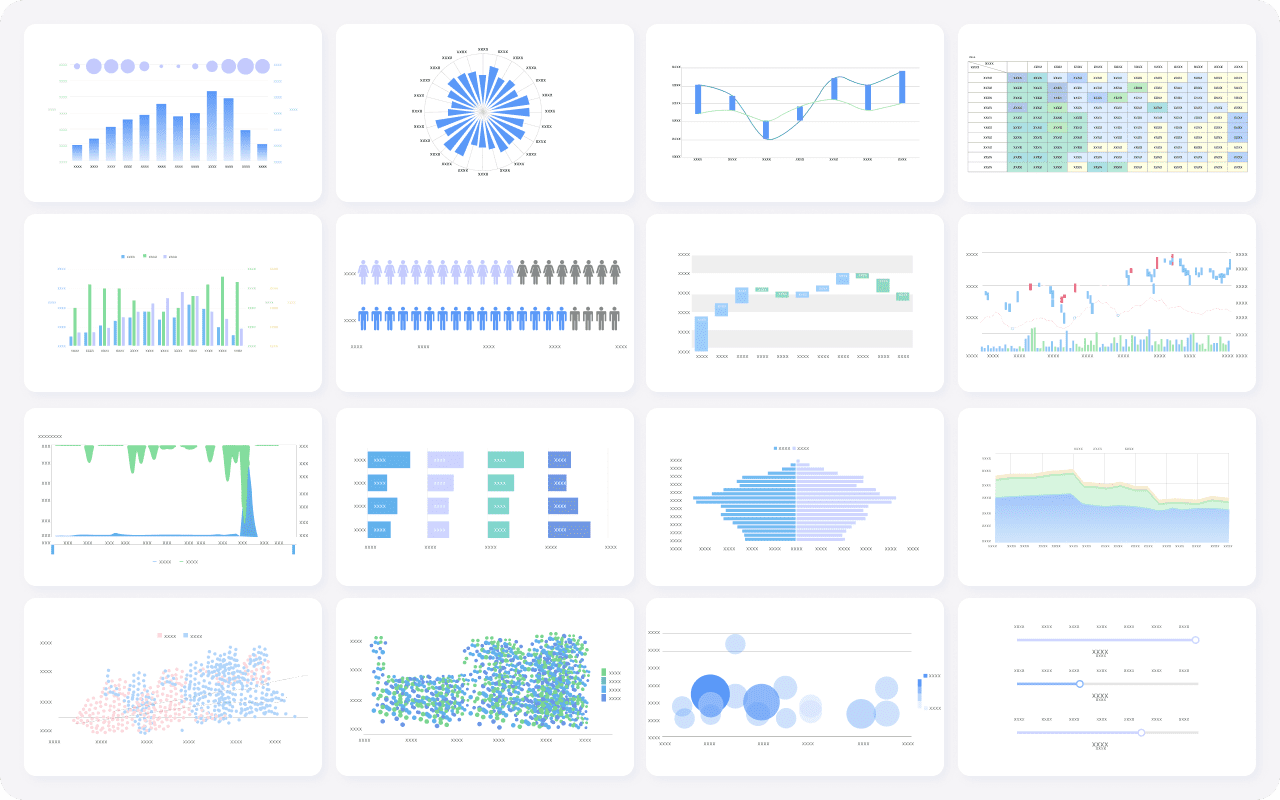
FineBI offers a variety of chart types, such as waterfall charts, which clarify the composition and changes in financial metrics. Real-time monitoring and scenario analysis features support strategic planning and risk management. With FineBI, you can quickly identify patterns, spot anomalies, and make data-driven decisions without manual calculations.
Tip: FineBI empowers you to explore financial ratios independently, reducing reliance on IT teams and speeding up your analysis process.
By leveraging FineBI, you gain a comprehensive view of your company’s financial health and can respond proactively to changes in performance.
Applying Ratio Analysis
Trend Analysis
You use ratio analysis to track changes in financial performance over time. By examining financial ratios across several periods, you can spot trends that reveal whether a company is improving or facing challenges. This approach helps you see patterns in profitability, liquidity, and efficiency. When you notice a steady increase in the current ratio, for example, you know the company is strengthening its ability to meet short-term obligations.
Trend analysis offers several important benefits:
- It helps you predict future company performance, which supports better budgeting and strategic planning.
- You can identify key performance drivers by uncovering growth patterns and revenue fluctuations. This allows you to adjust your strategies and allocate resources more effectively.
When you apply ratio analysis for trend analysis, you gain a clearer picture of how business decisions and market conditions affect financial health. You can respond quickly to negative trends and build on positive momentum.
Benchmarking
Benchmarking with ratio analysis lets you compare your company’s financial ratios to industry standards and top competitors. This process helps you understand where your business stands and where you can improve. To benchmark effectively, you should follow these best practices:
- Identify Key Performance Indicators (KPIs) that matter most for your business and industry.
- Gather industry data from reliable sources, such as RMA’s Annual Statement Studies, Dun & Bradstreet's Key Business Ratios, or the Small Business Industry Financial Benchmark Data Library.
- Compare your financial ratios to industry averages and leading competitors. Look for gaps and areas where you outperform or lag behind.
- Set realistic performance goals based on your analysis.
- Implement strategies to reach these goals and monitor your progress regularly.
You should also ensure data accuracy and consistency when benchmarking. Normalize definitions and reporting periods, and adjust for company size to make fair comparisons.
| Source | Description |
|---|---|
| RMA’s Annual Statement Studies | Trusted source of comparative industry benchmarking data for small businesses and lenders. |
| Dun & Bradstreet's Key Business Ratios | Provides access to competitive benchmarking data from public and private companies. |
| Small Business Industry Financial Benchmark Data Library | Uses recent IRS data for benchmarking, updated as new tax return data becomes available. |
Benchmarking with ratio analysis helps you set clear targets and measure your progress. You can use these insights to guide strategic decisions and improve your company’s financial health.
Using FineBI for Ratio Analysis
FineBI makes ratio analysis faster and more accurate. You can connect FineBI to multiple data sources, such as databases, spreadsheets, and cloud platforms. This integration brings all your financial data together in one place. FineBI automates the calculation of financial ratios, so you do not need to perform manual computations. You can create interactive dashboards that visualize trends, compare ratios over time, and benchmark against industry standards.
With FineBI, you can:
- Integrate data from different systems for a unified view.
- Build custom datasets and apply formulas to calculate financial ratios automatically.
- Use drag-and-drop tools to create charts and dashboards that highlight key metrics.
- Set up real-time alerts for important changes in financial ratios.
- Share dashboards securely with your team for better collaboration.
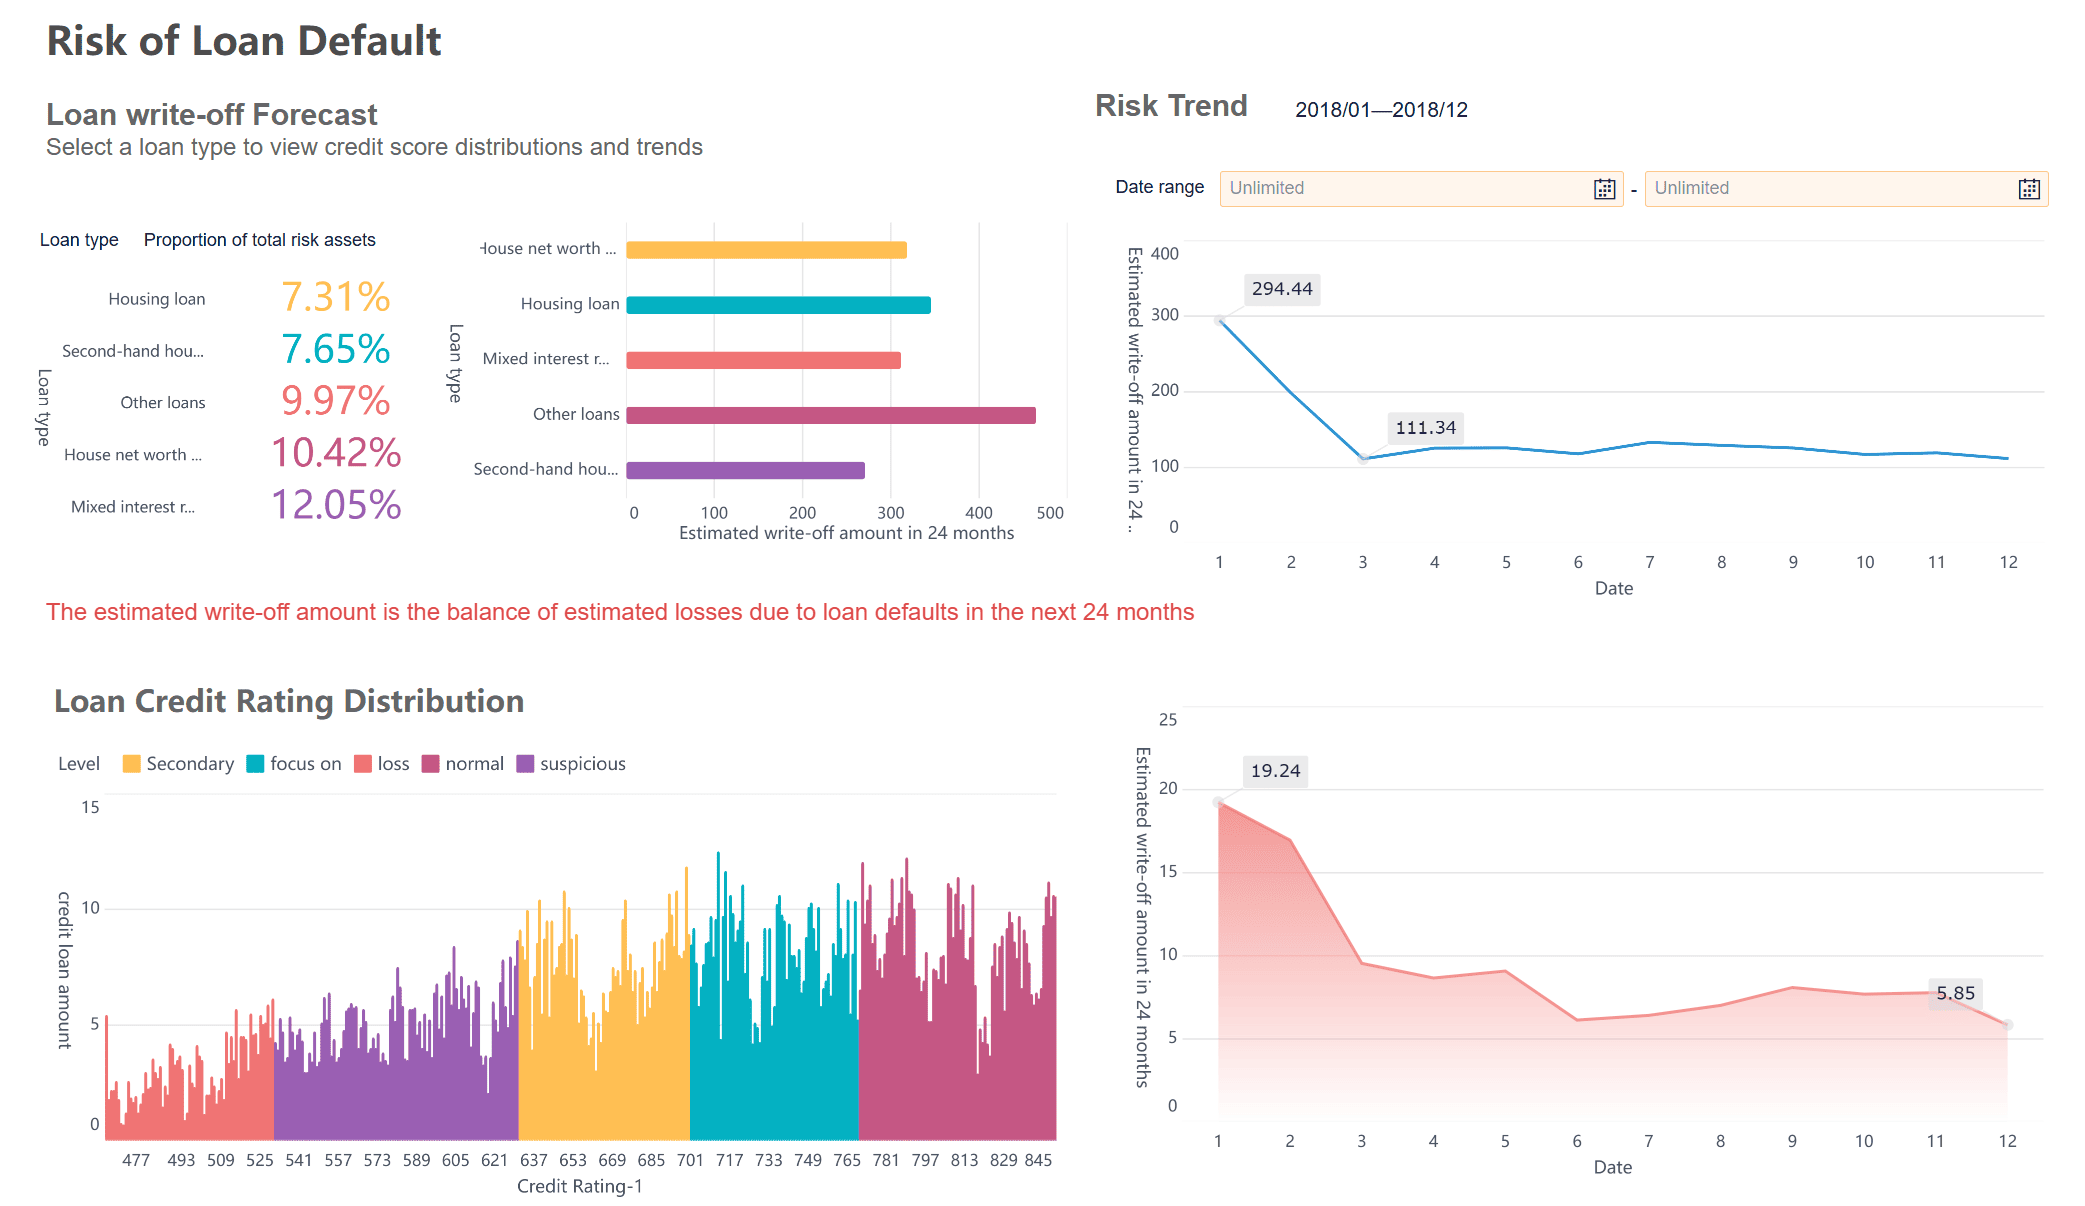
FineBI’s visual exploration features help you spot trends and anomalies quickly. You can drill down into the data to understand what drives changes in financial ratios. This empowers you to make informed decisions and respond to risks or opportunities as they arise.
The experience of Founder Securities shows the real-world value of FineBI in financial management. The company used FineBI to empower over 2,000 employees to access and analyze data independently. During a major merger, FineBI enabled the team to segment and migrate 50,000 user accounts efficiently. Employees could monitor key financial ratios and performance metrics in real time. This improved operational efficiency and supported data-driven decision-making across the organization.
Note: FineBI reduces your reliance on IT teams by enabling self-service ratio analysis. You can explore financial data, generate insights, and share findings with ease.
By using FineBI for ratio analysis, you gain a comprehensive understanding of your company’s financial health. You can track performance, benchmark against industry standards, and make strategic decisions with confidence.
Ratio analysis gives you a clear view of your company’s financial health and supports better decision-making. When you use financial ratios, you uncover hidden strengths and weaknesses, plan for the future, and manage risk more effectively. Studies show that profitability, solvency, and activity ratios all influence business value and growth. FineBI helps you analyze data efficiently and spot trends in real time. To get started:
- Gather your financial data.
- Calculate key ratios.
- Compare results with industry benchmarks.
- Use insights to guide your next business moves.
Modern tools like FineBI make ratio analysis faster and more accurate, helping you drive better outcomes.

Continue Reading about Ratio Analysis
Data Analytics Meaning Explained for Modern Businesses


FAQ

The Author
Lewis
Senior Data Analyst at FanRuan
Related Articles

What Recruiters Look for in a Data Analysis Portfolio: 10 Criteria to Score Yours Fast
A $1 is not judged like a school assignment. It is judged like a hiring shortcut. Recruiters, hiring managers, and analytics leads use it to answer one question fast: Can this person solve business problems with data in
Lewis Chou
May 29, 2026

What Is Data Analytics Consulting? Beginner’s Guide to Services, Deliverables, and Business Value
$1 helps organizations turn raw data into decisions they can trust. For many business leaders, the challenge is not a lack of data. It is a lack of clarity. Reports conflict, teams track different KPIs, dashboards are un
Lewis Chou
Jun 03, 2026

Data Analyst Job Description [+2026 Guide]: Compare Responsibilities, Skills, and Salary by Industry
A strong $1 does more than list tasks. It defines how a company turns raw data into business decisions, which teams the analyst supports, and what measurable outcomes the role is expected to influence. For employers, tha
Lewis Chou
Jun 02, 2026