The main responsibilities of a data analyst revolve around transforming raw information into actionable insights for your organization. You collect, clean, interpret, and report on data to support decision-making. Mastering analytics means you identify patterns, solve problems, and communicate findings clearly. Understanding the data analyst job description helps you focus your skill development and align your career goals with industry expectations.

When you clarify your path, you open doors to strong job stability, competitive salaries, and opportunities to advance into senior analytics roles or management.
When you read a typical data analyst job description, you see a clear focus on turning raw data into valuable insights. You collect, organize, and analyze large datasets to find patterns and trends. Many organizations describe you as a "modern-day detective" who uses analytics to solve business problems. Your daily tasks often include:
You need strong analytical, numerical, and technical skills. Business knowledge, decision-making, problem-solving, and communication abilities also play a big part in your success. Most companies position the data analyst job description as an entry or early-career role, but it offers real opportunities to make a difference and grow your career.
You play a vital role in helping organizations make smarter choices. Companies like Google, Starbucks, and Amazon rely on analytics to guide their strategies. For example, Google improved its leadership programs by analyzing thousands of performance reviews. Starbucks uses analytics to choose store locations, and Amazon’s recommendation engine drives a large share of its sales.
When you work as a data analyst, you help your company align analytics projects with business goals. You set up key performance indicators (KPIs) that show real results, such as cost savings or revenue growth. You also help build a culture of continuous learning and experimentation. By sharing knowledge and working with different teams, you boost operational efficiency and customer satisfaction.
A recent study found that companies using strong data analysis see better decision-making and improved business performance. Your work ensures that analytics efforts lead to measurable outcomes and greater business agility.
As a data analyst, you take on a wide range of roles and responsibilities that drive business success. Your daily work covers the entire data analysis process, from data collection and cleaning to generating reports and presenting findings. Let’s break down the core data analyst tasks and see how modern tools like FineBI and FineReport help you deliver actionable insights.

You start by gathering data from multiple sources. This step forms the foundation of analytics. You might use surveys, transactional tracking, interviews, observation, online tracking, forms, or social media monitoring to collect information. Each method helps you capture different types of data, whether it’s customer feedback, sales transactions, or website activity.
Did you know? Most data analysts spend more than half their time on data collection and cleaning. According to industry surveys, this can range from 50% to over 80% of your workweek.
| Survey/Source | Time Spent on Data Preparation (Cleaning, Organizing, Collecting) |
|---|---|
| Crowdflower 2015 | 66.7% |
| Crowdflower 2016 | 60% cleaning + 19% collecting = ~80% |
| Crowdflower 2017 | 51% collecting, labeling, cleaning, organizing |
| Figure Eight 2019 | 73.5% spend at least 25% of time on data management tasks |
| Kaggle 2018 | 11% gathering + 15% cleaning = 26% |
| Bizreport 2015 | 50-90% |
| NY Times 2014 | 50-80% |
![1[1].jpg](https://media.finebi.com/strapi/1_1_2658b0ae2c.jpg)
You rely on tools like FineBI to connect to databases, cloud warehouses, and APIs. FineBI’s drag-and-drop interface lets you integrate data from over 60 sources without writing code. This streamlines the data collection and analysis phase, making it easier to focus on analytics instead of manual data wrangling.
Common methods and tools you use for data collection and analysis include:
FineReport also supports seamless integration with business systems, helping you unify scattered data and eliminate silos. This unified approach ensures you have reliable data for every analytics project.
Once you collect the data, you move to cleaning and preparation. This step is critical for ensuring data quality. You remove duplicates, fix errors, handle missing values, and standardize formats. You focus on the three Cs: completeness, consistency, and correctness.
Your process often includes:
You also document your cleaning steps to ensure transparency and reproducibility. FineBI and FineReport offer built-in data cleaning tools, allowing you to preview, filter, and transform data visually. This reduces manual effort and helps you maintain high data quality.
Tip: Data security is always a concern. You use access controls and encryption to protect sensitive information during cleaning and preparation.
You face challenges like managing large volumes of data, balancing automation with human review, and standardizing names or addresses. FineBI’s visual workflows and FineReport’s integration features help you address these challenges efficiently, even as your datasets grow.
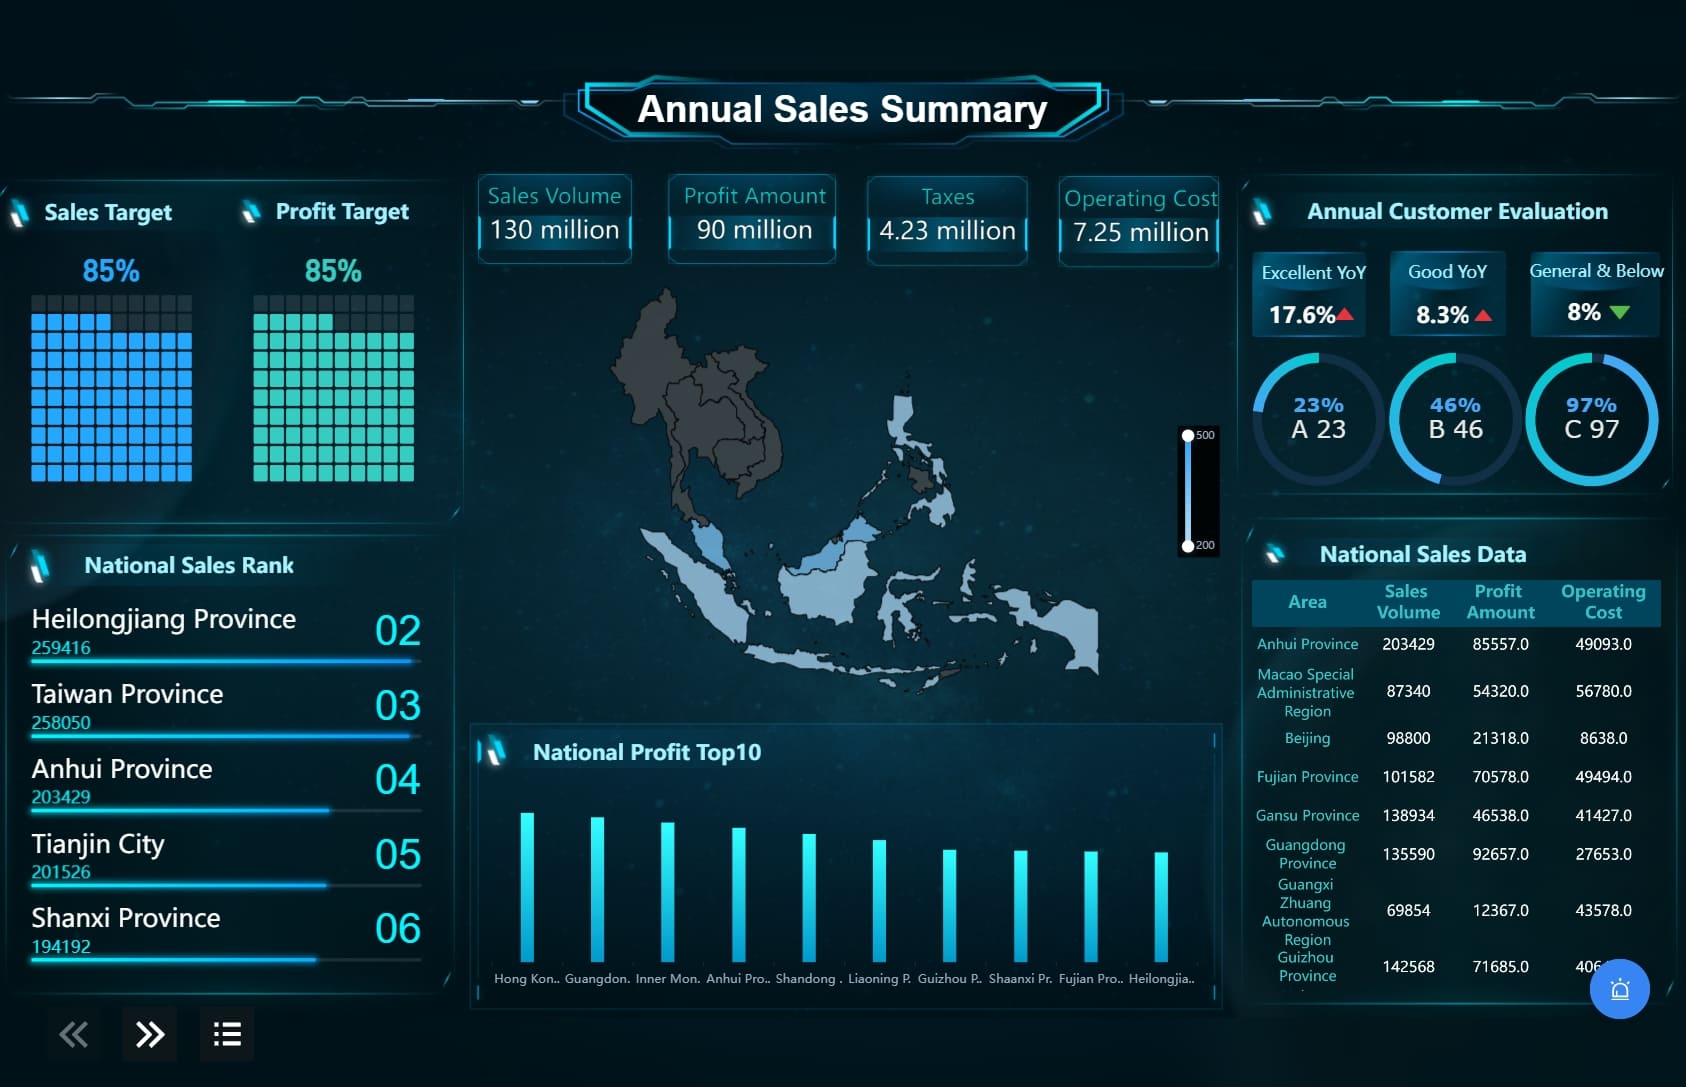
After preparing your data, you move to data visualization and dashboard creation. This is where you turn raw numbers into clear, compelling visuals that drive decision-making. You use charts, graphs, maps, and dashboards to highlight trends, patterns, and outliers.
| Visualization Category | Techniques Included | Purpose / Use Case Examples |
|---|---|---|
| Basic Charts and Graphs | Bar charts, Line charts, Pie charts, Histograms | Comparing categories, showing trends, illustrating proportions, displaying distributions |
| Advanced Visualizations | Heatmaps, Scatter plots, Bubble charts, Treemaps | Highlighting patterns, multi-dimensional data, hierarchical data |
| Specialized Techniques | Geospatial maps, Network diagrams, Sankey diagrams, Gantt charts | Location-based analysis, relationship mapping, flow visualization, project tracking |
| Interactive Dashboards | Real-time dashboards, Drill-down reports | Dynamic exploration, timely decision-making |
FineBI empowers you to create interactive dashboards with drag-and-drop simplicity. You can build real-time dashboards, apply filters, and share insights across your organization. FineReport lets you design pixel-perfect reports and large-screen dashboards, supporting everything from executive summaries to operational command centers.
Both tools help you move beyond static reports. You can generate dynamic dashboards for sales, finance, or operations, making reporting and presentation more engaging and actionable. This approach supports analytics at every level, from daily operations to strategic planning.
Collaboration is a key part of your roles and responsibilities as a data analyst. You work closely with product managers, IT teams, data scientists, and business stakeholders. This teamwork ensures that analytics projects align with business goals and deliver real value.
You use collaborative analytics platforms to share insights, co-develop models, and make data-driven decisions in real time. FineBI and FineReport support team-based workflows, allowing you to share dashboards, annotate findings, and manage permissions easily.
When communicating insights, you:
| Format | Strengths and Applications | Example Use Case |
|---|---|---|
| Written Reports | In-depth exploration, thorough understanding | Market research reports |
| Slide Decks | Visually appealing, concise, engaging | Product launch overviews |
| Dashboards | Interactive, dynamic, customizable | Sales performance tracking |
| Videos/Webinars | Visual and auditory, personal connection, replayable | Training sessions, briefings |
You play a central role in generating reports and presenting findings to both technical and non-technical audiences. Your ability to translate analytics into actionable insights ensures that your organization can respond quickly to new opportunities and challenges.
Note: In industries like healthcare, finance, and manufacturing, cross-functional collaboration leads to richer insights and better business outcomes.
By mastering these roles and responsibilities, you become a trusted partner in your organization’s analytics journey. Tools like FineBI and FineReport help you streamline every step, from data collection and cleaning to data visualization and dashboard creation. You deliver predictive modeling and data mining, statistical analysis and interpretation, and data-driven insights that power smarter decisions.

To succeed as a data analyst, you need a strong foundation in both technical and analytical skills. Employers look for candidates who can solve problems, think critically, and communicate insights clearly. During the hiring process, you will likely go through several steps:
You should focus on building your data analyst skills in SQL and Python, as these are essential for handling large datasets and performing advanced analytics. Strong knowledge of statistics and mathematics helps you interpret results and make sound recommendations.
Mastering modern analytics tools gives you a competitive edge. FineBI and FineReport stand out in the industry for their powerful features and user-friendly design. Here’s how they compare:
| Feature Aspect | FineBI | FineReport |
|---|---|---|
| Data Engine | Real-time and extracted data modes for large-scale analytics | Direct database connection for fast, detailed reporting |
| Analysis Mode | Self-service OLAP, interactive dashboards | Fixed-format, customizable operational reports |
| Target Users | Business users making strategic decisions | Operational users needing detailed, official reports |
| Report/Chart Creation | Browser-based drag-and-drop dashboards | Flexible templates with advanced formatting |
| Big Data Handling | Handles tens of millions of data points efficiently | Fast SQL queries for report display |
| Dashboard Functionality | Management cockpit with OLAP and filtering | Fixed analysis reports with chart linkage |
| Mobile Support | Full mobile analytics and sharing | Mobile report viewing and collaboration |
| Purpose | Strategic business intelligence and analytics | Operational and official reporting |
FineBI empowers you to perform analytics independently, while FineReport excels at creating detailed, pixel-perfect reports. Both tools integrate seamlessly, supporting your data analyst skills and helping you deliver insights that drive business success.
You find data analyst roles in nearly every industry today. Companies rely on your skills to turn raw data into actionable insights that drive growth and efficiency. The demand for data analysts continues to rise, especially in sectors like technology, finance, healthcare, and consulting. The following table shows where data analysts and related roles earn the highest median annual wages:
| Industry | Median Annual Wage |
|---|---|
| Computer systems design and related services | $128,020 |
| Management of companies and enterprises | $126,940 |
| Scientific research and development services | $120,090 |
| Management, scientific, and technical consulting services | $110,240 |
| Insurance carriers and related activities | $108,920 |
![2[1].jpg](https://media.finebi.com/strapi/2_1_e2d1334a48.jpg)
You see specialized data analyst roles in many fields:
Each sector brings unique challenges. In retail, you focus on customer behavior and inventory optimization. In finance, you work on risk management and fraud detection. Healthcare analysts help improve patient care and ensure compliance. Here is a quick comparison:
| Sector | Focus Areas | Example Projects | Common Tools and Compliance Requirements |
|---|---|---|---|
| Retail | Customer behavior, inventory optimization, sales | Customer segmentation, sales forecasting, pricing strategy | SQL, Google Analytics, Tableau |
| Finance & Banking | Risk management, compliance, fraud detection, investment analysis | Fraud detection, risk assessment, creditworthiness evaluation | SAS, R, advanced Excel functions |
| Healthcare | Patient data analysis, health outcomes, compliance, resource management | Treatment effectiveness analysis, predictive modeling for patient care | SQL, Python, healthcare databases, HIPAA compliance |
You can use FanRuan’s FineBI and FineReport to solve industry-specific problems. In finance, FineReport automates complex reporting and ensures compliance. You can quickly generate financial statements and monitor key metrics. In healthcare, FineBI helps you analyze patient outcomes and resource use, supporting better care decisions. Retailers use FineBI dashboards to track sales trends and optimize inventory in real time.
FanRuan’s tools adapt to your needs, whether you work in manufacturing, insurance, or consulting. You gain the ability to connect to multiple data sources, clean and visualize data, and share results securely. With these solutions, you deliver value by turning data into clear, actionable insights for your organization.
You can build a rewarding data analyst career by following clear advancement paths within organizations. Many professionals start as a data analyst, focusing on collecting, cleaning, and analyzing data to support business decisions. As you gain experience, you may move into specialized or senior roles. The table below outlines common career progression options:
| Career Role | Description | Typical Learning Path |
|---|---|---|
| Data Analyst | Collects, cleans, and analyzes data to uncover insights for decision-making. | Foundational courses in analytics, technical and soft skills. |
| Data Scientist | Designs models, creates algorithms, and extracts insights to meet business goals. | Advanced courses in statistics, data sourcing, and communication. |
| Data Engineer | Builds and maintains systems for collecting, storing, and preparing data for analysis. | Courses in data structures, coding, and cloud certifications. |
| Data Consultant | Develops data strategies, maintains databases, and ensures data quality. | Courses in SQL, Python, consulting, and business intelligence. |
| Data Steward | Ensures data quality, security, and governance; acts as liaison between IT and business. | Courses in data governance, privacy, and compliance. |
| Chief Data Officer | Oversees data management, strategy, analytics, and business intelligence at an organizational level. | Courses in data strategy, leadership, and executive analytics. |
You can personalize your development plan by choosing courses that match your interests and goals. Many organizations encourage you to start with foundational analytics courses before advancing to more specialized roles. This approach helps you build a strong base for your data analyst career.
Tip: You can use platforms like LinkedIn Learning to tailor your skill-building journey and stay current with industry trends.
You can accelerate your career as a data analyst by investing in certification and training. FanRuan Global Certification offers a structured program that validates your expertise in using industry-leading tools like FineReport and FineBI. These certifications help you stand out in a competitive job market and demonstrate your commitment to professional growth.
Training programs from FanRuan provide practical skills that improve your job performance. You will learn to automate routine tasks, which can save you over 100 hours each month. You will also reduce errors by 25% and deliver projects 20% faster. These improvements allow you to focus on strategic analysis and deliver higher-quality insights.
FanRuan’s ongoing workshops and training events empower you to transform raw data into actionable insights. You will gain skills in data validation, integration, and visualization—critical areas for any data analyst. By joining the FanRuan certification program, you position yourself for advancement and open doors to leadership roles in analytics.
Note: FanRuan supports your learning with detailed help documents, training videos, and live webinars. These resources ensure you stay ahead in your data analyst career.
As a data analyst, you drive business success by transforming data into actionable insights. Advanced tools like FineBI and FineReport help you work efficiently and explore data in depth:
Consider building your skills through certification and ongoing training. To advance your career, follow these steps:
Click the banner below to try FineBI and FineReport for free and empower your enterprise to transform data into productivity!


How to Secure Remote Data Analyst Jobs in 2025
Business Data Analyst vs Business Analyst Key Differences Explained

The Author
Lewis CHOW
Senior Data Analyst at FanRuan
Related Articles
Data Analyst Dashboard: A Scenario-Based Guide to KPI Views That Drive Better Business Decisions
Learn how data analyst dashboards turn raw data into actionable KPI views for operational, analytical, and strategic decisions. Drive better business outcomes.
Lewis Chou
May 03, 2026

Self-Service Analytics Defined and Why You Need It
Self-service analytics lets you analyze data without IT help, empowering faster, data-driven decisions and boosting agility for your business.
Lewis
Jan 04, 2026
Best Self-Service Tools for Analytics You Should Know
See which self-service tools for analytics let business users access data, build dashboards, and make decisions faster—no IT help needed.
Lewis
Dec 29, 2025


