An analysis report gives you a structured way to turn raw data into clear, actionable findings. In your daily work, you rely on reporting to track key metrics, uncover trends, and measure progress against goals. Using reporting tools, you can examine descriptive statistics, run diagnostic checks, and even forecast future outcomes. This approach supports more accurate decisions and delivers measurable results. Companies that use data-driven insights see higher productivity and profit. FineReport from FanRuan streamlines reporting, helping you transform complex data into practical recommendations with ease.
Key Takeaways
- An analysis report turns raw data into clear insights that help you make smarter business decisions in Malaysia.
- Good analysis reports explain data with visuals and end with practical recommendations tied to real goals.
- Using tools like FineReport makes creating and sharing analysis reports faster and easier.
- Structured reports highlight problems, support decisions, and guide strategies to improve results.
- Following a clear process and focusing on key metrics ensures your reports stay accurate and useful.
Analysis Report Basics
What Is an Analysis Report?
An analysis report is a structured document that helps you transform raw data into actionable insights. When you use an analytical report, you move beyond simple data reporting. Instead of just presenting numbers, you interpret and explain what those numbers mean for your business in Malaysia. This process involves collecting, organizing, and analyzing data to uncover patterns, trends, and opportunities.
You can think of an analytical report as a bridge between information and action. It guides you through the process of turning complex data into clear findings. For example, you might use customer segmentation to group your audience in Malaysia, predictive analytics to forecast trends, or sentiment analysis to measure customer feedback. Each of these techniques relies on data reporting but goes further by providing context and recommendations.
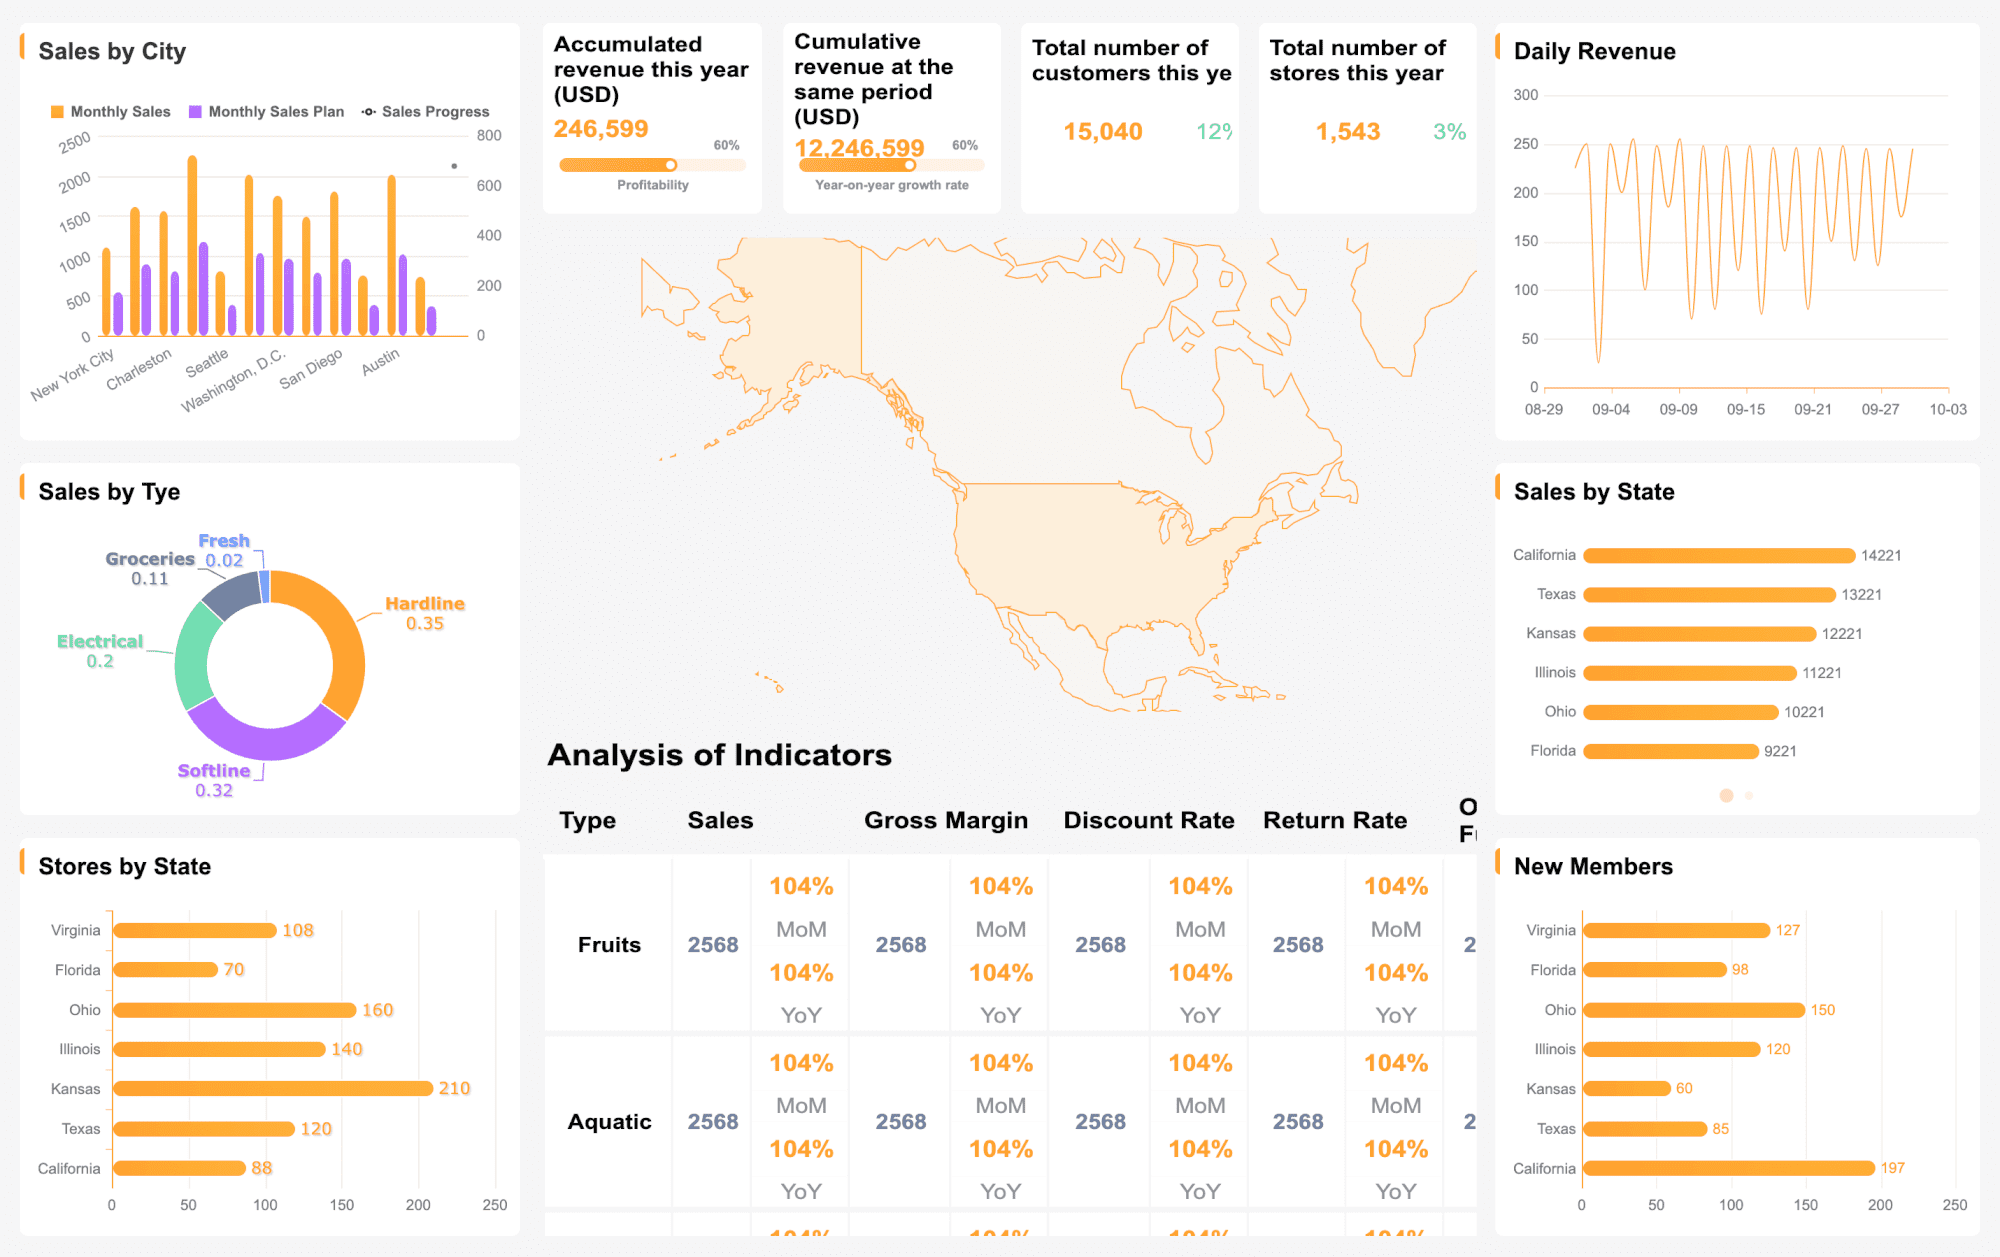
The most important aspect of analytical reporting is its focus on clarity and relevance. You do not just display data; you explain it. You use visualizations like charts and graphs to make information easy to understand. Automated reporting tools, such as FineReport from FanRuan, help you create these reports quickly and accurately. They allow you to integrate data from multiple sources, visualize results, and share insights with decision-makers.

Tip: Analytical reports should always end with clear, data-based recommendations. This approach ensures that your decisions are grounded in evidence, not guesswork.
Why Is Analysis Report Important?
Analytical reports play a vital role in business in Malaysia. They help you identify problems, support decisions, and drive strategy. When you rely on data reporting alone, you might miss important details. Analytical reporting, however, gives you the tools to analyze data deeply and find the root causes of issues.
Here are some ways analytical reports add value:
- Problem Identification: Analytical reports highlight gaps, trends, and anomalies. For example, sales funnel analysis can show where customers drop off, while churn analysis reveals why customers leave.
- Supporting Decisions: You use analytical reports to compare options, forecast outcomes, and justify your choices. Techniques like A/B testing and competitive analysis help you make informed decisions.
- Driving Strategy: Analytical reporting aligns your actions with business goals in Malaysia. By focusing on key performance indicators (KPIs), you ensure that your efforts support long-term success.
Numerical studies show that structured analytical reports improve business outcomes in Malaysia. When you use precise data collection methods, such as market research questionnaires, you gain accurate and consistent results. This accuracy leads to faster, more reliable decision-making. For example, tracking customer satisfaction scores over time helps you benchmark performance and respond quickly to changes.
Industry-specific statistics also demonstrate the impact of analytical reports. In sales, you might use daily or weekly indicators to monitor progress, monthly metrics to spot patterns, and annual reports to evaluate overall performance. By selecting the most important aspect of analytical reporting—relevant KPIs—you can detect issues early, highlight successes, and guide improvements.
Empirical data from real businesses in Malaysia confirms the power of analytical reporting. Managers who understand both financial and non-financial metrics use analytical reports more effectively. They apply these insights to strategic planning, improving competitiveness and performance. Company size and structure can influence how you use analytical reports, but the core value remains the same: turning data into actionable insights.
FineReport from FanRuan stands out as a leading solution for creating and managing analytical reports. With its intuitive interface, you can automate data reporting, integrate multiple data sources, and generate visual dashboards. This capability makes it easier for you to analyze data, share findings, and support data-based decision-making across your organization.

Note: The most important aspect of analytical reporting is not just collecting data, but transforming it into insights that drive real business results in Malaysia. Analytical reports empower you to move from information to action, supporting problem-solving and strategic growth.
Analysis Report Structure
Key Components of Analysis Report
A strong analytical report follows a clear structure. This structure helps you communicate your findings and recommendations effectively. When you create an analytical report, you guide your audience in Malaysia through complex data and make your insights easy to understand. Here are the essential sections you should include:
- Executive Summary: Start with a brief overview. This section highlights the main points of your analytical report. It allows busy stakeholders to grasp the key findings and recommendations quickly.
- Findings: Present the main results of your data analysis. Use clear language and focus on what matters most to your audience in Malaysia.
- Data Analysis: Dive deeper into the data. Explain your methods, show your calculations, and use charts or graphs to make your analytical reporting more engaging.
- Recommendations: End your analytical report with practical steps. Link your findings to actions your organization can take.
A well-defined structure acts as a roadmap. It helps your readers follow your logic and keeps them engaged. Research shows that executive summaries and recommendations make analytical reports more accessible and actionable. Templates and real-world examples confirm that these sections help decision-makers focus on what matters.
FineReport makes it easy to build this structure. You can use its drag-and-drop interface to organize your analytical report, add visualizations, and automate data reporting. FineReport’s dashboards and templates ensure your analytical reporting is both clear and impactful.

Tip: Use visuals like charts and graphs in your analytical report. They break down complex data and make your findings memorable.
Data Reporting vs. Analysis Report
You need to understand the difference between data reporting and analysis. Data reporting presents raw data, such as tables or lists of numbers. It answers the question, “What happened?” Analytical reporting goes further. It interprets the data, explains why trends appear, and suggests what actions to take next.
For example, data reporting might show monthly sales numbers. Analytical reporting will explain why sales increased or decreased and recommend steps to improve results. FineReport supports both data reporting and analytical reporting. You can present your data clearly, then use built-in tools to perform data analysis and generate actionable insights.
A logical, repeatable structure in your analytical report makes your insights easy to digest. Visual elements, clear headings, and a logical flow help your audience in Malaysia understand the impact of your data and take action.
Make Recommendations of Analysis Report in Malaysia
Turning Insights into Action for Analysis Report
You have completed your analysis and now face the most critical step: turning insights into action. To make recommendations that drive real change, you must connect your findings to specific business goals in Malaysia. Start by reviewing the key results in your report. Identify patterns, trends, or gaps that require attention. Use these insights to make recommendations that are clear, practical, and directly linked to your objectives.
FineReport helps you move from analysis to action by providing real-time data and interactive dashboards. You can visualize trends, monitor key metrics, and highlight areas that need improvement. This approach allows you to make recommendations based on the latest information, ensuring your report remains relevant and actionable.

Tip: Always link your recommendations to measurable outcomes. This practice helps you track progress and demonstrate the impact of your actions.
Many leading companies have seen measurable improvements by acting on analytical reports:
- Uber reduced average handle time per ticket by nearly 7% and improved customer satisfaction by using data-driven recommendations.
- Blue Apron used predictive analytics to cut spoilage and enhance customer experience.
- PepsiCo’s targeted marketing, based on analytical report examples, drove 80% of sales growth for a new product.
These results show that when you make recommendations and act on them, you can achieve real business value in Malaysia.
Analysis Report Examples with FineReport
Medical Health Industry Analysis Report
In the medical health industry, you often need to analyze patient outcomes, resource utilization, and operational efficiency. FineReport enables you to create a report that integrates data from multiple sources, such as electronic health records and patient feedback. You can use the report to identify trends in patient recovery times or highlight areas where resources are underused. Based on these findings, you make recommendations to optimize staffing, improve patient care, and reduce costs. FineReport’s dashboards allow you to track the results of your recommendations in real time, supporting continuous improvement.
Retail Industry Analysis Report
Retailers rely on timely data to stay competitive. With FineReport, you can generate a report that tracks sales performance, inventory levels, and customer preferences. The report uses visualizations to make complex data easy to understand for all stakeholders. You might notice a drop in sales for a specific product line. Your recommendations could include adjusting pricing, launching targeted promotions, or optimizing inventory. FineReport’s performance-tracking systems help you monitor the impact of your recommendations, ensuring you can quickly respond to market changes.
Note: Clear, actionable recommendations in your report bridge the gap between analysis and business improvement in Malaysia. FineReport’s tools make it easier for you to translate data into meaningful action.
To learn more about the FineReport features, you can click on the button below to go to the product guide.
Create an Analysis Report in Malaysia
Step-by-Step Process for Analysis Report
You can create a comprehensive analytical report by following a clear, step-by-step process. Start by defining your objectives. Identify the specific business challenges in Malaysia or opportunities you want to address. Next, gather relevant data from reliable sources. Use data reporting tools to collect current performance metrics and ensure accuracy. Analyze the data using structured methods such as interviews, surveys, or direct observations. Document your findings with supporting examples and data visualizations. Finally, make actionable recommendations that align with your objectives.
A systematic approach to analytical reporting improves both accuracy and timeliness. For example, a comparative study found that step-by-step processes with real-time tracking and validation mechanisms led to faster and more reliable reporting outcomes than manual, fragmented methods.
When you assign key performance indicators (KPIs) to individuals, you increase accountability and reduce managerial workload. Removing inaccurate data also reduces friction between departments, streamlining your operational flow. This process saves time previously spent waiting for data interpretation and boosts productivity.
Tools and Best Practices for Analysis Report in Malaysia
FineReport from FanRuan streamlines every stage of analytical report creation. You can integrate multiple data sources, automate data reporting, and design interactive dashboards with ease. FineReport’s dynamic reporting features, real-time data access, and advanced visualization tools help you uncover deeper insights. Self-service options empower all team members in Malaysia to participate in the reporting process, making data more accessible and actionable.

Tip: Use accessible data visualizations and automated reporting tools to ensure everyone understands and acts on your analytical findings.
Other leading tools, such as Power BI and DataCycle Reporting, also offer real-time data access, automation, and intuitive interfaces. These features support best practices in analytical reporting by reducing manual effort and improving report quality. To achieve the best results, focus on accuracy, clarity, and actionable outcomes. Select vital KPIs to keep your data reporting relevant and avoid information overload. Regularly validate your data to maintain high standards in every analytical report you produce in Malaysia.
Analysis reports drive smarter business decisions in Malaysia and continuous improvement. When you use FineReport from FanRuan, you gain the power to turn data into clear insights and practical actions. Companies across industries have seen measurable gains by acting on data-driven recommendations:
| Case Study | Industry | Data-Driven Technique | Outcome / Statistical Improvement |
|---|---|---|---|
| Groove | SaaS | A/B Testing | 100% increase in conversions after landing page redesign |
| Global Retailer | Retail | Real-time Data Integration | 30% faster decision-making, 25% cost reduction, increased customer satisfaction |
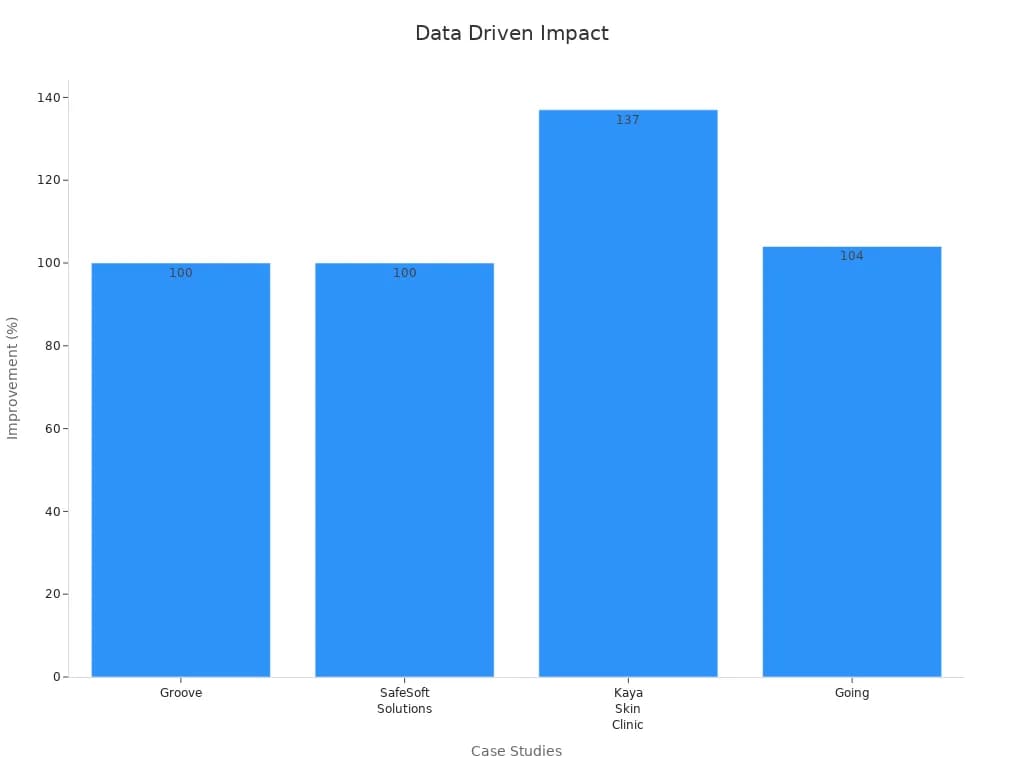
Apply these steps and leverage modern reporting solutions to unlock the full value of your data. Data-driven recommendations will help you achieve lasting results and keep your organization ahead.
Click the banner below to try FineReport for free and empower your enterprise to transform data into productivity!

Continue Reading About Report
Mastering Data Analysis Report and Dashboard
What is an Analysis Report & How to Create it: Templates & Samples


FAQ

The Author
Lewis
Senior Data Analyst at FanRuan
Related Articles

Financial Reporting Valuation Explained: A Practical Guide to ASC 820, ASC 805, ASC 350, and ASC 718
$1 valuation is the process companies use to measure assets, liabilities, equity instruments, and reporting units for compliant $1. For CFOs, controllers, finance directors, and audit facing accounting teams, the challen
Yida Yin
Jun 25, 2026

Best Ad Reporting Tool in 2026: 8 Options Compared for Marketers and Analysts
$1 is an $1 and dashboard platform that helps teams unify ad data, build highly customized reports, and automate distribution at scale. 8 ad reporting tool options compared 1. DashThis One sentence overview: DashThis is
Yida YIn
Jun 25, 2026
Office 365 Reporting Tool Guide: Track Usage, Security, and License Waste in One Dashboard
An office 365 $1 should do more than generate static usage charts. For IT managers, operations leaders, and Microsoft 365 administrators, the real value is operational visibility: who is actually using the platform, wher
Yida Yin
Jun 25, 2026