You know how fast ecommerce moves. Staying ahead means you need ecommerce reporting tools that turn your data into clear insights. Advanced reporting tools like FineReport and FineBI from FanRuan help you make smarter decisions with real-time analytics and easy-to-read reports. If you ever feel overwhelmed by scattered data, you’re not alone. Check out some common challenges online stores face:
| Challenge | Description | Impact |
|---|---|---|
| Volume | Tons of ecommerce data flood in every day. | You might miss insights or struggle to keep up. |
| Variety | Data comes in all shapes and sizes. | It’s tough to get a full picture of your customers. |
| Velocity | Data moves fast. | Slow reporting means missed chances. |
| Veracity | Not all data is accurate. | Bad data leads to poor decisions. |
| Value | Data should drive results. | Without the right analytics, you lose out on strategic insights. |
Ready to find what is the best reporting tool for e-commerce? Let’s get practical and discover which reporting and analytics tools fit your online store, the following is an overview list of The best reporting tool for e-commerce:
- FineReport
- FineBI
- Google Looker Studio
- Microsoft Power BI
- Tableau
- Whatagraph
- Zoho Analytics
- Supermetrics
- OWOX BI
- Monday.com
- ClickUp
Why Ecommerce Reporting Tools Matter
Benefits for Online Stores
You want your online store to grow, right? Ecommerce reporting tools help you get there faster. These tools turn raw data into clear analytics, so you can see what’s working and what needs attention. When you use ecommerce analytics tools, you can track sales, monitor inventory, and spot trends before your competitors do.
An ecommerce reporting tool is software designed to report on and help you analyze your ecommerce business’s key metrics, often in real time.
With the right reporting tools, you spend less time crunching numbers and more time making smart moves. Here’s what you gain:
- Time efficiency: Spend just an hour a month on reports instead of days.
- Enhanced accuracy: Say goodbye to manual errors and hello to reliable data.
- Real-time decision making: Adjust your campaigns on the fly with up-to-the-minute insights.
- Cross-channel insights: See how all your platforms perform together.
- Customizable reporting: Focus on the KPIs that matter most to your business.
Check out how automated reporting stacks up against manual methods:
| Aspect | Manual Reporting | Automated Reporting |
|---|---|---|
| Time Investment | 3-7 days per month | ~1 hour per month |
| Data Accuracy | Prone to human error | Consistently accurate |
| Real-time Updates | Limited | Continuous |
Ecommerce analytics tools also help you improve customer experience, boost operational efficiency, and optimize your marketing. Real-time dashboards let you spot and fix problems quickly, while finance teams can track revenue and margins for better planning.
Challenges Without Reporting Tools
Running an ecommerce store without proper reporting tools feels like flying blind. You might miss out on actionable insights that drive growth. Manual processes slow you down and make mistakes more likely. Limited visibility into inventory can lead to stock imbalances or missed sales. Delayed order fulfillment hurts customer satisfaction.
Here are some common challenges you might face:
- Manual processes can lead to errors and delays.
- Limited visibility into inventory can cause stock imbalances.
- Operational inefficiencies can increase costs and reduce growth.
- Inventory inefficiencies can lead to stockouts or overstocking.
- Order delays negatively impact customer experience.
| Challenge | Impact on Operations |
|---|---|
| Manual Processes | Increases errors, delays, and inefficiencies, especially in inventory management. |
| Poor Visibility into Inventory | Leads to stock imbalances and missed sales opportunities. |
| Operational Inefficiencies | Drives up costs and stunts growth, affecting customer experience and profits. |
If you want to stay ahead in ecommerce, you need tools that turn your data into actionable insights. That’s how you keep your store running smoothly and your customers coming back.
What Is the Best Reporting Tool for E-commerce?
Choosing what is the best reporting tool for e-commerce? can feel overwhelming. You want something that makes your life easier, not harder. Let’s break down the key features of shopify reporting tools and other top options so you know what to look for.
Key Features to Consider
When you compare reporting tools, focus on what matters most for your online store. You need tools that track key metrics, integrate with your favorite platforms, and deliver real-time analytics. Here’s a quick table to help you spot the essentials:
| Criteria | Description |
|---|---|
| Metrics Tracking | Monitor sales performance and operational effectiveness. |
| Data Integration | Connect with other business tools for complete data analysis. |
| Real-time Data Analysis | Get instant insights into customer behavior and sales trends. |
| User Behavior Insights | Understand customer preferences and improve marketing strategies. |
You want shopify reporting tools that let you customize dashboards, share reports easily, and access data from anywhere. The key features of shopify reporting tools include compatibility with multiple storefronts, flexible design, and automated report delivery.
For a clear comparison of best reporting tool for e-commerce, check out Top 10 Ecommerce Reporting Tools for 2026.
Integration and Compatibility
Integration is a big deal. You need reporting tools that work with Shopify, WooCommerce, Magento, and BigCommerce. Here’s a quick look:
| eCommerce Platform | Integration Capability |
|---|---|
| Shopify | Yes |
| WooCommerce | Yes |
| Magento | Yes |
| BigCommerce | Yes |
Shopify analytics should connect with your store, pull in data automatically, and offer drag-and-drop widgets. You want intuitive interfaces and responsive support. FineReport and FineBI from FanRuan stand out because they unify your analytics and provide real-time insights across all your channels.
Pricing and Scalability
Pricing matters as your business grows. You want what is the best reporting tool for e-commerce? that fits your budget now and scales with you. Here’s a table to help you compare:
| Business Profile | Monthly Budget Range |
|---|---|
| Small Business | $25-$99 |
| Growing Brand | $200-$500 |
| Enterprise | $1,000-$5,000+ |
Think about implementation costs, training, and custom integrations. Some tools charge performance-based fees, usually 0.5-2% of your gross merchandise volume. FineReport and FineBI offer flexible pricing and scale with your needs, making them strong choices when you ask what is the best reporting tool for e-commerce?.
If you want unified analytics, seamless data integration, and reliable shopify reporting tools, FineReport and FineBI from FanRuan should be at the top of your list.
Top Ecommerce Reporting Tools for 2025

Choosing the right ecommerce reporting tools can change how you run your online store. Let’s walk through the top options for 2025, so you can find the perfect fit for your business.
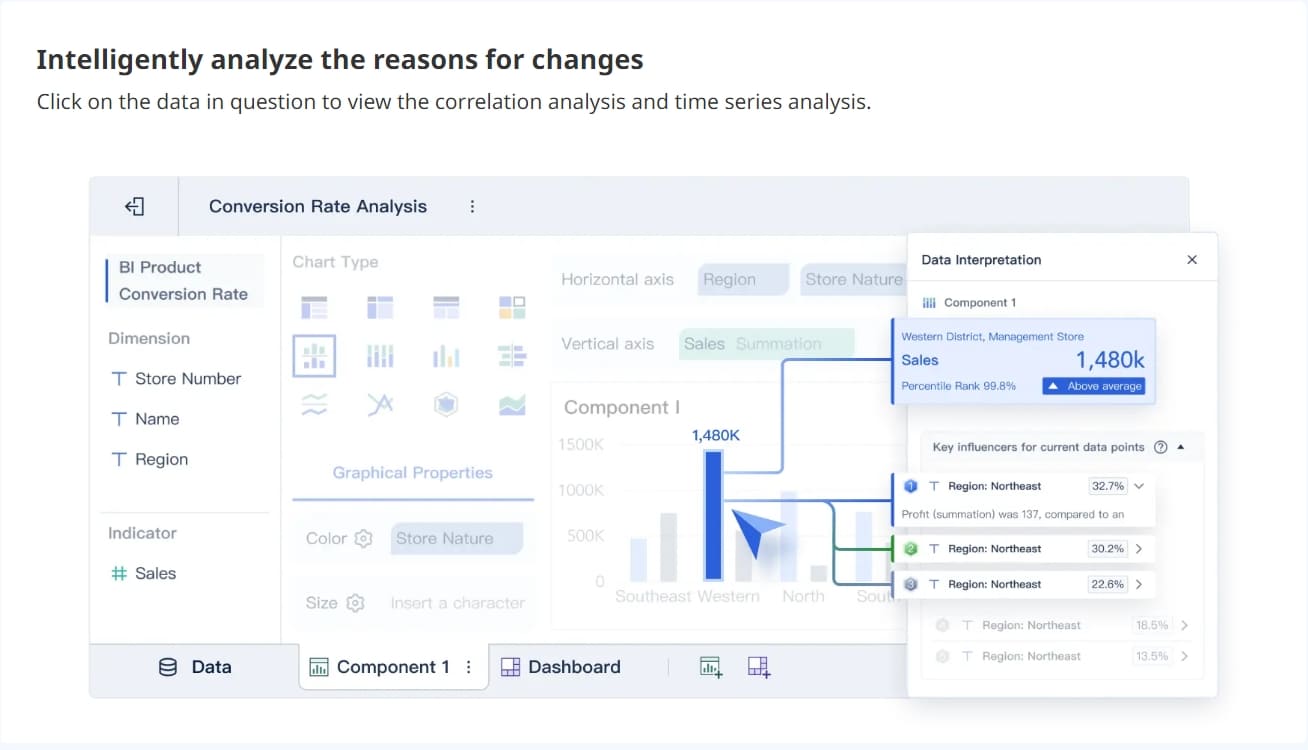
1.FineReport by FanRuan
FineReport stands out as a flexible reporting tool built for ecommerce. You can connect to almost any data source, from your store’s database to cloud services. The drag-and-drop designer makes it easy to build custom reporting dashboards and reports—even if you’re not a tech expert. FineReport gives you pixel-perfect documents, dynamic dashboards, and real-time analytics, so you always know what’s happening in your store.
Website: https://www.fanruan.com/en/finereport
You’ll love the way FineReport handles real-time data. It supports automated dashboards, scheduled report delivery, and customizable reporting for every department. You can track sales performance, monitor inventory, and even manage data entry forms for orders or customer records. FineReport’s mobile support means you can check reports and dashboards anywhere, anytime.
Best for:
- Ecommerce teams needing unified analytics and real-time monitoring
- Businesses with complex data integration needs
- Stores that want customizable reports and dashboards for every role
Pricing:
FineReport offers flexible pricing based on your business size and needs. You can start with a free trial to see if it fits.
Limitations:
FineReport works best for businesses ready to invest in a robust reporting platform.

2.FineBI by FanRuan
FineBI is a self-service business intelligence tool that puts the power of ecommerce analytics tools in your hands. You can connect to dozens of data sources, build custom reporting dashboards, and explore data with zero coding. FineBI’s real-time analytics and drag-and-drop interface make it easy for anyone to create reports and dashboards.

Website: https://www.fanruan.com/en/finebi
You get real-time dashboards, advanced data visualization, and the ability to customize every view. FineBI helps you spot trends, track revenue, and make decisions fast. You can tailor dashboards for sales, marketing, or operations, so every team gets actionable insights.
Key strengths for ecommerce:
- Data visualization that makes complex numbers easy to understand
- Real-time insights for quick decisions
- Customization for dashboards and reports
Best for:
- Teams that want to explore data without IT help
- Ecommerce brands focused on growth and agility
- Businesses needing real-time analytics and customizable reporting
Pricing:
FineBI offers scalable pricing and a free trial, so you can test before you commit.
Limitations:
FineBI is ideal for stores that want to empower every team member with analytics.

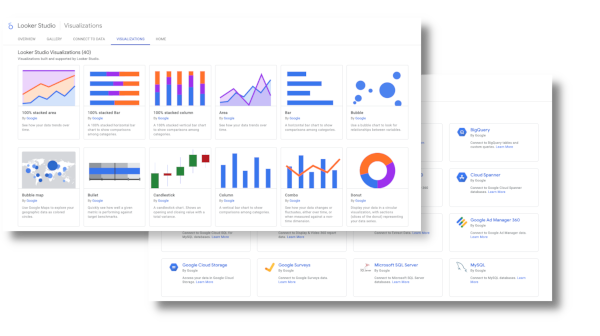
3.Google Looker Studio
Google Looker Studio helps you create custom reporting dashboards that pull data from Google Analytics, Google Ads, and other platforms. You can visualize key metrics and track marketing performance in one place. The tool simplifies complex data, making it easy to spot trends and make decisions.
Website: https://lookerstudio.google.com/navigation/reporting
You can connect your data sources, build visual reports, and use the insights to improve your campaigns. Looker Studio supports integration with multiple data sources, so you get a complete view of your ecommerce business.
Best for:
- Marketers who want to track campaign performance
- Stores using Google’s ecosystem
- Teams that need quick, visual reports
Pricing:
Looker Studio is free for most users.
Limitations:
Advanced features may require technical setup or paid upgrades.
4.Microsoft Power BI
Microsoft Power BI is a top choice for ecommerce analytics tools. You can connect to almost any data source and build interactive reports and dashboards. Power BI helps you analyze customer segments, manage inventory, and track sales performance with real-time analytics.

Website: https://www.microsoft.com/en-us/power-platform/products/power-bi
| Advantage | Description |
|---|---|
| Customer Segmentation | Analyze customer data for targeted promotions. |
| Inventory Management | Track stock levels and demand to avoid overstocking. |
| Supply Chain Management | Streamline processes and reduce risks. |
| Sales and Revenue Analysis | Measure sales and spot growth opportunities with real-time dashboards. |
| Marketing and Promotions | Track marketing metrics and improve ROI. |
| Predictive Analytics | Forecast sales using historical data. |
| Real-Time Reporting | Make decisions quickly with instant reporting. |
Best for:
- Businesses using Microsoft products
- Teams that want deep analytics and real-time data
- Stores with complex reporting needs
Pricing:
Power BI offers a free version and paid plans starting at $10 per user per month.
Limitations:
Some advanced features require higher-tier plans.
5.Tableau
Tableau is known for its powerful data visualization and analytics. You can connect to many data sources and build interactive dashboards. Tableau’s drag-and-drop interface lets you create custom reporting dashboards that help you understand your ecommerce data.

Website: https://www.tableau.com/
| Feature | Tableau | Other Ecommerce Tools |
|---|---|---|
| Visualization Options | Extensive and interactive dashboards | Limited options |
| Data Source Connectivity | Easy connection to various data sources | May require complex integrations |
| Centralized Modeling Layer | Lacks centralized modeling | Often includes modeling |
Best for:
- Teams that want advanced data visualization
- Businesses with large or complex datasets
- Users who need interactive, shareable reports
Pricing:
Tableau offers a free trial and paid plans starting at $70 per user per month.
Limitations:
Tableau can have a steeper learning curve for beginners.
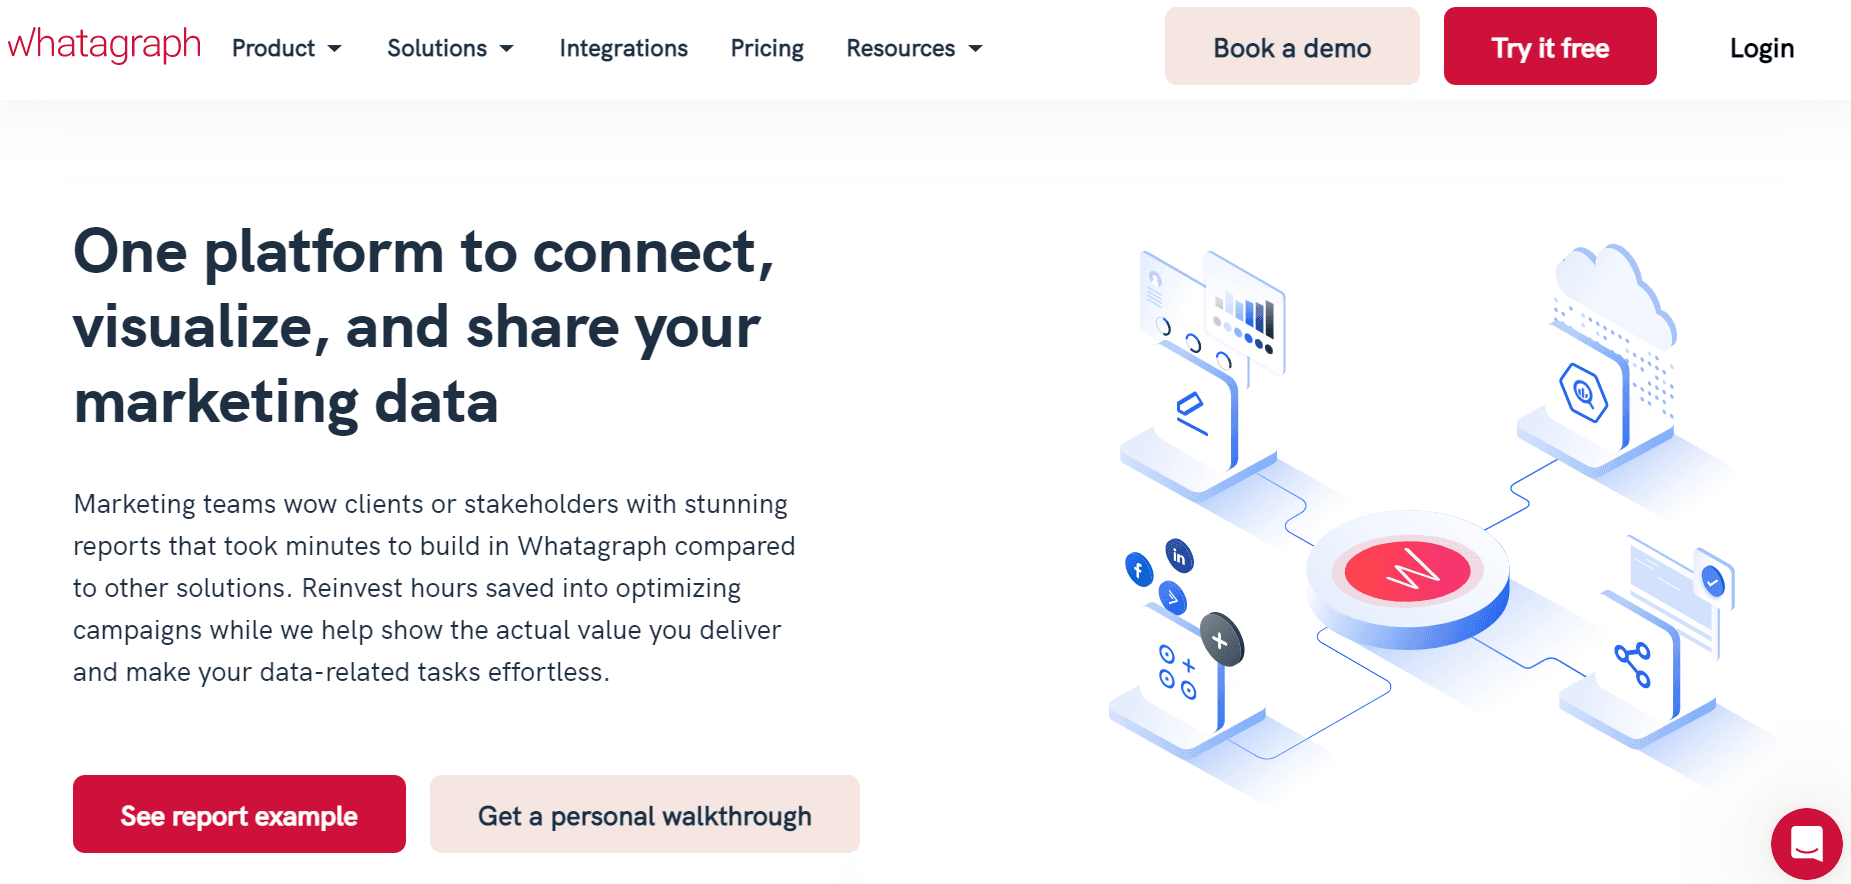
6.Whatagraph
Whatagraph makes ecommerce reporting tools simple and beautiful. You can automate data syncing from over 40 marketing platforms, build customizable reports, and share live dashboards with your team or clients. Whatagraph’s Smart Builder helps you create cross-channel reports quickly.
Website: https://whatagraph.com/
| Unique Feature | Description |
|---|---|
| Automated Data Syncing | Syncs all data from connected accounts automatically. |
| Customizable Report Templates | Build reports with templates tailored to your needs. |
| Access to 40+ Marketing Sources | Integrates with over 40 marketing platforms. |
| White-label Reporting | Brand your reports for clients. |
| Live Dashboard Sharing | Share live dashboards for real-time updates. |
| Cross-channel Reporting | Report across multiple marketing channels. |
Best for:
- Agencies managing multiple clients
- Ecommerce brands with lots of marketing channels
- Teams that want automated dashboards and customizable reporting
Pricing:
Plans start at $199 per month.
Limitations:
Pricing may be high for small businesses.
7.Zoho Analytics
Zoho Analytics gives you a unified dashboard for all your ecommerce data. You can track inventory, analyze orders, and monitor sales across products and regions. Zoho Analytics helps you visualize KPIs, understand profitability, and get customer insights.
Website: https://www.zoho.com/
| Feature | Description |
|---|---|
| Inventory Optimization | Visualize top and bottom-selling products to optimize stock. |
| Order and Transaction Analysis | Monitor orders, returns, and refunds on one dashboard. |
| Sales Maximization | Track sales and measure the impact of offers and discounts. |
| Profitability Tracking | See profits by department and demographic. |
| Customer Insights | Analyze customer data to improve service. |
| KPI Tracking | Keep crucial KPIs on a unified dashboard for real-time decision-making. |
Best for:
- Stores that want a complete view of their business
- Teams focused on profitability and customer insights
- Businesses needing customizable reporting
Pricing:
Plans start at $24 per month.
Limitations:
Some integrations may require extra setup.
8.Supermetrics
Supermetrics pulls data from all your ecommerce platforms into one place. You can connect Shopify, WooCommerce, Amazon, Stripe, and more. Supermetrics helps you analyze campaign effectiveness and build custom reporting dashboards in tools like Google Sheets or Data Studio.
Website: https://supermetrics.com/
Integrations include:
- Shopify & Shopify Plus
- WooCommerce
- Amazon Seller Central
- Stripe
- Square
- BigCommerce
- Magento
- PrestaShop
- Lazada
- Shopee
Best for:
- Ecommerce marketers tracking multiple channels
- Teams that want flexible reporting in spreadsheets
- Businesses needing real-time data integration
Pricing:
Plans start at $99 per month.
Limitations:
Some advanced features require higher-tier plans.
9.OWOX BI
OWOX BI gives you real-time data collection and unsampled data access. You can track every user action on your site and send it straight to Google BigQuery. OWOX BI helps you analyze costs, user behavior, and campaign performance without expensive software.
Website: https://www.owox.com/
| Strengths of OWOX BI for Ecommerce Analytics | Description |
|---|---|
| Real-time data collection | Collects all user actions in real-time for accurate reporting. |
| Unsampled data access | Access raw event data without visit limits. |
| Cost analysis | Track ad spending daily and attribute costs to sessions. |
| User behavior analysis | Track users across multiple sites for deeper insights. |
| No need for expensive software | Uses Google BigQuery, so you avoid high software costs. |
| Integration with multiple data sources | Process and analyze data from spreadsheets, social media, and more. |
Best for:
- Ecommerce teams needing detailed user and cost analysis
- Businesses using Google BigQuery
- Stores wanting real-time analytics without high costs
Pricing:
Custom pricing based on needs.
Limitations:
Requires some setup with Google BigQuery.
10.Monday.com
Monday.com helps you manage ecommerce reporting and automate workflows. You can set up boards for orders, inventory, and suppliers. Automate status updates and stock alerts to keep everything running smoothly. Dashboards let you monitor order status and sales trends in real-time.
Website: https://Monday.com
Monday.com also integrates with Facebook Ads and lets you customize workflows for product listings and manufacturing. You can streamline order management, returns, and fulfillment, making your operations more efficient.
Best for:
- Ecommerce stores needing workflow automation
- Teams managing lots of orders and inventory
- Businesses wanting customizable reporting dashboards
Pricing:
Plans start at $8 per user per month.
Limitations:
Some advanced features require higher-tier plans.
11.ClickUp
ClickUp offers ecommerce teams a way to track KPIs, manage tasks, and monitor performance. You can create tasks for website traffic, conversion rate tracking, and sales figures. Assign tasks for performance monitoring and use the data to make better decisions.
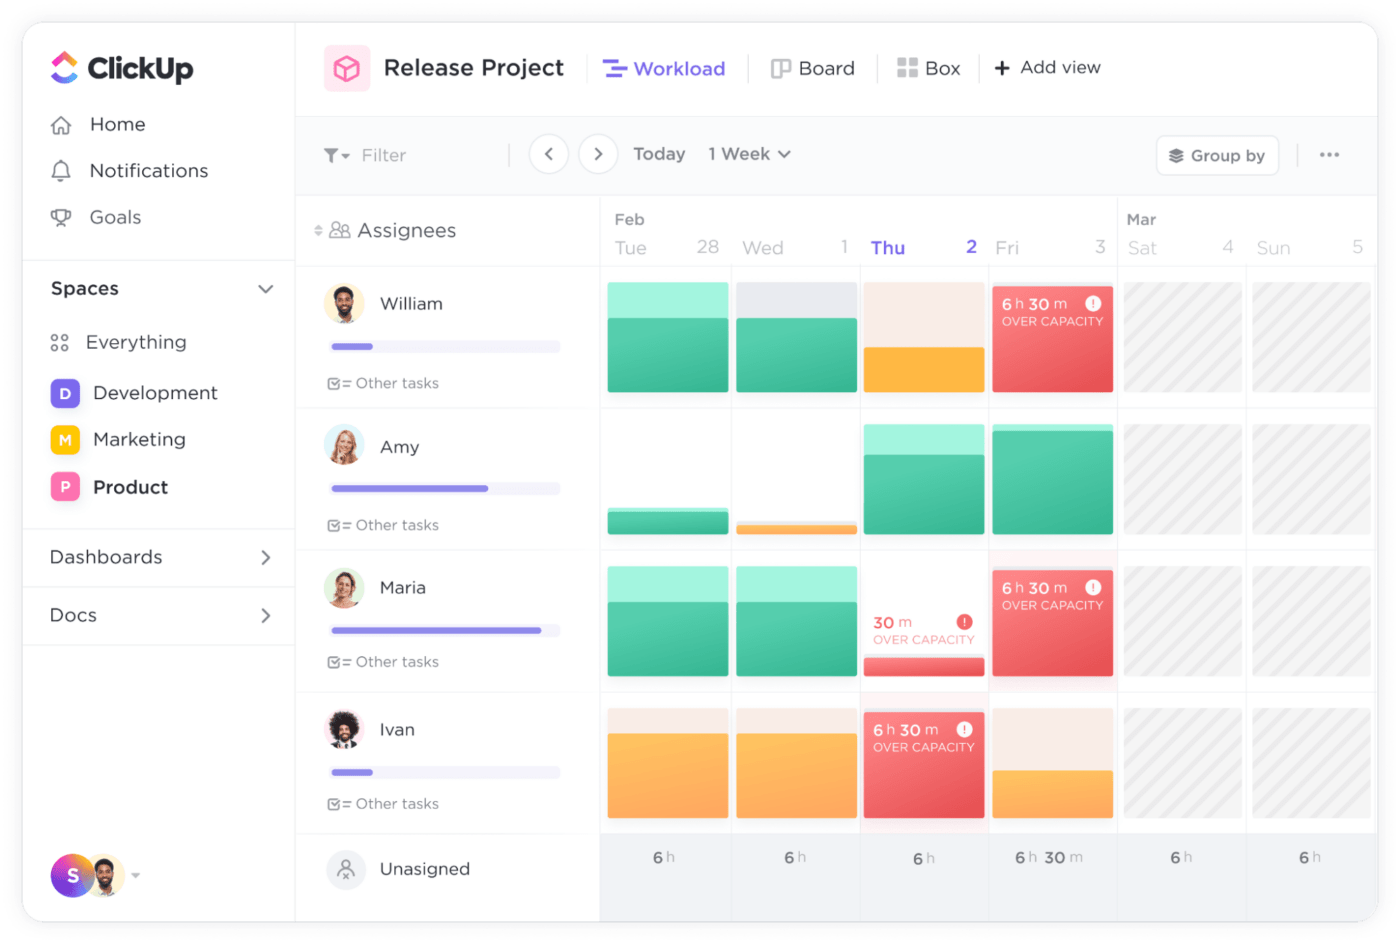
Website: https://clickup.com/
| Feature | Description |
|---|---|
| Task Management | Track KPIs like traffic, conversions, and sales. |
| Performance Monitoring | Assign tasks for monitoring and reporting. |
| Data-Driven Decisions | Optimize strategies and reach goals based on tracked KPIs. |
Best for:
- Teams that want to combine project management with ecommerce analytics tools
- Stores focused on performance and goal tracking
- Businesses needing customizable reporting
Pricing:
Free plan available; paid plans start at $7 per user per month.
Limitations:
Reporting features may be basic compared to dedicated analytics tools.
Other Popular Ecommerce Reporting Tools for 2025:
- Klipfolio: Real-time data updates and easy visuals
- Triple Whale: Robust sales tracking and revenue monitoring
- Glew.io: Customer behavior insights for smarter marketing
With so many ecommerce reporting tools available, you can find the right fit for your store’s needs. Whether you want real-time analytics, customizable reports, or automated dashboards, these tools help you turn data into actionable insights and drive your business forward.
Ecommerce Analytics Tools Comparison

Features Overview
When you compare ecommerce analytics tools, you want to know what sets each one apart. Here’s a quick list of features you should look for in reporting tools:
- Core metrics tracking helps you see sales and performance at a glance.
- Customizable reports let you focus on what matters most for your store.
- Customer segmentation shows you who buys and why.
- Conversion rate optimization capabilities help you boost sales.
- Marketing attribution tracks which campaigns drive results.
- E-commerce platform integration connects all your data sources.
- Server-side tracking gives you deeper insights into customer actions.
FineReport and FineBI from FanRuan stand out because they offer real-time dashboards, flexible reporting tools, and seamless integration with almost any ecommerce platform. You can build reports for sales, inventory, and customer behavior without needing IT support.

Pricing Summary
You want a tool that fits your budget and grows with your business. Here’s a quick look at how pricing models differ among popular ecommerce analytics tools:
| Tool | Pricing Model |
|---|---|
| FineReport | Flexible, scales with business size |
| FineBI | Scalable, free trial available |
| Visualping | Starts at $100/month for 2K checks |
| Repricer | $75-$1099/month |
| PriceLabs | Starts from $19.99/month |
| Import.io | $299/month or $1999/year |
| Mozenda | $99–$199/month; Enterprise from $3,500 |
FineReport and FineBI give you options for every stage of growth. You can start small and expand as your ecommerce business grows.
Use Case Highlights
Not every tool fits every business. Here’s a table to help you match ecommerce analytics tools to your needs:
| Tool | Best Suited For | Key Features |
|---|---|---|
| FineReport | All sizes, especially complex needs | Real-time dashboards, customizable reports, unified analytics, mobile access |
| FineBI | Teams needing self-service analytics | Drag-and-drop dashboards, real-time insights, easy integration |
| Triple Whale | Small to medium-sized businesses | 30+ integrations, ad spend tracking, customer retention |
| Kissmetrics | Small to medium-sized businesses | Funnel analysis, cohort tracking, customer insights |
| Adobe Analytics | Large enterprises | Deep customer behavior insights, performance optimization |
If you want reporting tools that deliver real-time insights, flexible reports, and easy integration, FineReport and FineBI from FanRuan are strong choices for ecommerce. You get analytics that help you make smarter decisions and keep your store ahead of the competition.

How to Choose Ecommerce Reporting Tools
Assessing Store Needs
You want your ecommerce store to grow, so start by figuring out what you need from your reporting tools. Here’s a simple way to break it down:
- Learn about ecommerce analytics. Gather and look at all the data your store creates.
- Pick the right metrics. Focus on the numbers that matter most, like sales, customer visits, and conversion rates.
- Bring your data together. Combine info from different sources so you get a full picture.
- Build smart reports. Use these reports to spot trends and measure your success.
When you know what you need, you can choose a tool that fits your goals.
Evaluating Usability
Usability makes a big difference. You want a tool that’s easy for you and your team to use every day. Check out this table to help you compare:
| Usability Factor | Description |
|---|---|
| Features | Does the tool offer what you need? Look for customization, real-time data, integrations, and clear visuals. |
| Ease of use | Is the interface simple? Can your team learn it quickly? |
| Scalability | Will the tool grow with your ecommerce business? |
| Cost | Are the prices clear? Watch out for hidden fees. |
| Support | Is help available when you need it? |
| Security | Does the tool keep your data safe and meet industry standards? |
FanRuan’s FineReport and FineBI stand out here. They offer drag-and-drop dashboards, real-time analytics, and easy integration, so you spend less time training and more time selling.

Support and Resources
Support matters when you run into problems or have questions. Leading ecommerce reporting tools offer helpful resources, like tutorials, live chat, and community forums. Some tools, such as Kustomer and Help Scout, provide customizable workflows and built-in reporting. FanRuan’s solutions also give you access to responsive support and a rich library of guides, so you never feel stuck.
Making the Decision
Ready to pick your ecommerce reporting tool? Here are some tips:
- Set clear business goals so your tool matches your needs.
- Focus on parts of your marketing that need better data.
- Choose a tool that gives you quick, visual answers.
- Look for solutions that combine all your data in one place.
FanRuan’s FineReport and FineBI make it easy to scale, customize, and get insights fast. You’ll find that choosing the right tool helps your ecommerce store grow and keeps you ahead of the competition.
Picking the right ecommerce reporting tools can change how you run your store. You get real-time data, spot trends, and make decisions faster. Check out the table below to see how the right ecommerce analytics tools help your business grow:
| Benefit | Description |
|---|---|
| Shorten decision cycles | Real-time data helps you act quickly. |
| Reduce wasted spend | Find and fix problems in your marketing. |
| Fuel experimentation | Test new ideas with solid data. |
| Forecast impact | Predict what’s next for your ecommerce store. |
Ecommerce brands need clear insights to stay ahead. When you compare tools, look for features like customizable dashboards and deep customer analysis. Try a free trial of FineReport to see which ecommerce solution fits your needs best.


FAQ

The Author
Lewis
Senior Data Analyst at FanRuan
Related Articles

Financial Reporting Valuation Explained: A Practical Guide to ASC 820, ASC 805, ASC 350, and ASC 718
$1 valuation is the process companies use to measure assets, liabilities, equity instruments, and reporting units for compliant $1. For CFOs, controllers, finance directors, and audit facing accounting teams, the challen
Yida Yin
Jun 25, 2026

Best Ad Reporting Tool in 2026: 8 Options Compared for Marketers and Analysts
$1 is an $1 and dashboard platform that helps teams unify ad data, build highly customized reports, and automate distribution at scale. 8 ad reporting tool options compared 1. DashThis One sentence overview: DashThis is
Yida YIn
Jun 25, 2026
Office 365 Reporting Tool Guide: Track Usage, Security, and License Waste in One Dashboard
An office 365 $1 should do more than generate static usage charts. For IT managers, operations leaders, and Microsoft 365 administrators, the real value is operational visibility: who is actually using the platform, wher
Yida Yin
Jun 25, 2026