

A flag pattern in trading shows a quick break before the price keeps moving the same way. You can see this pattern when prices jump up or down, then make a small, slanted box shape. Traders look for flag patterns to find good times to enter or check a trend. If you use tools like FineBI from FanRuan, you can study these patterns with real numbers and make better choices.

When you look at trading charts, you might see a flag pattern. This pattern comes after a big price jump called the flagpole. After that, the price moves sideways or a little down. It makes a small box or slanted shape. The shape looks like a flag on a stick. In technical analysis, this pattern means the market is taking a short break. The price will likely keep moving the same way after the break. Experts say a flag pattern is a chart shape that shows a pause in a trend. After the pause, the trend usually keeps going. You can find this pattern by looking for a fast move, a short rest, and then a breakout above or below the flag.
Here are the main parts of a flag chart pattern:
| Component | Description |
|---|---|
| Flagpole | Shows a strong, quick, and usually straight up price move. |
| Flag | Means the price is resting, making a box or slanted shape, often going down. |
| Breakout | Happens when the price leaves the resting area, showing the trend will keep going. |
You will see these things when you look for flag patterns in trading.
Flag patterns help you see how prices move in the market. First, there is a strong move up or down. This makes the flagpole. Next, the price stops and moves sideways or a little against the main trend. The flag part often goes down in a bullish flag or up in a bearish flag. During this time, fewer people are trading, so volume drops.
After the rest, the price often breaks out above the top in a bullish flag or below the bottom in a bearish flag. This breakout means the trend will probably keep going. You can use flag patterns to guess what prices might do next and plan your trades.
Flag patterns are important because they help you make better trading choices. When you know how these patterns work, you can find good times to buy or sell. This helps you set stop-loss and take-profit points more easily. You can also manage your risk better by using the flag’s shape and breakout spots.
Tip: Flag patterns help you guess what the market might do next. You can plan your trades better and avoid extra risk.
Here are some reasons why flag patterns are useful:
You often see flag patterns in markets with strong trends. Bullish flag patterns come after big price jumps. Bear flag patterns show up after big drops. Both types help you understand the market and make smarter decisions.
When you look at trading charts, you will see two main flag patterns. Each one gives hints about what could happen next in the market. Knowing how they are different helps you make smarter choices and find good times to trade.
A bullish flag pattern comes after a big price jump. First, the price goes up fast. This makes the flagpole. Then, the price moves sideways or a little down. This makes the flag. The flag looks like a small box or a slanted rectangle. This pattern means buyers are taking a short break before pushing prices higher.
Here is a table to help you spot a bullish flag on a chart:
| Characteristic | Description |
|---|---|
| The pole | A strong upward price movement that forms the initial surge. |
| The flag | A consolidation phase where prices move sideways or slightly downward, resembling a flag. |
You can use the bullish flag pattern to find times when the price might break out and go higher. Many traders look for this pattern when prices are rising fast. If the price breaks above the flag, the trend often keeps going up.
FineBI by FanRuan helps you find these patterns quickly. You can use live data and charts to see the flagpole and flag. FineBI lets you watch price moves and volume changes. This makes it easier to check the pattern before you trade.
FineBI gives traders a clearer view of real-time patterns—so you can act with confidence, not guesswork. (click the demo to engage)
A bearish flag pattern shows up after a big price drop. First, the price falls fast. This makes the flagpole. Then, the price moves up a bit or sideways. This makes the flag. The flag often tilts up, showing a short pause before sellers push prices lower again.
Here is a table that shows the key features of a bearish flag pattern:
| Feature | Description |
|---|---|
| Structure | Consists of a sharp downward move (flagpole) followed by a short upward consolidation (flag). |
| Context of Formation | Indicates a continuation of the downtrend upon a breakout below the lower boundary of the flag. |
| Volume Characteristics | Trading volume tends to decline during the formation, indicating consolidation. |
| Breakout | Considered complete when the price breaks below the lower boundary, confirming bearish sentiment. |
| Price Target | Estimated by measuring the height of the flagpole and projecting it downward from the breakout point. |
| Confirmation | Additional technical indicators or analysis methods are used to confirm the pattern before trading. |
You can use the bearish flag pattern to spot times when the price might keep falling. If the price breaks below the flag, it often means the downtrend will keep going. This pattern helps you plan trades and manage risk.
FineBI makes it easy to see the bear flag pattern. You can use dashboards to watch for volume drops and price pauses. FineBI’s tools help you check the pattern and avoid mistakes.
You should know the main differences between the two flag patterns. This helps you pick the best plan for each trade. Here is a table that compares them:
| Pattern Type | Structure Description | Expected Outcome |
|---|---|---|
| Bullish Flag | Occurs after an upward price movement; consolidation phase slopes downward. | Price continues to rise after breakout. |
| Bearish Flag | Forms after a downward price movement; consolidation phase slopes upward. | Price continues to fall after breakout. |
A bullish flag pattern forms after a price jump and points to more gains. A bearish flag pattern comes after a price drop and hints at more losses. Both patterns show a short pause, then a breakout in the same direction as the flagpole.
You can use FineBI to compare both flag patterns side by side. The platform lets you see different patterns, track price moves, and set alerts for breakouts. This helps you act fast and make better trading choices.
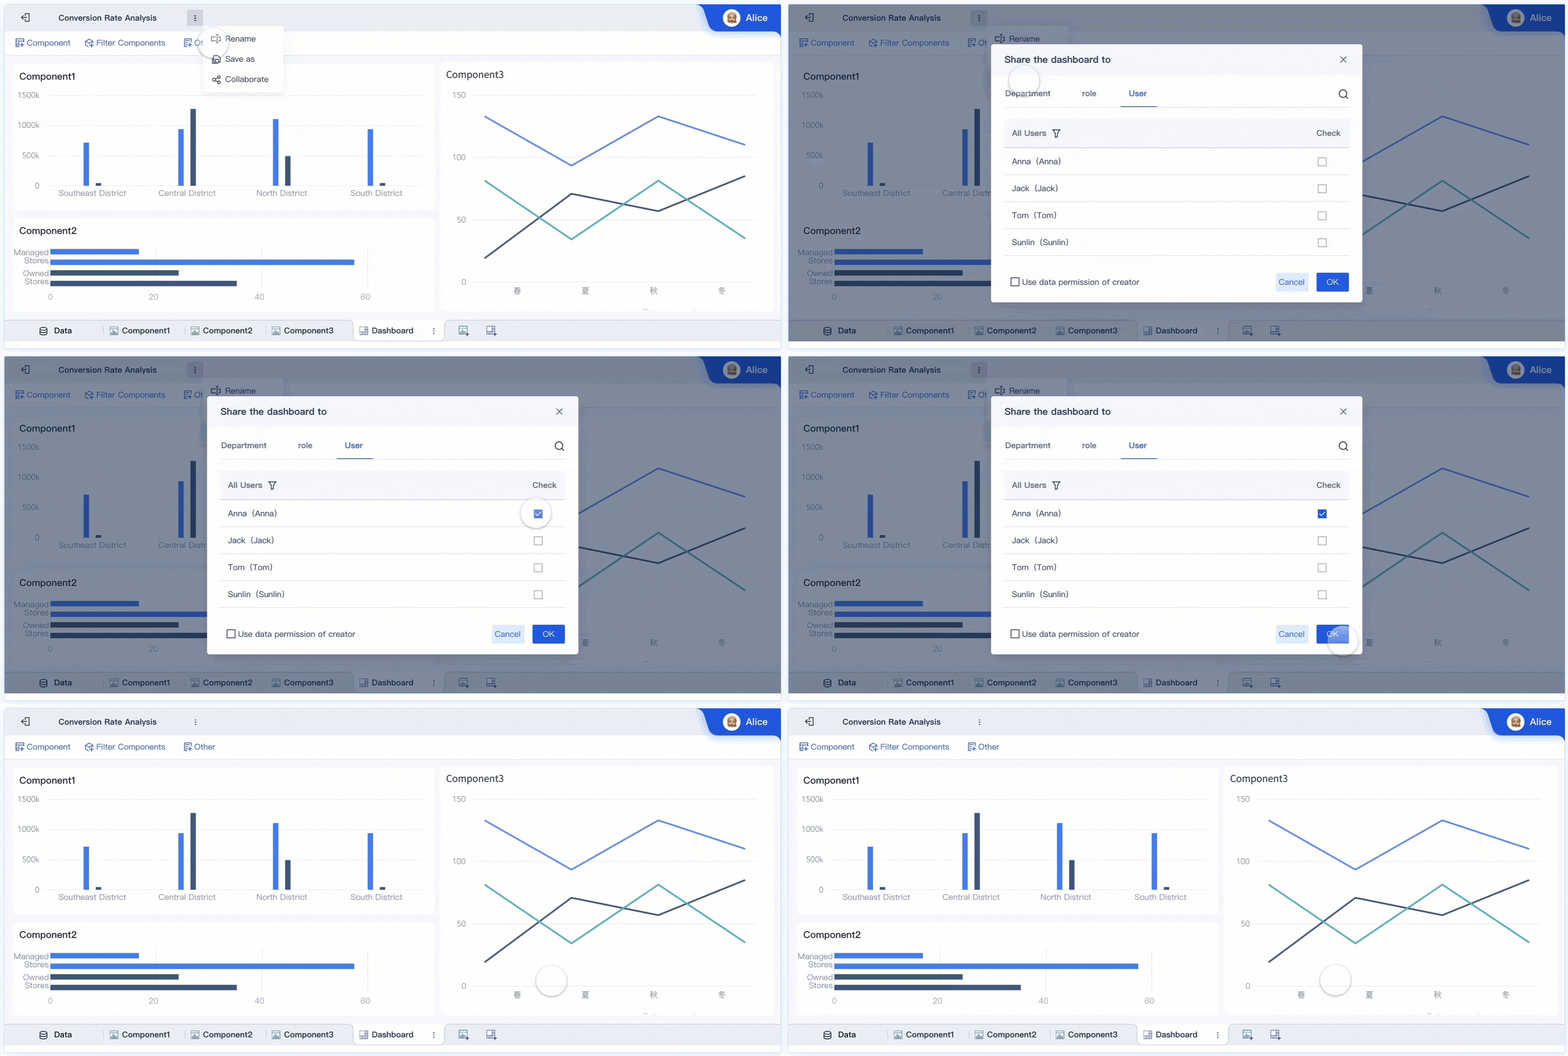
Tip: When you use FineBI, you can study flag patterns with live data. This gives you a clear look at the market and helps you trade with confidence.
By learning about the types of flag pattern, you can spot trends, plan trades, and use tools like FineBI to help with your analysis.
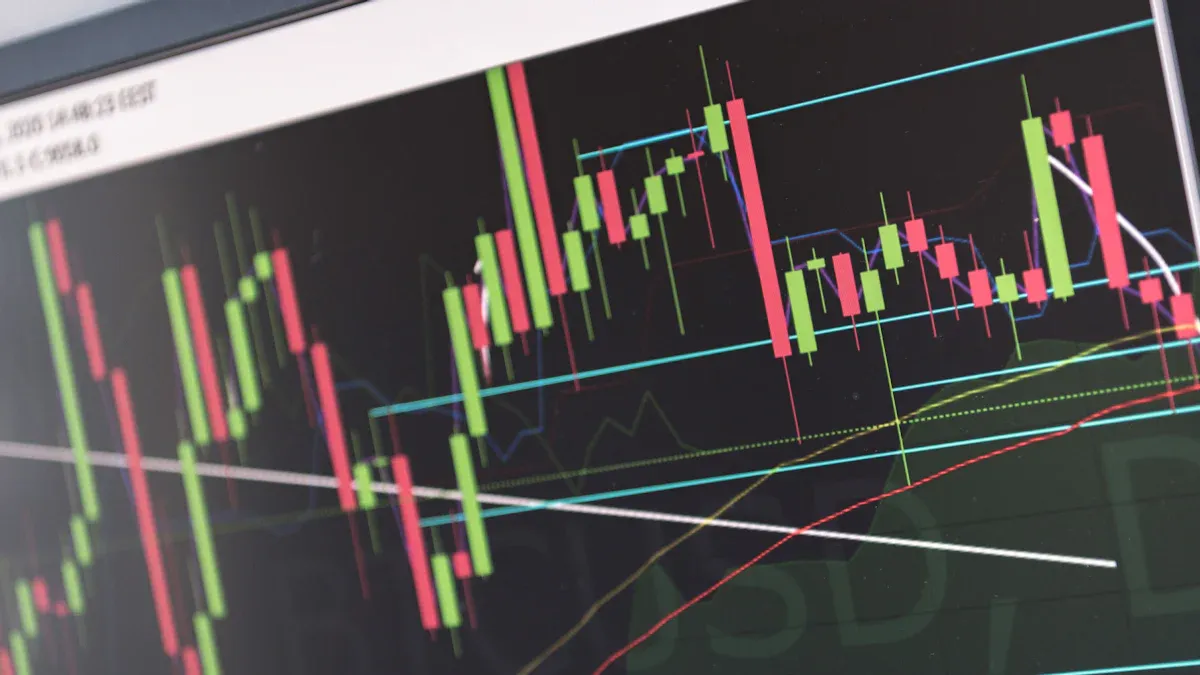
When you want to spot a flag pattern, you need to look for certain features on your chart. The flag chart pattern has clear signs that help you find it quickly. Here is a table that shows the most reliable features:
| Feature | Description |
|---|---|
| Flagpole | A sharp price movement that starts the pattern. |
| Consolidation Phase | The price moves sideways, forming the flag and showing a pause in the trend. |
| Volume | Trading volume usually drops during the flag, hinting at less market activity before a breakout. |
| Flag | The flag looks like a rectangle or channel, sloping against the pole. |
| Volume Behavior | Lower trading volume during the flag, which can signal a possible breakout above or below. |
You should always check these features when you look for a flag pattern. They help you see if the pattern is real or just a random move.
FineBI makes this process easier. You can use its data visualization tools to highlight price movements and volume changes. With FineBI, you can set up dashboards that show these features in real time. This helps you spot the flag pattern faster and with more confidence.
After you find a possible flag pattern, you need to confirm it before making any trading decisions. Follow these steps to check if the pattern is valid:
FineBI can help you with each step. You can use its charts to track the flagpole, flag, and breakout. You can also add technical indicators to your dashboard for extra confirmation.
Many traders make mistakes when they try to spot a flag pattern. Here are some things to watch out for:
FineBI helps you avoid these mistakes. Its analytics can alert you to changes in volume and price movements. You can also review past trades to see where you went wrong and improve your skills.
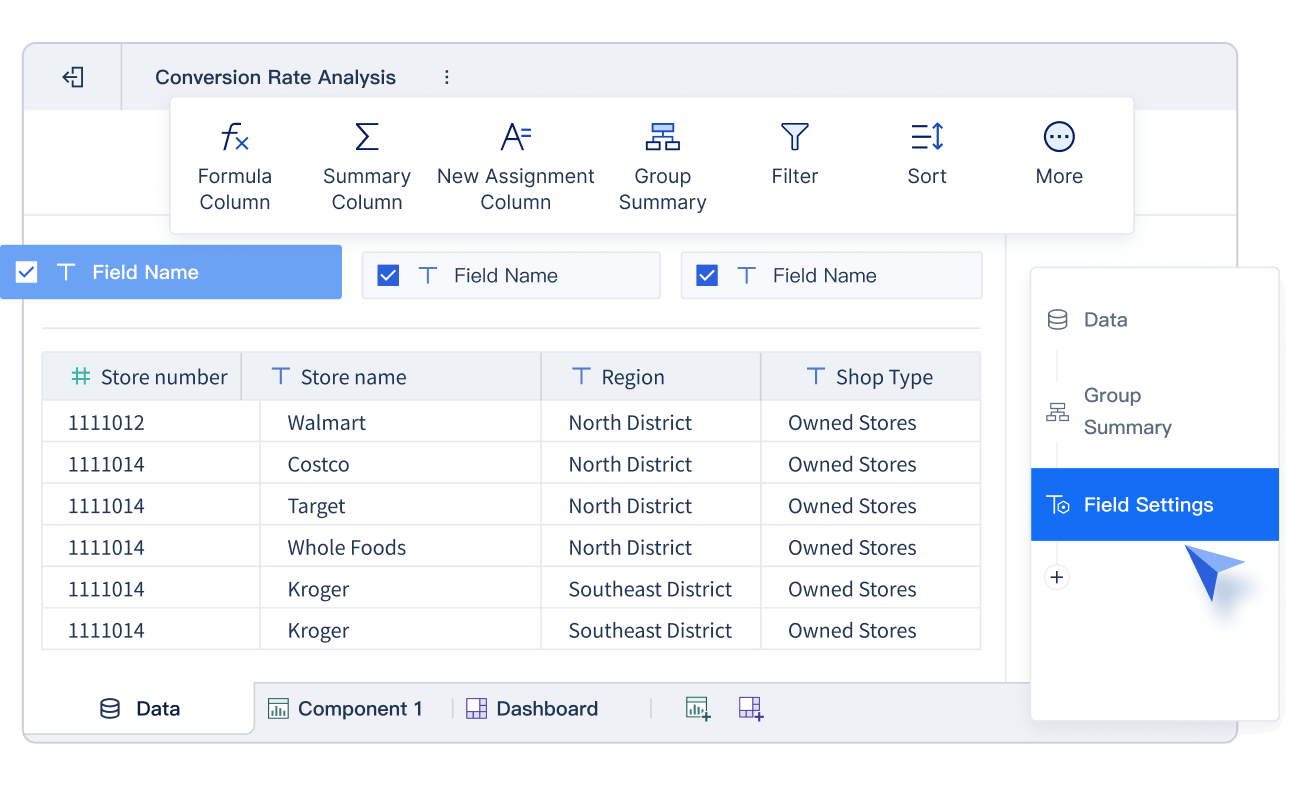
Tip: Use FineBI’s real-time dashboards to track flag patterns and avoid common errors. This will help you make better trading decisions and manage your risk.
You can use a flag pattern to find strong entry and exit points in trading. First, watch for a breakout above the flag in a bullish flag pattern or below the flag in a bearish flag pattern. This breakout signals the best time to enter your trade. Place your stop-loss just outside the flag body. For bullish flags, keep it below the flag. For bearish flags, set it above the flag. Your profit target often matches the length of the flagpole.
Here is a table to help you plan your trades:
| Pattern Type | Entry Point | Stop-Loss Point | Exit Point |
|---|---|---|---|
| Bullish Flag | Price breaks above the upper trendline with volume | Below the lower trendline of the flag | Flagpole length added to breakout point |
| Bearish Flag | Price breaks below the lower trendline with volume | Above the upper trendline of the flag | Flagpole length projected downward |
FineBI helps you spot these entry and exit points. You can use its data visualization tools to track price movements and volume changes. FineBI lets you analyze historical data, so you can improve your decisions for future trades.
Managing risk is important when you trade a flag chart pattern. You should always use stop-loss orders to protect your money. Place your stop-loss just outside the flag pattern. This helps you avoid big losses if the market moves against you. Set your profit target based on the flagpole length. FineBI allows you to test your risk controls by backtesting different strategies. You can see how your plan works with past price movements and adjust your approach.
Tip: Use FineBI’s dashboards to monitor your trades in real time. You can set alerts for breakouts and volume spikes, helping you react quickly. (click the demo to engage)
You can use FineBI to apply flag pattern strategies in real trading. For example, you might see a stock move up sharply, then form a flag between two price levels. When the price breaks out above the flag, you enter the trade. Set your stop-loss below the flag and your target at the flagpole length. FineBI helps you track these steps with live charts and volume analysis.
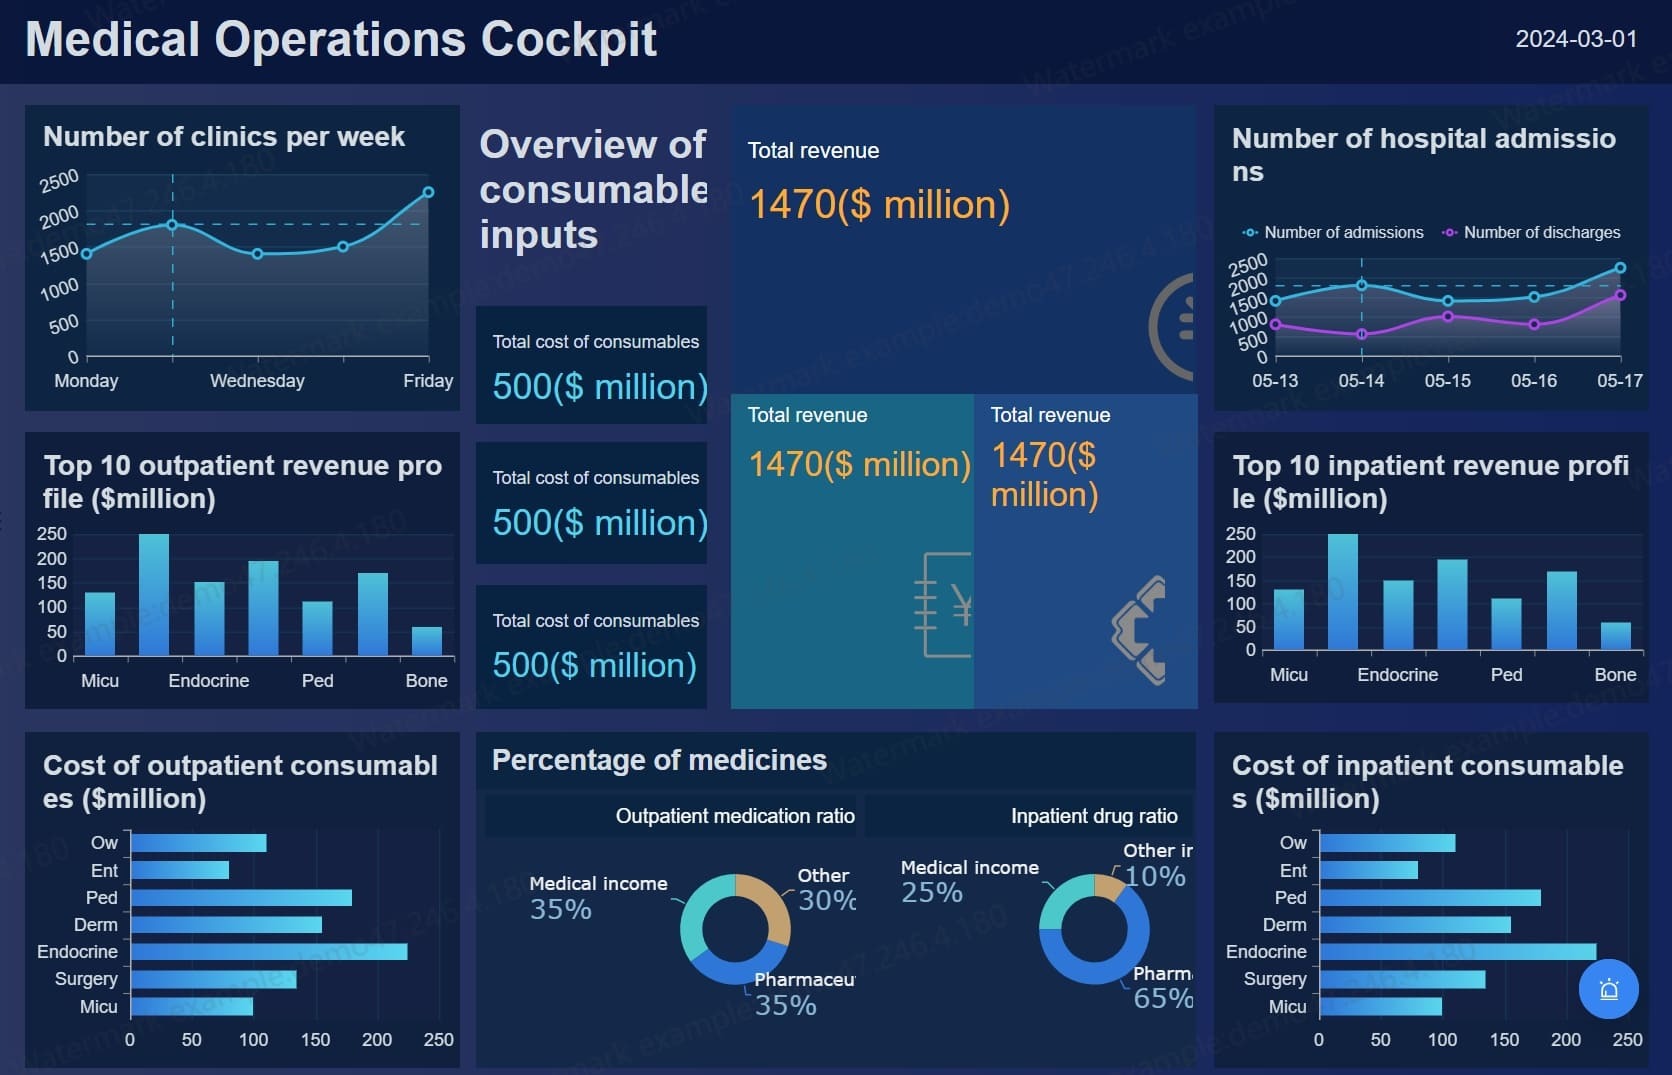
Here is how you might use FineBI in a real trade:
FineBI’s technical analysis tools, real-time monitoring, and pattern recognition features make it easier for you to optimize your flag pattern strategy. You can backtest your ideas, watch for breakouts, and improve your results with data-driven insights.
You might see both flag and pennant patterns on charts. These two patterns look alike, but they are not the same. The table below shows how they are different:
| Pattern Type | Structure Description |
|---|---|
| Flag Pattern | Made by two straight lines that form a rectangle shape. |
| Pennant Pattern | Made by two lines that come together to make a small triangle. |
The flag pattern looks like a box or channel that goes against the main trend. The pennant pattern looks like a small triangle as the lines get closer. Both patterns show a short pause before the price keeps moving the same way. It is easier to spot a flag pattern because its lines are straight and run side by side. The pennant pattern is smaller and looks more like a wedge.
You can trust the flag pattern because it often means the trend will keep going. Many traders use it to help them decide when to trade. The flag pattern is easy to find and happens a lot. It usually works well and can help you guess where the price will go. If you read the pattern right, the price often moves in the breakout direction.
But there are some things to watch out for:
You should always check the flag pattern with other tools before you trade. FineBI lets you look at old trades and see how the flag pattern worked before. You can use FineBI to see how often the flag pattern leads to a real breakout. This helps you make better choices and feel more sure about your trades.
Tip: Use FineBI to check how the flag pattern worked in the past. This helps you see if the pattern is good for your market and helps you avoid mistakes.
You can use the flag pattern to feel more sure about trends. FineBI gives you tools to help you make smart choices using real data.
You gain a real advantage when you understand the flag pattern in trading. This pattern helps you spot strong trends and manage risk.
The flag pattern often tricks new traders, but with the right tools, you can make smarter choices. FineBI from FanRuan gives you the power to analyze data and improve your trading results.
Try these strategies and let analytics guide your next move.
FanRuan
https://www.fanruan.com/en/blogFanRuan provides powerful BI solutions across industries with FineReport for flexible reporting, FineBI for self-service analysis, and FineDataLink for data integration. Our all-in-one platform empowers organizations to transform raw data into actionable insights that drive business growth.
You see a sharp price move, then a small box or slanted shape. The flag slopes against the main trend. Volume drops during the flag.
Wait for the price to break out above or below the flag. This breakout shows you the best time to enter your trade.
Yes. FineBI lets you track price moves and volume changes. You can set up dashboards to highlight flag patterns in real time.

