Reporting and analytics play crucial roles in business, but each serves a different purpose. The choice between reporting or analytics depends on business goals and the stage of data maturity. Organizations at the initial level rely on reporting for manual tracking, while advanced teams use analytics for strategic decisions and real-time insights.
Recent trends show that AI, cloud computing, and data democratization increase the importance of analytics. FanRuan’s FineReport and FineBI help companies match their reporting and analytics needs to their unique objectives.
Key Takeaways
- Reporting helps businesses track past and current data through clear, structured reports and dashboards, supporting timely decisions and compliance.
- Analytics goes beyond reporting by exploring data patterns and predicting future trends to guide strategic planning and improve business performance.
- Choosing between reporting and analytics depends on your business goals, data maturity, and the type of insights you need—use reporting for monitoring and analytics for forecasting.
- Tools like FineReport simplify creating detailed reports without coding, while FineBI empowers users to explore data and gain deeper insights with advanced analytics.
- A clear decision framework and alignment with business objectives help organizations select the right approach and maximize the value of their data.
Reporting and Analytics Overview
What Is Reporting?
Reporting refers to the process of collecting, organizing, and presenting data in a structured format. Businesses use reporting to create static documents and dashboards that summarize historical information. These reports often blend data from multiple sources, such as databases, spreadsheets, and cloud applications.
Reporting tools help users understand data by providing querying capabilities and visualizations. Reports support decision-making by offering actionable insights and eliminating data silos. They empower non-technical users to generate and customize reports independently.
- Reporting tools integrate with a wide range of data sources, including SAP HANA, MS SQL Server, MySQL, and PostgreSQL.
- Reports provide in-depth analysis and trend projection, while dashboards offer real-time, interactive monitoring of current metrics.
- Data reporting ensures timely, informed decisions by making information accessible and understandable.
FanRuan’s FineReport serves as a leading example in this area. FineReport enables organizations to create pixel-perfect reports and dynamic dashboards. It connects to hundreds of data sources, automates report generation, and supports both scheduled and real-time reporting.
Note: Common challenges in reporting include manual processes, data inaccuracies, delayed distribution, and difficulty scaling as data grows.
What Is Analytics?
Analytics involves collecting, storing, and analyzing business data to generate insights about operations. Companies use analytics to identify patterns, trends, and relationships within their data. Analytics supports data-driven decision-making and optimizes key business functions such as sales, marketing, finance, supply chain, and human resources.
- Analytics tools integrate with enterprise data warehouses, cloud platforms like Google BigQuery and Snowflake, CRM systems, spreadsheets, and relational databases.
- Analytics uses techniques like data mining, OLAP, visualization, and predictive modeling to forecast future outcomes and improve efficiency.
- Advanced analytics incorporates machine learning and AI to automate pattern recognition and enable proactive decisions.
FanRuan’s FineBI exemplifies modern data analytics. FineBI allows users to connect to diverse data sources, prepare and process data, and build interactive dashboards. It supports self-service analytics, enabling business users to explore data independently. FineBI also leverages AI-driven insights and predictive analytics for deeper analysis.
Tip: Organizations face challenges in analytics such as changing technology, unclear goals, talent shortages, and data security concerns. Addressing these issues requires clear objectives, upskilling, and robust governance.
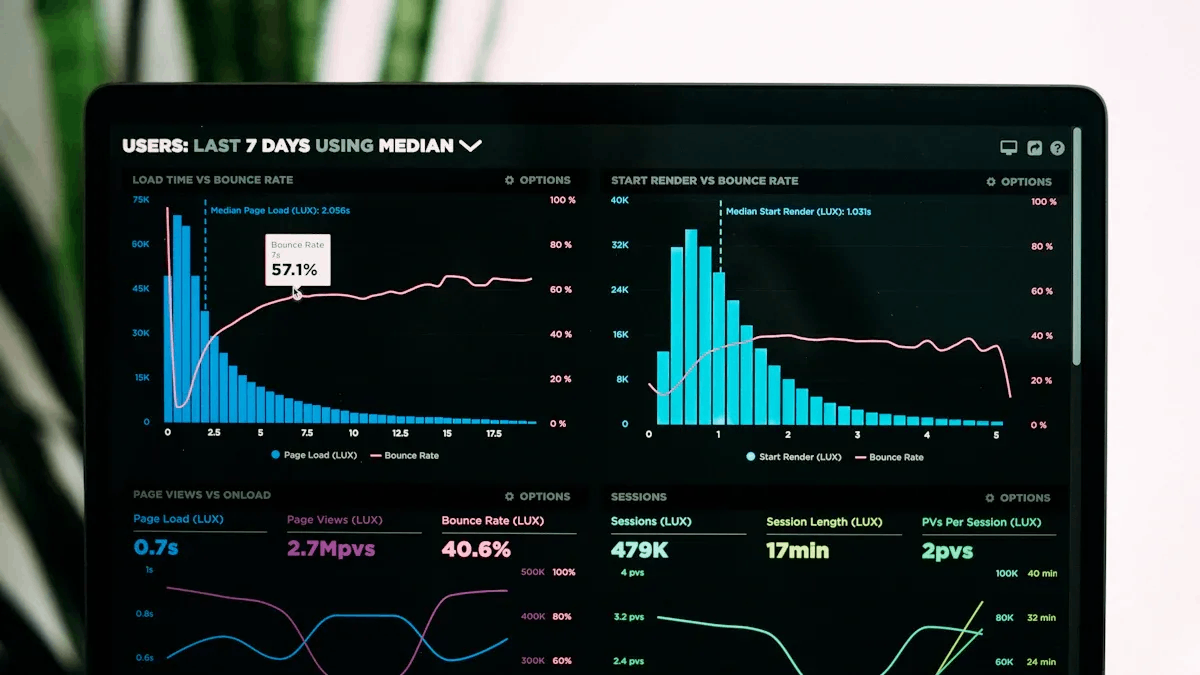
Below is a Regional Store Analysis Dashboard.
Key Differences Between Reporting and Analytics
Purpose and Process
The key differences between reporting and analytics begin with their core purpose. Reporting focuses on presenting historical and real-time data in a clear format. It helps organizations understand what has happened and what is currently happening. Analytics, on the other hand, aims to forecast future trends and optimize performance by exploring patterns in data.
The process for reporting involves collecting data, organizing it, and creating visualizations or documents. Teams use reporting to summarize information and communicate results to stakeholders. The difference between reports and analytics becomes clear in the workflow. Analytics requires technical steps such as defining questions, preparing and cleaning data, and applying statistical or machine learning methods. Analysts use data analytics to discover insights and test hypotheses. Reporting emphasizes communication and presentation, while analytics focuses on exploration and discovery.
| Aspect | Reporting (Business Intelligence) | Analytics (Data Analytics) |
|---|---|---|
| Purpose/Focus | Provide historical and real-time data insights to support decision-making; understand past and present operations; identify improvement areas. | Use predictive analytics to forecast future trends and events; enable data-driven decisions to optimize future performance. |
| Types of Analysis | Descriptive analytics: summarizing and describing data to understand past and present states. | Predictive analytics: forecasting future trends based on historical data. |
| Data Types | Primarily structured data. | Both structured and unstructured data; uses advanced techniques like machine learning and NLP. |
| Outputs | Dashboards and reports for monitoring performance and visualizing historical/real-time data. | Predictions and recommendations to guide future business strategies. |
| Goals | Improve decision-making by understanding what has happened and is happening. | Predict future trends and prescribe actions to optimize outcomes. |
| Suitability | More suited to reporting and visualization. | More suited to exploratory analysis and modeling. |
FineReport and FineBI address these key differences by offering specialized modules. FineReport streamlines report creation with an intuitive drag-and-drop interface. It connects to many data sources and automates report generation. FineBI supports advanced analytics, allowing users to prepare data, apply predictive models, and explore trends. Both tools help business users manage data efficiently, but each serves a distinct role in the analytics vs reporting landscape.
Output and Use Cases
The difference between reports and analytics also appears in their outputs and use cases. Reporting produces dashboards, static documents, and scheduled reports. These outputs help organizations monitor performance and ensure compliance. Analytics generates predictions, recommendations, and interactive dashboards. Teams use analytics to guide strategy and optimize future actions.
Common reporting use cases vary by industry:
| Industry | Common Reporting Use Cases and BI Applications |
|---|---|
| Financial Services | Financial management and analysis, forecasting, risk assessment, credit risk evaluation, automated report generation, compliance. |
| Healthcare | Patient care and personalized treatment, unifying medical records, illness pattern analysis, compliance with privacy laws (HIPAA). |
| Telecommunications | Customer segmentation, fraud detection, network performance monitoring, reducing support queues, analyzing call patterns. |
| Transportation | Route optimization, fleet management, revenue stream identification, driver performance evaluation using sensor and GPS data. |
| Hospitality | Dynamic pricing based on demand, real-time room supply and demand data, balancing marketing spend and customer experience. |
| Government & NGOs | Policy making, crisis response (e.g., COVID-19 data analytics), crime rate analysis, fundraising optimization, transparency in spending. |
| Others | Education, HR (employee onboarding, process automation), retail (trend analysis), fashion, and more. |
Analytics use cases include trend analysis, predictive modeling, and scenario planning. Organizations use data analytics to identify opportunities, reduce risks, and improve efficiency.
FineReport and FineBI offer features that support these outputs and use cases:
| Feature Aspect | Description |
|---|---|
| User Interface | Intuitive drag-and-drop interface enabling report creation without coding |
| Data Integration | Supports all mainstream databases and integrates with various business systems |
| Visualization | Offers dashboards and reports with 15+ categories and 60+ types of charts, maps, and 3D effects |
| Data Entry | Allows writing and updating data through reports, enabling small web applications without coding |
| Management | Centralized management of system resources, user permissions, report templates, and scheduling |
| Device Adaptability | Reports and dashboards adaptively display on mobiles, TVs, and large screens |
| User Feedback | Praised for ease of use, powerful customization, dynamic filtering, and impressive visualization |
| Target Users | Business users needing flexible, customizable reporting without deep programming skills |
FineReport excels at producing highly formatted reports and dashboards for regular monitoring and compliance. FineBI empowers users to perform self-service analytics, explore data, and generate actionable insights. These key differences between reporting and analytics help organizations choose the right tool for their needs.
Tip: Understanding the key differences between reporting and analytics allows organizations to match their tools to business goals and data maturity. FineReport and FineBI provide flexible solutions for both structured reporting and advanced analytics.
Reporting and Analytics in Practice
When to Use Reporting
Organizations rely on reporting when they need to track performance, ensure compliance, or monitor regular business activities. Reporting tools like FineReport help teams create structured documents and dashboards that summarize historical and real-time data. These reports support management by providing timely project information and clear views of business performance. For example, a manufacturing company may use FineReport to monitor production output, track inventory, and generate compliance reports for regulators. In the financial sector, reporting automates the collection and submission of data, reducing manual errors and ensuring timely delivery to authorities. Reporting also helps identify bottlenecks and redundancies in compliance processes, allowing organizations to optimize workflows.
Tip: Reporting tools streamline regulatory reporting, improve accuracy, and support risk assessment by creating comprehensive risk profiles.
FineReport enables users to design complex reports through a simple visual interface. This capability allows teams to assess projects using measurable dimensions, improving decision-making and operational oversight.
When to Use Analytics
Analytics becomes essential when organizations want to uncover trends, forecast outcomes, or support strategic planning. FineBI empowers users to perform self-service data analytics, explore patterns, and generate actionable insights. Companies use analytics to identify opportunities, reduce risks, and improve efficiency. For instance, Lotte.com used FineBI to analyze shopping cart abandonment, leading to increased customer loyalty and $10 million in additional sales. Cementos Argos built a business analytics center with FineBI, standardizing finance processes and improving profitability.
| Company | Challenge | Solution | Results |
|---|---|---|---|
| Lotte.com | Shopping cart abandonment | Customer experience analytics with FineBI | Increased customer loyalty and $10 million sales |
| Cementos Argos | Competitive advantage, decisions | Business analytics center with FineBI | Standardized finance, improved profitability |
FineBI supports diverse visualization types and integrates with other FanRuan products for end-to-end business analytics. It enhances operational efficiency by at least 50% compared to traditional methods, providing immediate feedback and supporting faster, more informed decisions. Finance teams using FineBI have reduced budgeting errors by 25%, showing measurable improvements in accuracy and decision-making.
Note: Analytics tools help organizations simulate future scenarios, align workforce needs, and recommend actionable strategies, making them vital for strategic planning and forecasting.
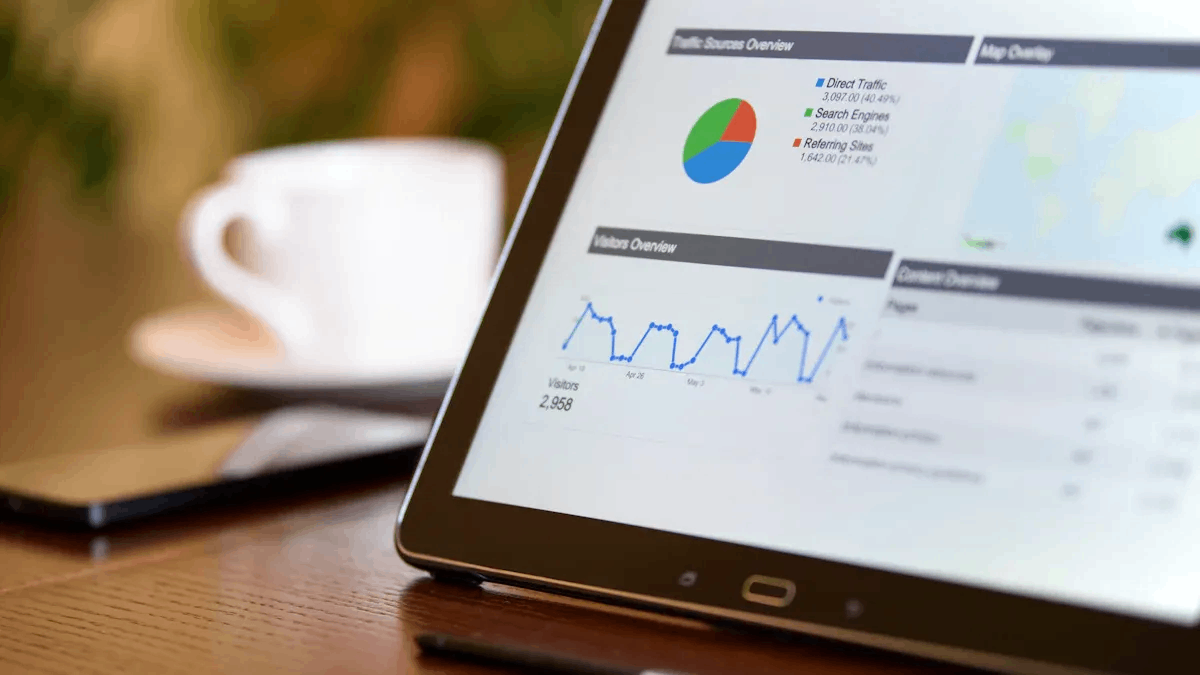
Below is a Financial User Analysis Dashboard.
Choosing the Right Approach in Reporting and Analytics
Decision Framework
Selecting between reporting and analytics requires a structured approach. Industry experts recommend using a decision framework that aligns with organizational goals and data maturity. The following steps help guide the process:
- Identify the type of analytics needed. Descriptive analytics focuses on historical data and suits reporting. Diagnostic analytics explores causes behind events, bridging reporting and deeper analytics. Predictive analytics uses models to forecast outcomes, while prescriptive analytics suggests actions based on predictions. Real-time analytics provides immediate insights for time-sensitive decisions.
- Set clear objectives. Organizations must define what they want to achieve, whether it is compliance, performance tracking, or strategic planning.
- Match the framework to business needs. Teams should select the approach that fits their current data capabilities and future ambitions.
- Prioritize data quality and consistency. Reliable data forms the foundation for both reporting and analytics.
- Use visualization tools to translate insights into actionable information.
- Regularly review and update frameworks to adapt to changing business environments.
- Act on insights and maintain data security.
FineReport and FineBI support these frameworks. FineReport excels at descriptive and diagnostic analytics, providing structured reports and dashboards. FineBI enables predictive and prescriptive analytics, allowing users to explore trends and make informed decisions.
Aligning with Business Goals
Organizations must align their choice of reporting or analytics with their business objectives. A simple checklist can help teams evaluate their needs:
- Assess ease of use by requesting a demo and testing report generation speed.
- Review available report types and ensure they meet stakeholder requirements.
- Confirm the ability to create ad hoc reports for flexible analysis.
- Test the solution in a trial environment to evaluate support and responsiveness.
- Investigate training resources and customer references.
- Verify integration capabilities with existing systems.
- Decide on data storage options, such as SaaS or self-hosting.
- Consider ongoing costs and data ownership rights.
- Check customization options for dashboards and reports.
FanRuan’s solutions address these checklist items. FineReport offers customizable reporting for compliance and operational monitoring. FineBI provides advanced analytics for business analytics, enabling teams to analyze trends and optimize strategies. Both tools integrate with multiple data sources and support scalable deployment, ensuring organizations can adapt as their needs evolve.
Tip: Organizations should foster a culture of data literacy and continuous communication. This approach supports effective adoption and maximizes the value of reporting and analytics.
Recent research shows that reporting and analytics serve distinct but complementary roles in business decision-making. Reporting presents key metrics in structured formats, helping organizations measure performance and communicate results. Analytics explores data to uncover trends and support strategic decisions, requiring specialized skills. To choose the right approach, organizations should:
- Verify data quality and accuracy.
- Consolidate data to address silos.
- Assess scalability for growing data volumes.
- Ensure privacy and security compliance.
- Identify skills gaps and plan for training.
By following these steps, teams can match their data challenges to the right solution. FanRuan’s FineReport and FineBI help organizations elevate their data-driven decision-making and realize the importance of analytics.

Continue Reading about Reporting and Analytics
Top 12 Reporting Tools Software Businesses Should Try
Best Reporting Tools for Businesses Looking to Grow


FAQ

The Author
Lewis
Senior Data Analyst at FanRuan