If you want your business to thrive in 2025, you need the best ai data analytics tools. Here are the 11 best AI data analytics tools every business should know:
- FineChatBI
- Microsoft Power BI Copilot
- Google Cloud AutoML Tables
- IBM Cognos Analytics
- Qlik Sense AI
- SAS Viya AI
- ThoughtSpot Sage
- Amazon QuickSight Q
- Domo AI
- Zoho Analytics AI
- Tableau AI
These tools change how you use data every day. You can spot trends, fix problems fast, and keep your team focused on what matters. The best ai data analytics tools give you real-time insights and let you scale as you grow. Check out how the best ai data analytics tools impact growth:
| Benefit | Impact on Business Growth and Efficiency |
|---|---|
| Improved Accuracy | Better decisions, fewer mistakes in data analysis |
| Scalability | Handles more data as your business grows |
| Enhanced Forecasting | Smarter business planning |
| Real-time Insights | Faster, more agile decisions |
| Higher Efficiency | More time for strategy, less on manual work |
FanRuan leads the way with its best ai data analytics tools like FineChatBI. As you look for the right data analytics solution, think about your industry, your data, and what you want from ai-powered tools.
Why Businesses Need AI Data Analytics Tools
Key Benefits of Data Analytics
You deal with more data every year. In 2025, you need data analytics tools to keep up. These tools help you turn raw data into clear, useful insights. You can spot trends, make better decisions, and stay ahead of your competition. Businesses now face huge amounts of data, and you need tools that can handle it all.
Here are some reasons why you should use data analytics tools:
- Data analysis tools help you process and understand large volumes of data, so you can make smarter choices.
- Automation and ai tools make advanced analytics easy for everyone, not just data experts.
- You can quickly find trends and get predictive insights, which helps you plan for the future.
- These tools transform unstructured data into clear answers, making your job easier.
- More companies now rely on ai tools for data analytics, showing how important these platforms have become.
Let’s look at some measurable benefits you get from using data analytics tools:
| Benefit | Description |
|---|---|
| Improved Decision Making | You get accurate, up-to-date information for faster, clearer decisions. |
| Increased Operational Efficiency | You find bottlenecks and fix them, making your business run smoother. |
| Enhanced Customer Experience | You learn what your customers want, so you can serve them better. |
| Cost Reduction | You spot waste and save money without cutting quality. |
| Competitive Advantage | You adapt quickly to market changes and grab new opportunities before others do. |
You can also boost your marketing campaigns and improve employee performance with the right data analytics platform.
How AI Enhances Data Analysis
AI tools take data analysis to the next level. You no longer have to wait hours for reports. AI tools analyze huge datasets in real time. They adapt and learn from new data, so your results keep getting better. You get deeper insights because ai can spot patterns that humans might miss.
| Aspect | AI Methods | Traditional Methods |
|---|---|---|
| Speed | Analyzes large datasets in real-time | Involves slower, manual processes |
| Accuracy | Adapts and learns from new data | Relies on static models needing updates |
| Insight Depth | Uncovers deeper, nuanced insights | Often provides surface-level analysis |
| Data Handling | Handles complex data types effectively | Limited in data type handling |
With ai tools, you can handle complex data, get faster answers, and trust that your analysis will keep improving as your business grows. These data analytics platforms help you stay agile and make smarter moves every day.
Best AI Data Analytics Tools for 2025

Choosing the right analytics platform can feel overwhelming. You want tools that fit your business, scale with your growth, and deliver clear data visualization. Let’s break down the top ai tools for 2025. Each one brings unique strengths to data analysis, visualization, and business intelligence.
Tip: When you compare analytics platforms, look at scalability, integration, visualization, pricing, security, and customization. Here’s a quick table to help you focus on what matters:
| Criteria | Description |
|---|---|
| Scalability and Performance | Handles your current data volumes and grows with your business. |
| Integration Capabilities | Connects easily with your existing systems and data sources. |
| Visualization and Storytelling | Turns complex data into clear, compelling visual narratives. |
| Pricing Structure and ROI | Balances upfront costs with long-term value and measurable impact. |
| Security and Compliance Features | Meets your industry’s regulatory needs and protects your data. |
| Customization Flexibility | Adapts to your unique business processes and reporting needs. |
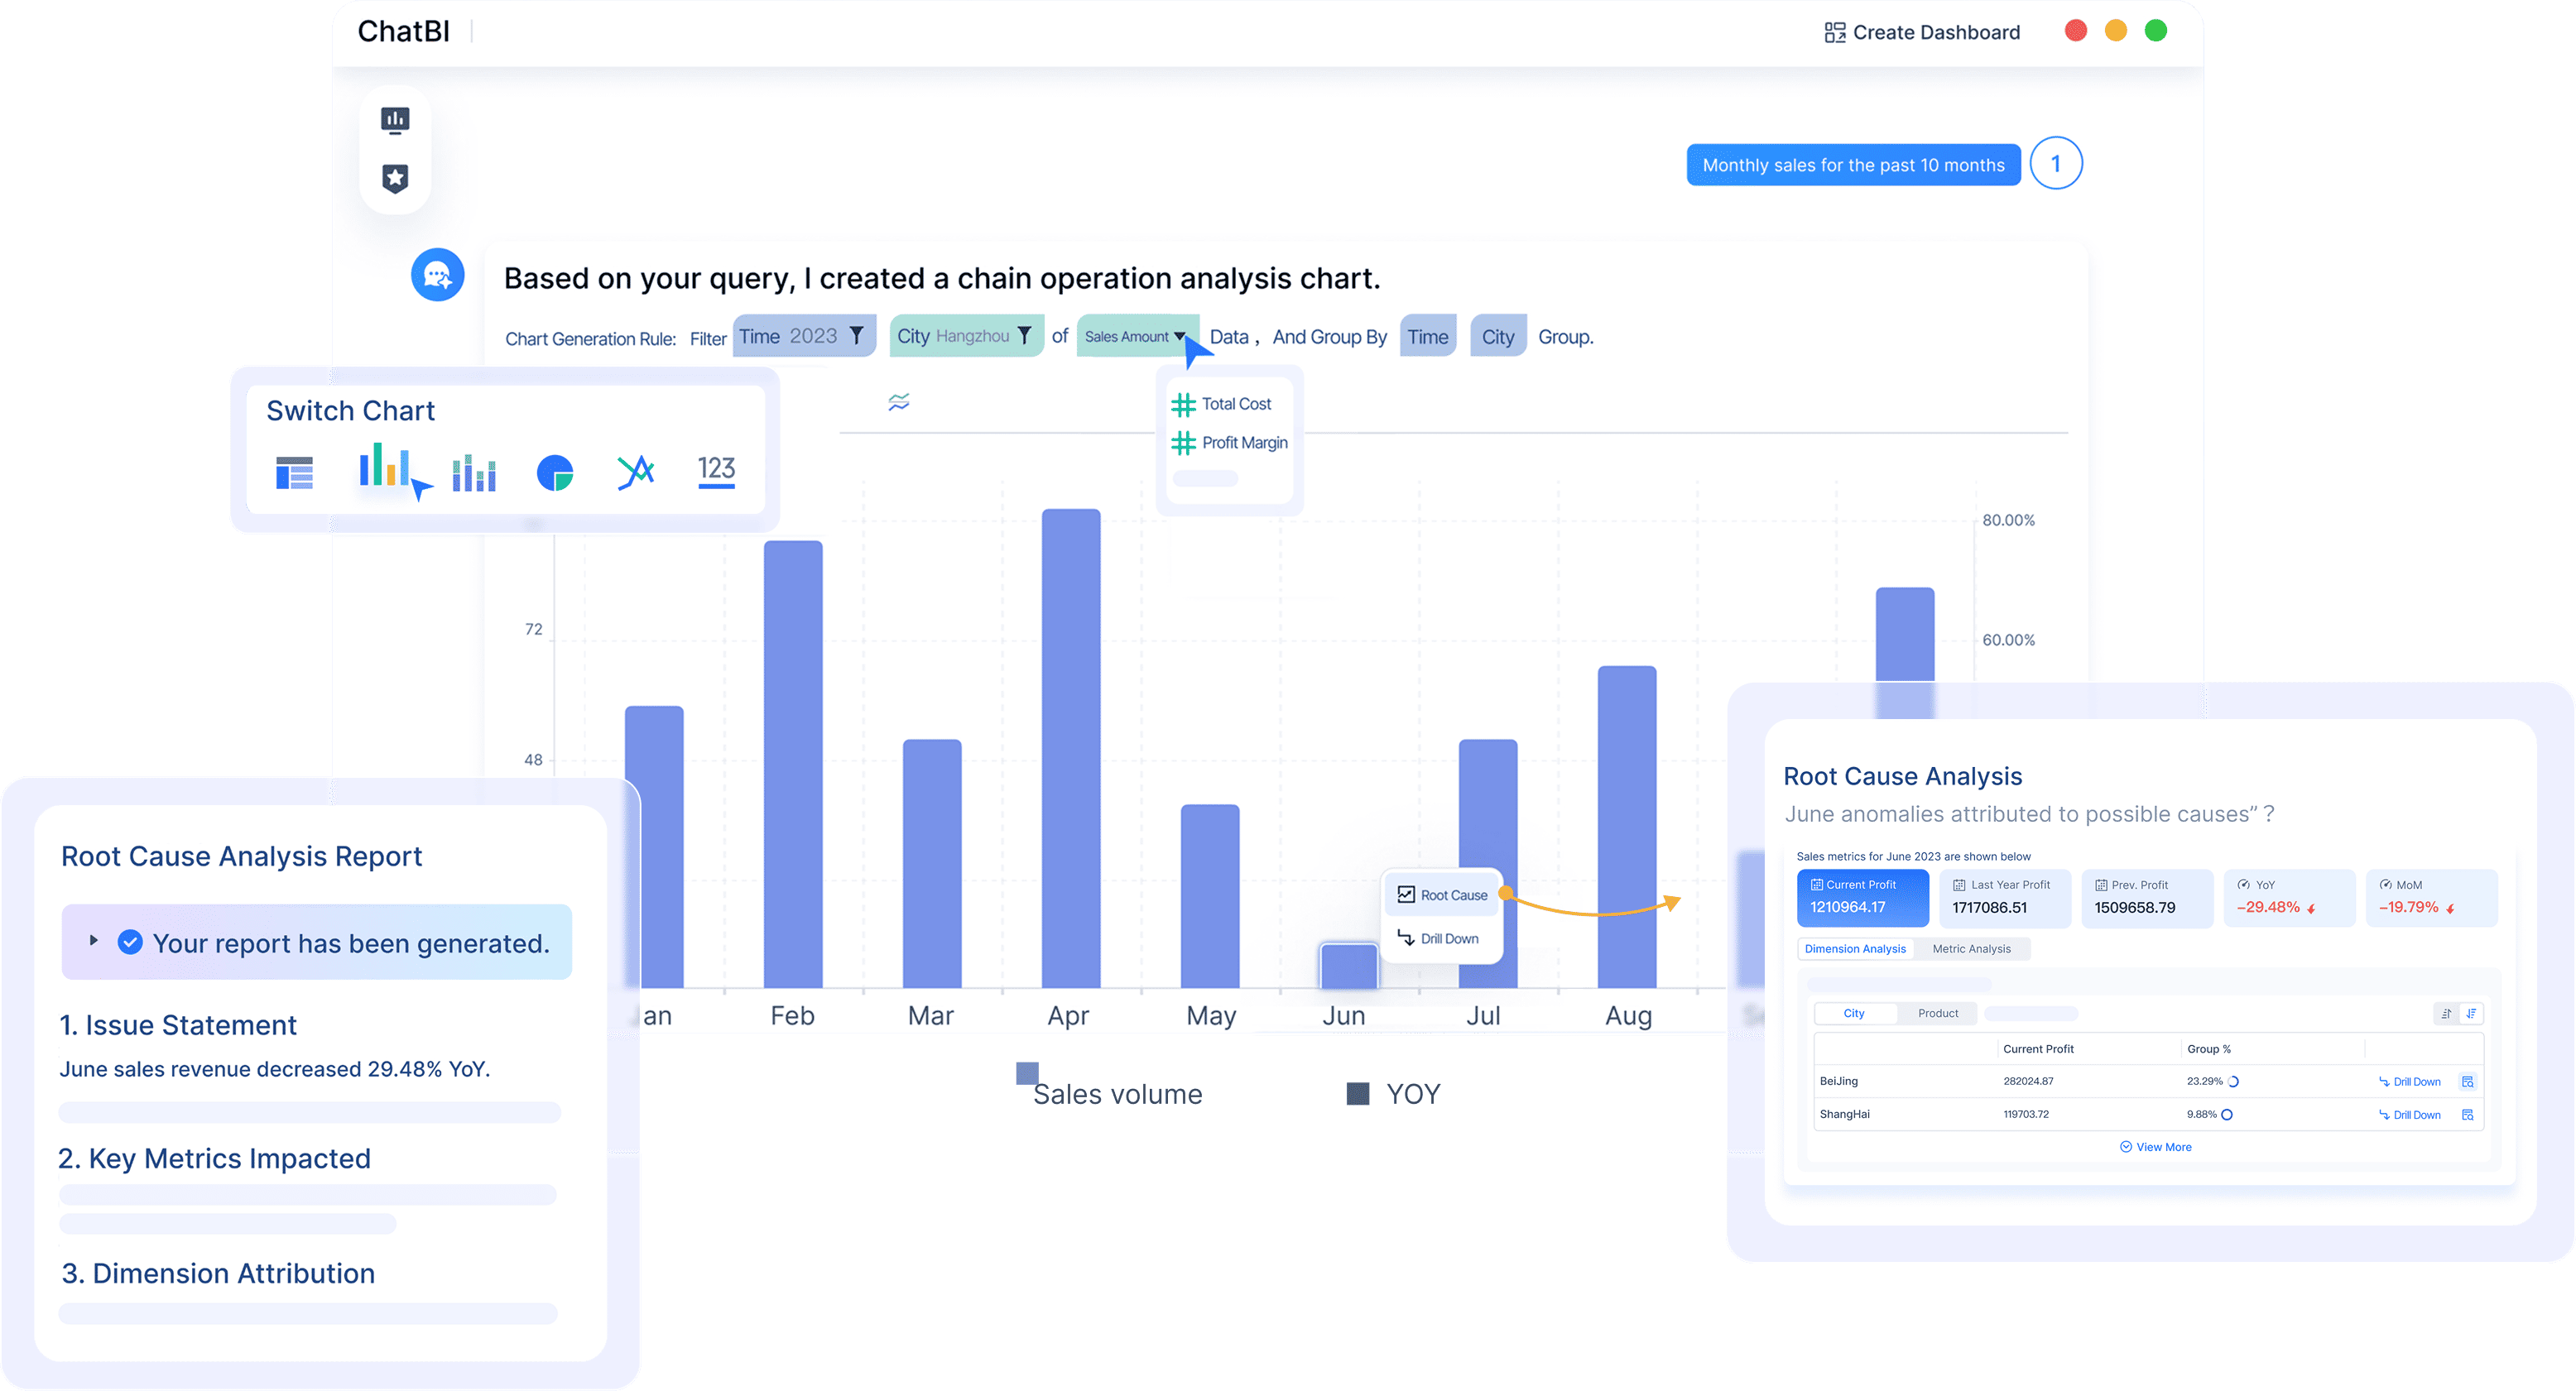
1.FineChatBI
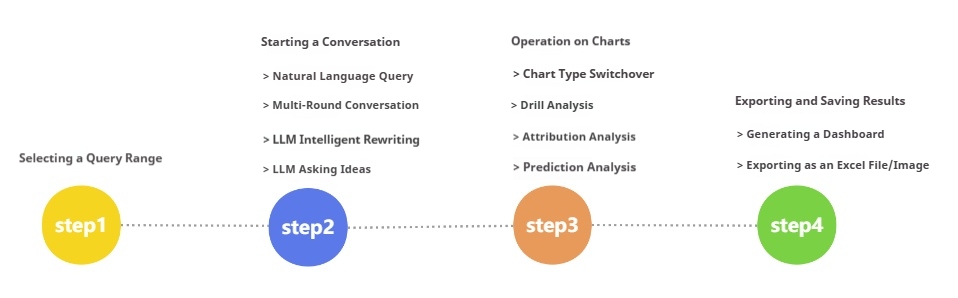
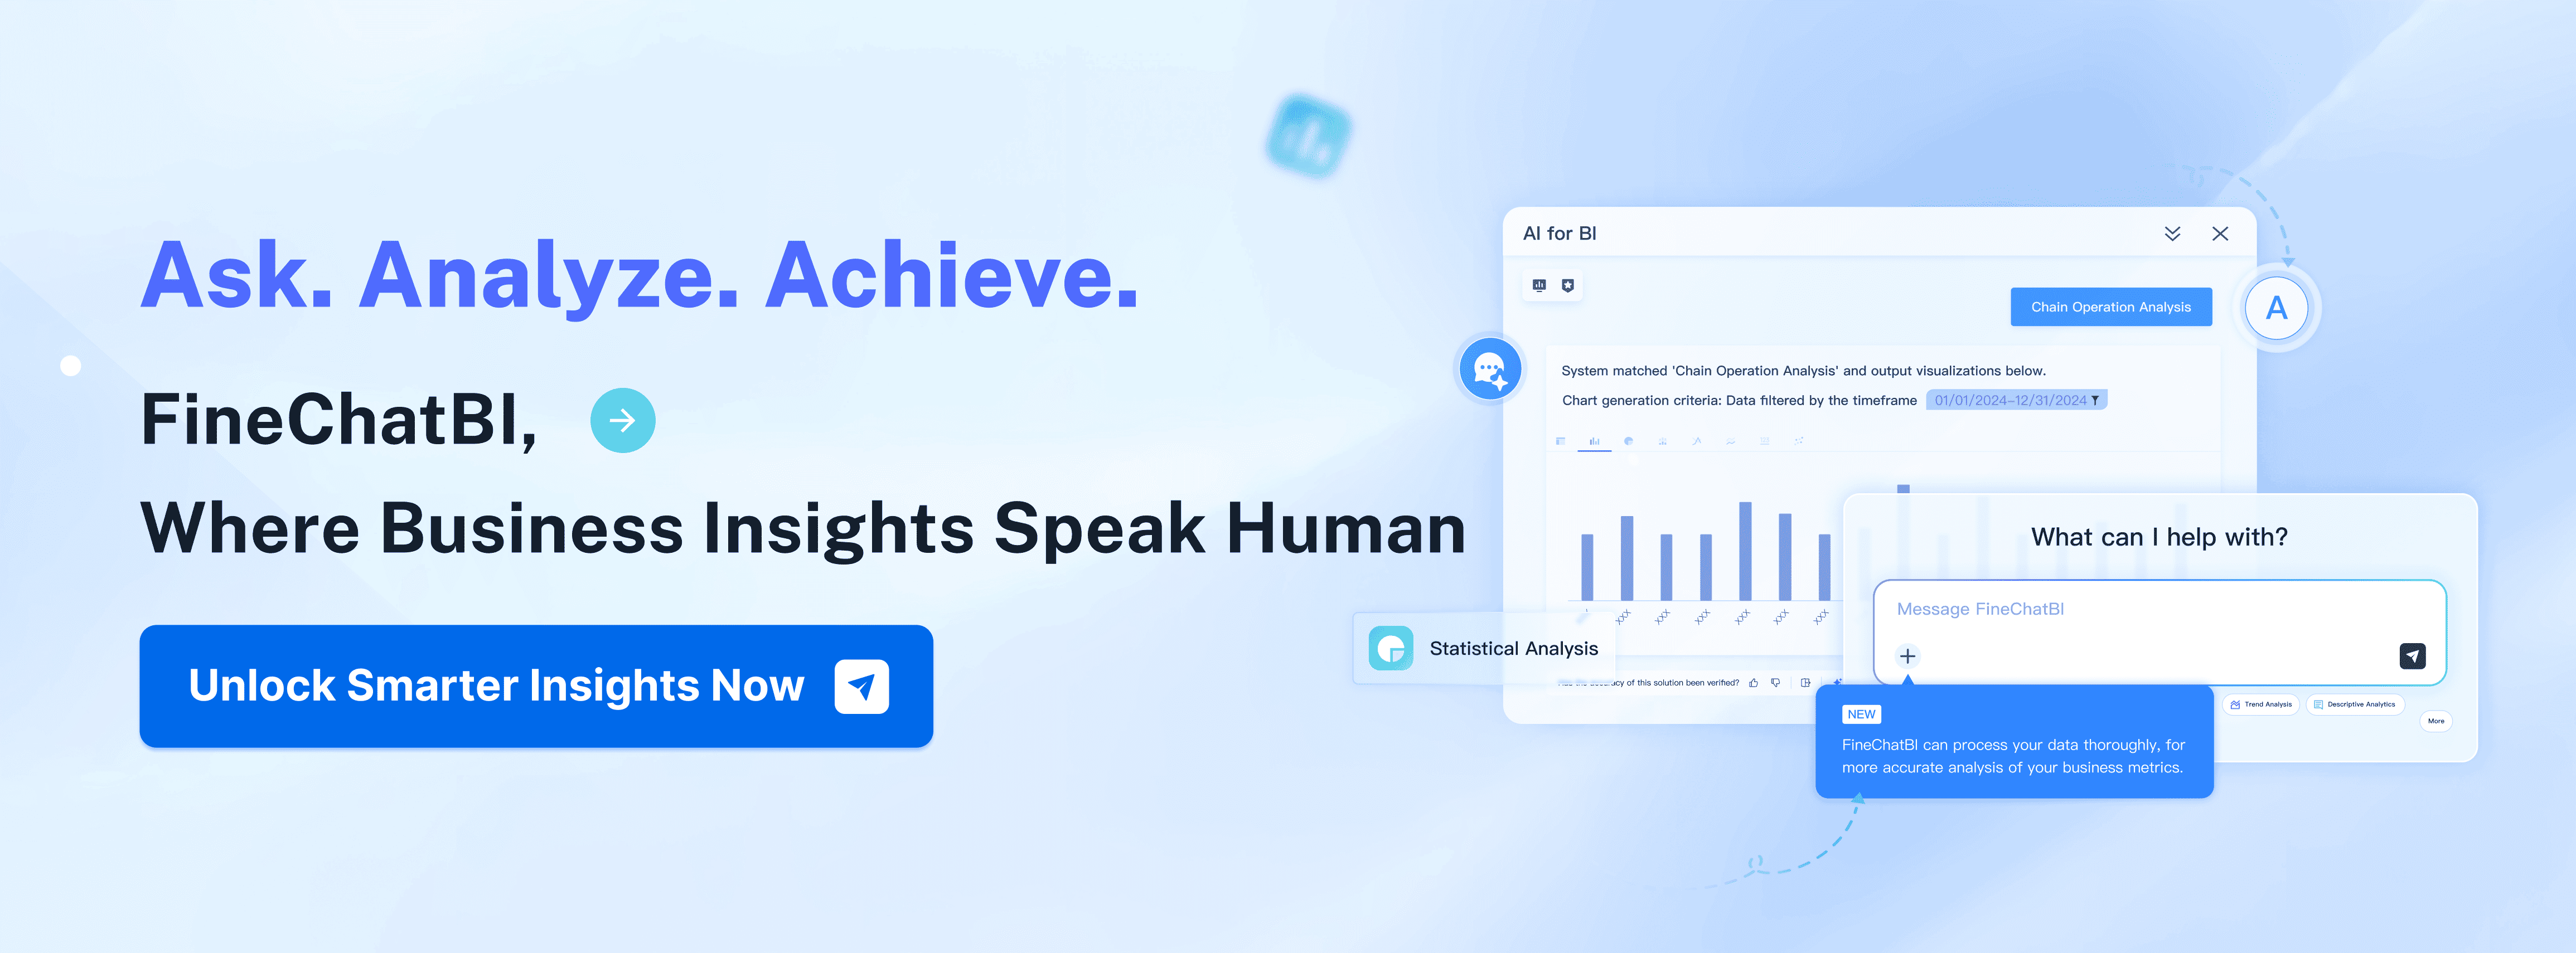
FineChatBI brings conversational ai to your analytics. You ask questions in natural language and get actionable insights. FineChatBI connects to multiple data sources for a unified view of customer behavior, booking patterns, and campaign performance. You optimize dynamic pricing, forecast demand, and adjust marketing strategies in real time. The platform enables audience segmentation, campaign monitoring, and growth opportunity identification. FineChatBI automates workflows, increases productivity, and focuses on strategic revenue management. You get higher occupancy, improved customer satisfaction, and sustained business growth.
Website: https://www.fanruan.com/en/finebi
- Supports data-driven decisions for revenue management and smart marketing.
- Lets managers ask questions in natural language for instant insights.
- Connects to multiple data sources for unified analysis.
- Optimizes pricing and forecasts demand in real time.
- Enables segmentation and campaign monitoring.
- Automates workflows and boosts productivity.
- Functions like ChatGPT within FineBI, making data exploration easy for everyone.
| Feature | FineChatBI | Description |
|---|---|---|
| Real-time Analytics | Yes | Get answers instantly through conversation. |
| Conversational AI | Yes | Interprets queries for intuitive interaction. |
| User Accessibility | Yes | Designed for everyone, not just tech experts. |
| Advanced Analytics | Yes | Uses Text2DSL for deep, clear insights. |
- Self-service and intuitive user experience.
- Scalable cost efficiency.
- Rapid deployment in hours.
- Integration with over 100 data sources.
FineChatBI is a powerful solution for businesses seeking conversational analytics combined with transparent, intuitive data visualization. Ideal for organizations of all sizes, it delivers fast, scalable analytics capabilities while making complex data accessible and actionable for users at every technical level.
2.Microsoft Power BI Copilot
Microsoft Power BI Copilot transforms analytics into a conversation. You ask questions in natural language and get instant answers. Copilot generates dashboards in seconds, so you interact with your data in real time. Advanced analytics highlight key influencers behind trends. You don’t need technical skills to create reports. Copilot automates report page generation, making analysis faster and easier.
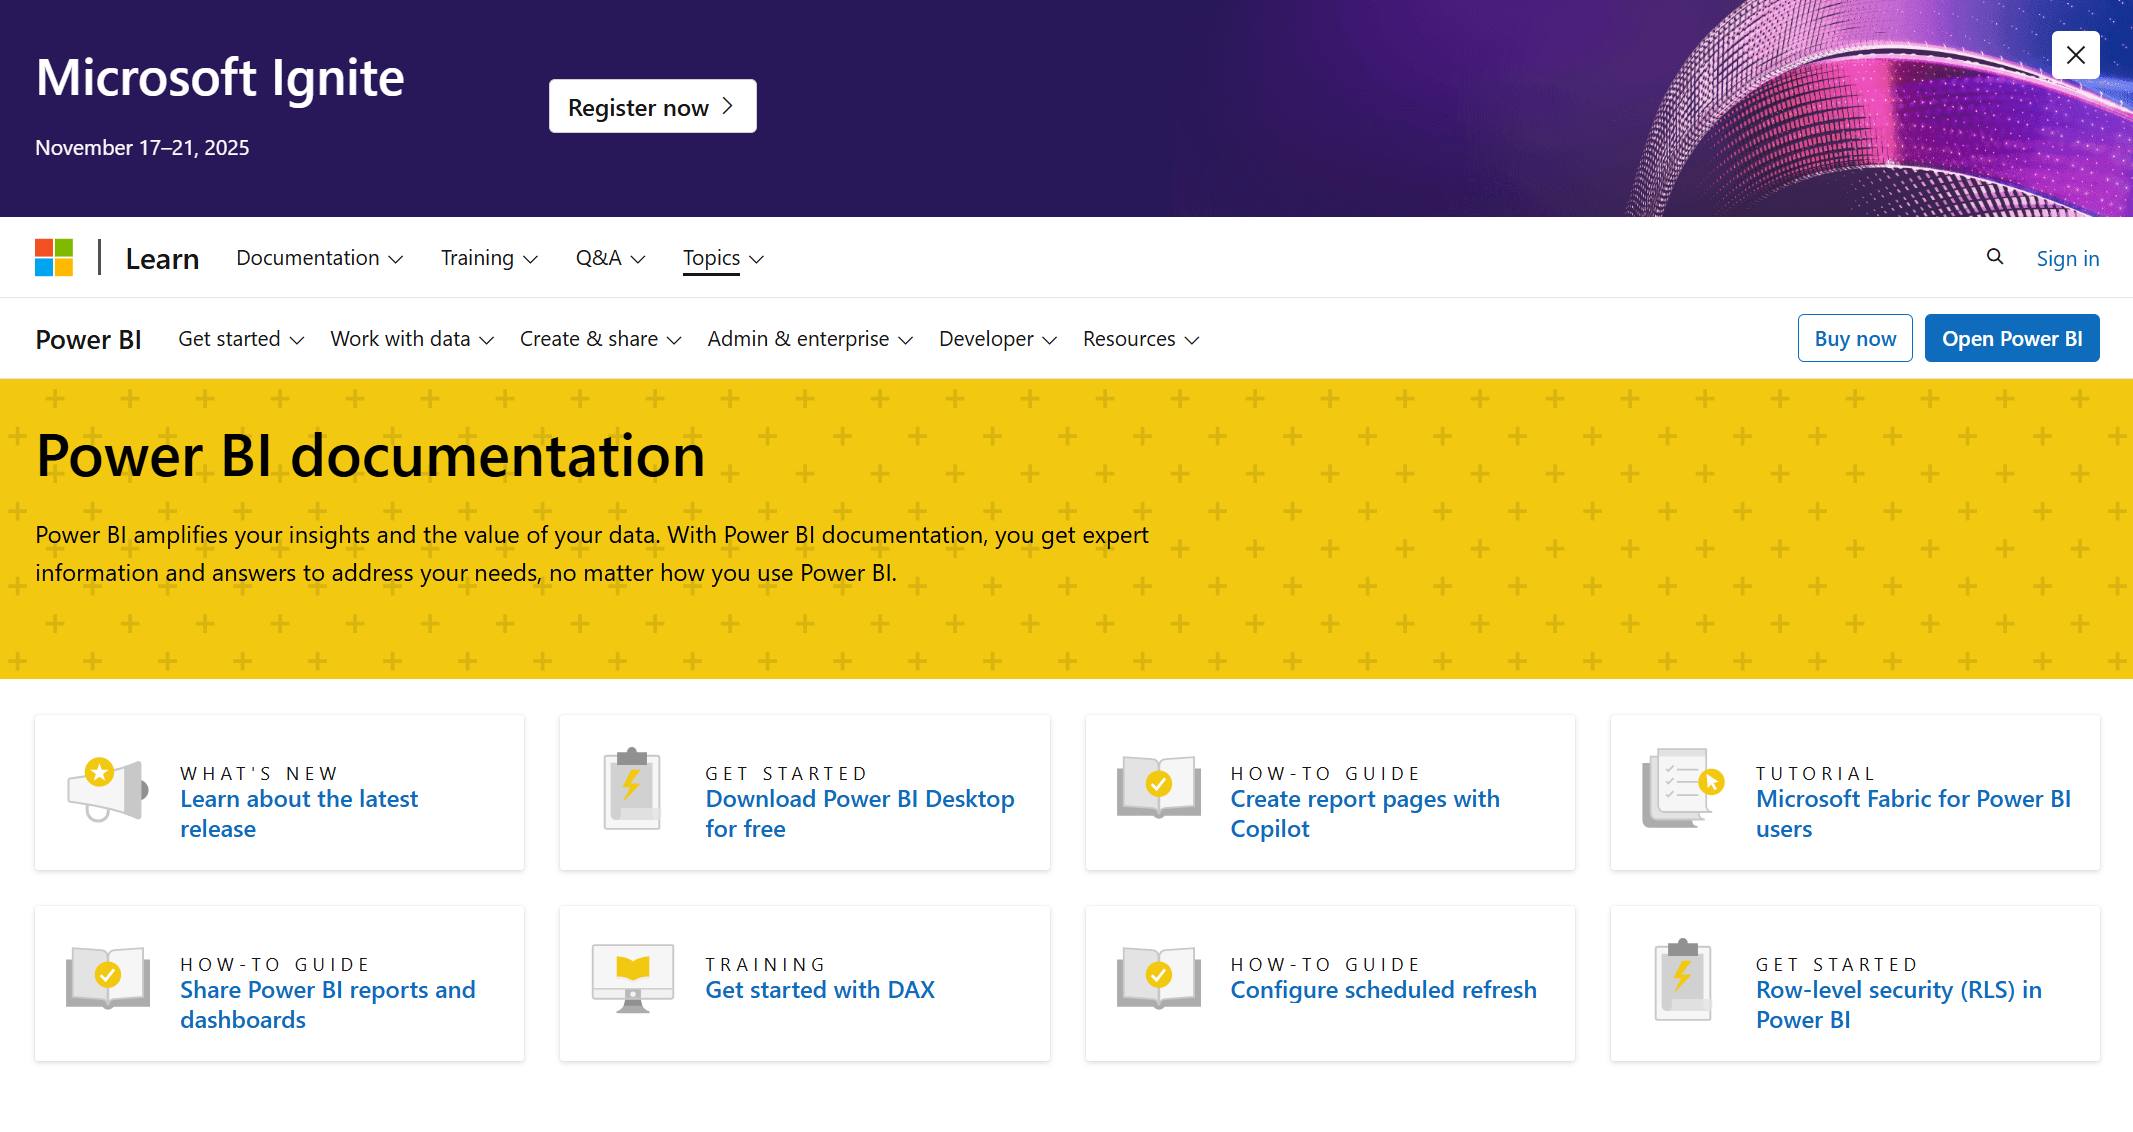
Website: https://learn.microsoft.com/en-us/power-bi/
| Benefit Description |
|---|
| Enhances agility and insights for business decisions. |
| Streamlines reporting with natural language queries. |
| Generates dashboards and visualizations instantly. |
| Highlights key influencers behind trends. |
| Automates report generation, reducing manual effort. |
| Empowers non-technical users to create reports independently. |
Power BI Copilot fits organizations that want self-service analytics and fast data visualization.
3.Google Cloud AutoML Tables
Google Cloud AutoML Tables brings ai tools to industries like healthcare, finance, retail, manufacturing, education, and logistics. You can build machine learning models without coding. Healthcare teams use it for medical image analysis and patient risk prediction. Finance professionals prevent fraud and estimate credit risk. Retailers analyze customer behavior for personalized recommendations. Manufacturers monitor quality and forecast equipment failures. Educators personalize teaching, and logistics companies optimize delivery routes.

Website: https://cloud.google.com/
| Industry | Benefits |
|---|---|
| Healthcare | Medical image analysis, patient risk prediction, drug discovery. |
| Finance | Fraud prevention, credit risk estimation. |
| Retail/E-commerce | Customer behavior analysis, personalized recommendations, demand forecasting. |
| Manufacturing | Quality monitoring, equipment failure forecasting, process optimization. |
| Education | Personalized teaching processes. |
| Transport/Logistics | Delivery route optimization. |
AutoML Tables is perfect if you want to use ai for predictive analytics and data-driven decisions across many sectors.
4.IBM Cognos Analytics
IBM Cognos Analytics gives you automated machine learning and natural language processing. You build predictive models without coding. The platform unifies data silos, so you see your whole operation at once. Real-time updates help you make faster decisions. You get consistent metrics and KPIs across departments. Cognos Analytics learns from your interactions and adapts to your preferences, making analysis more personal.

Website: https://www.ibm.com/products/cognos-analytics
| Feature | Description |
|---|---|
| Automated Machine Learning | Build predictive models without coding. |
| Natural Language Processing | Use conversational language for data queries. |
| Advanced Data Visualization | Create interactive dashboards for clear insights. |
IBM Cognos Analytics works best for enterprises that need unified data visualization and personalized analytics.
5.Qlik Sense AI
Qlik Sense AI uses a powerful analytics engine to uncover hidden connections in your data. The Qlik Associative Engine lets you explore data freely and find fresh insights. Interactive filters and searches update visualizations in real time. Context-sensitive visualizations make analysis intuitive. Qlik Cloud Analytics consolidates data for reliable results. Intelligent notifications alert you to critical changes instantly.
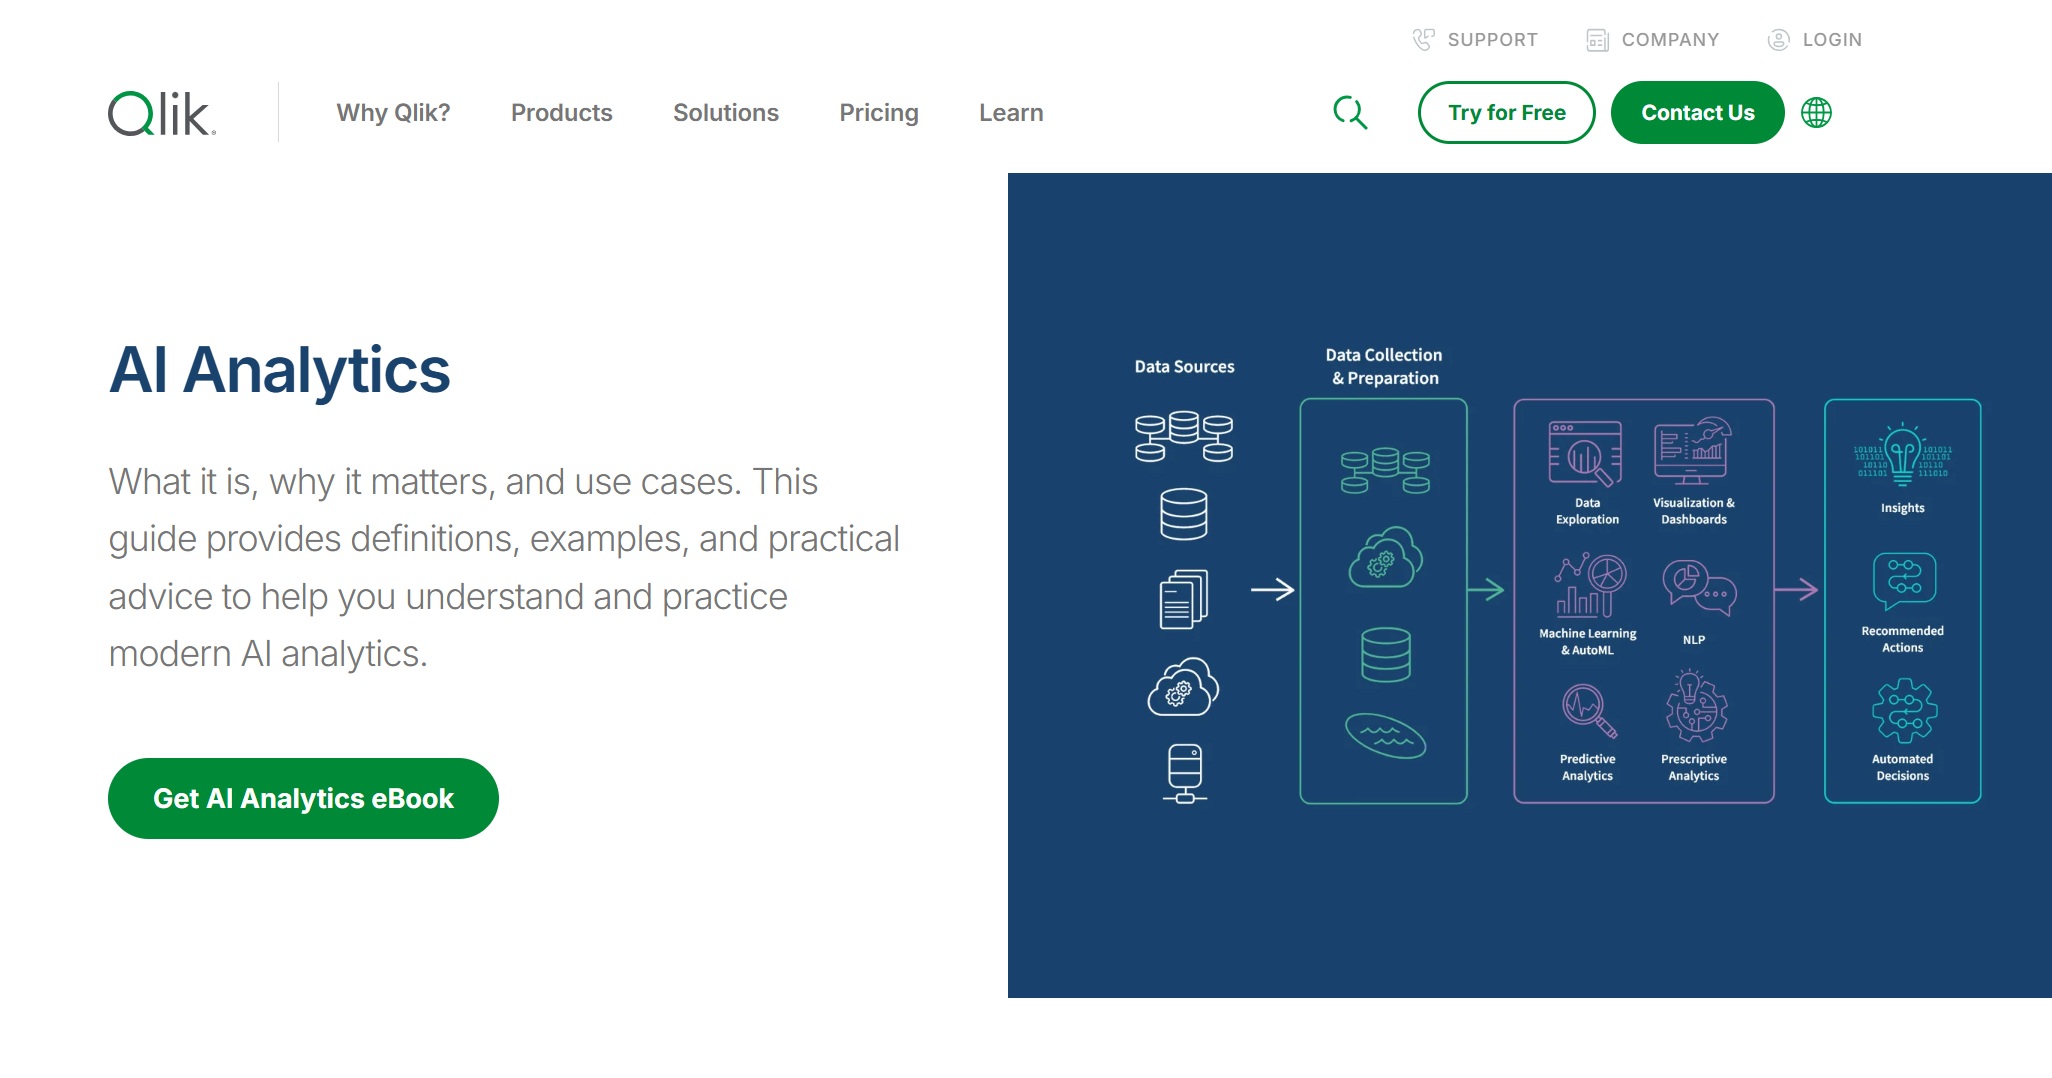
Website: https://www.qlik.com/us/augmented-analytics/ai-analytics
| Feature | Benefit |
|---|---|
| Qlik® Associative Engine | Finds hidden connections for new insights. |
| Interactive filter and search | Updates visualizations in real time. |
| Context-sensitive visualizations | Makes analysis easy and focused. |
| Qlik Cloud® Analytics | Consolidates data for reliable business results. |
| Powerful analytics engine | Indexes data and finds patterns automatically. |
| Intelligent notifications | Alerts you to important changes instantly. |
| Qlik Alerting® | Monitors metrics and notifies users of changes. |
Qlik Sense AI is ideal for businesses that need real-time analytics and flexible data visualization.
6.SAS Viya AI
SAS Viya AI offers high-performance analytics for large-scale data processing. You get in-memory and distributed processing for rapid analysis. Real-time data processing lets you respond quickly to changing conditions. The unified workflow environment streamlines data preparation, modeling, and deployment. SAS Viya AI provides a comprehensive suite of tools for complex analytics and large datasets. It’s a strong foundation for ai-powered applications.
Website: https://www.sas.com/en_us/software/viya.html
| Feature | Description |
|---|---|
| High-Performance Analytics | Fast analytics on big datasets. |
| Real-Time Data Processing | Immediate scoring and streaming data. |
| Unified Workflow Environment | One interface for data preparation, modeling, and deployment. |
SAS Viya AI suits organizations that need advanced analytics and large-scale data analysis.
7.ThoughtSpot Sage
ThoughtSpot Sage makes self-service analytics easy. You ask questions and get instant answers. Matillion saw a 60% adoption rate among employees after switching to ThoughtSpot. Report requests dropped by 80%, freeing up analysts for strategic work. The platform saved over £75,000 annually, showing real operational efficiency.

Website: https://www.thoughtspot.com/product/ai-analyst
- High user engagement and adoption.
- Fewer report requests, more time for strategy.
- Significant cost savings.
ThoughtSpot Sage is great for companies that want fast, easy access to data analysis and visualization.
8.Amazon QuickSight Q
Amazon QuickSight Q lets you interact with your data using natural language queries. You ask questions in simple language and get relevant visualizations automatically. QuickSight Q uses natural language understanding to interpret your questions. You can query data from AWS services and third-party apps. Refine your questions to drill down into details.

Website: https://aws.amazon.com/quicksuite/quicksight/
- Uses natural language understanding for queries.
- Answers questions across multiple data sources.
- Lets you refine questions for deeper analysis.
QuickSight Q is a good choice if you want conversational analytics and instant data visualization.
9.Domo AI
Domo AI brings natural language processing and generative ai to your analytics. You ask questions and get personalized insights. AI model management streamlines operations and optimizes processes. Real-time data insights help you make informed decisions. Automation tools reduce costs and improve resource use. Domo AI also boosts customer experience with personalized recommendations.
Website: https://www.domoai.app/
| Feature | Benefit |
|---|---|
| Natural Language Processing | Personalized insights from your questions. |
| Generative AI | Tailored data experiences. |
| AI Model Management | Streamlined operations. |
| Real-time Data Insights | Dynamic decision-making. |
| Operational Efficiency | Cost reduction and better resource use. |
| Customer Experience | Improved engagement with recommendations. |
Domo AI fits businesses that want automated analytics and enhanced customer engagement.
10.Zoho Analytics AI
Zoho Analytics AI integrates with over 500 data sources, making your data clean and accessible. The platform offers predictive analytics to forecast outcomes. AI-powered insights from Zia provide contextual narratives and auto-generated reports. You interact with data using natural language queries. Diagnostic analytics identify key drivers behind trends and anomalies. Zoho Analytics connects with platforms like Microsoft Teams for better collaboration.

Website: https://www.zoho.com/analytics/zia/
- Seamless data integration with hundreds of sources.
- Predictive analytics for future planning.
- AI-powered insights and automated reports.
- Natural language queries for easy interaction.
- Diagnostic analytics for deeper understanding.
Zoho Analytics AI is perfect for businesses that want integrated analytics and collaborative data visualization.
11.Tableau AI
Tableau AI stands out for its advanced analytics and intuitive data visualization. You get a smart assistant called Tableau Agent that helps you explore data using natural language. Automated anomaly detection flags unusual patterns, so you react quickly. Smart clustering groups users or entities based on trends. Tableau’s natural language processing lets you type questions and get instant insights. The platform even recommends charts and insights, saving you time.
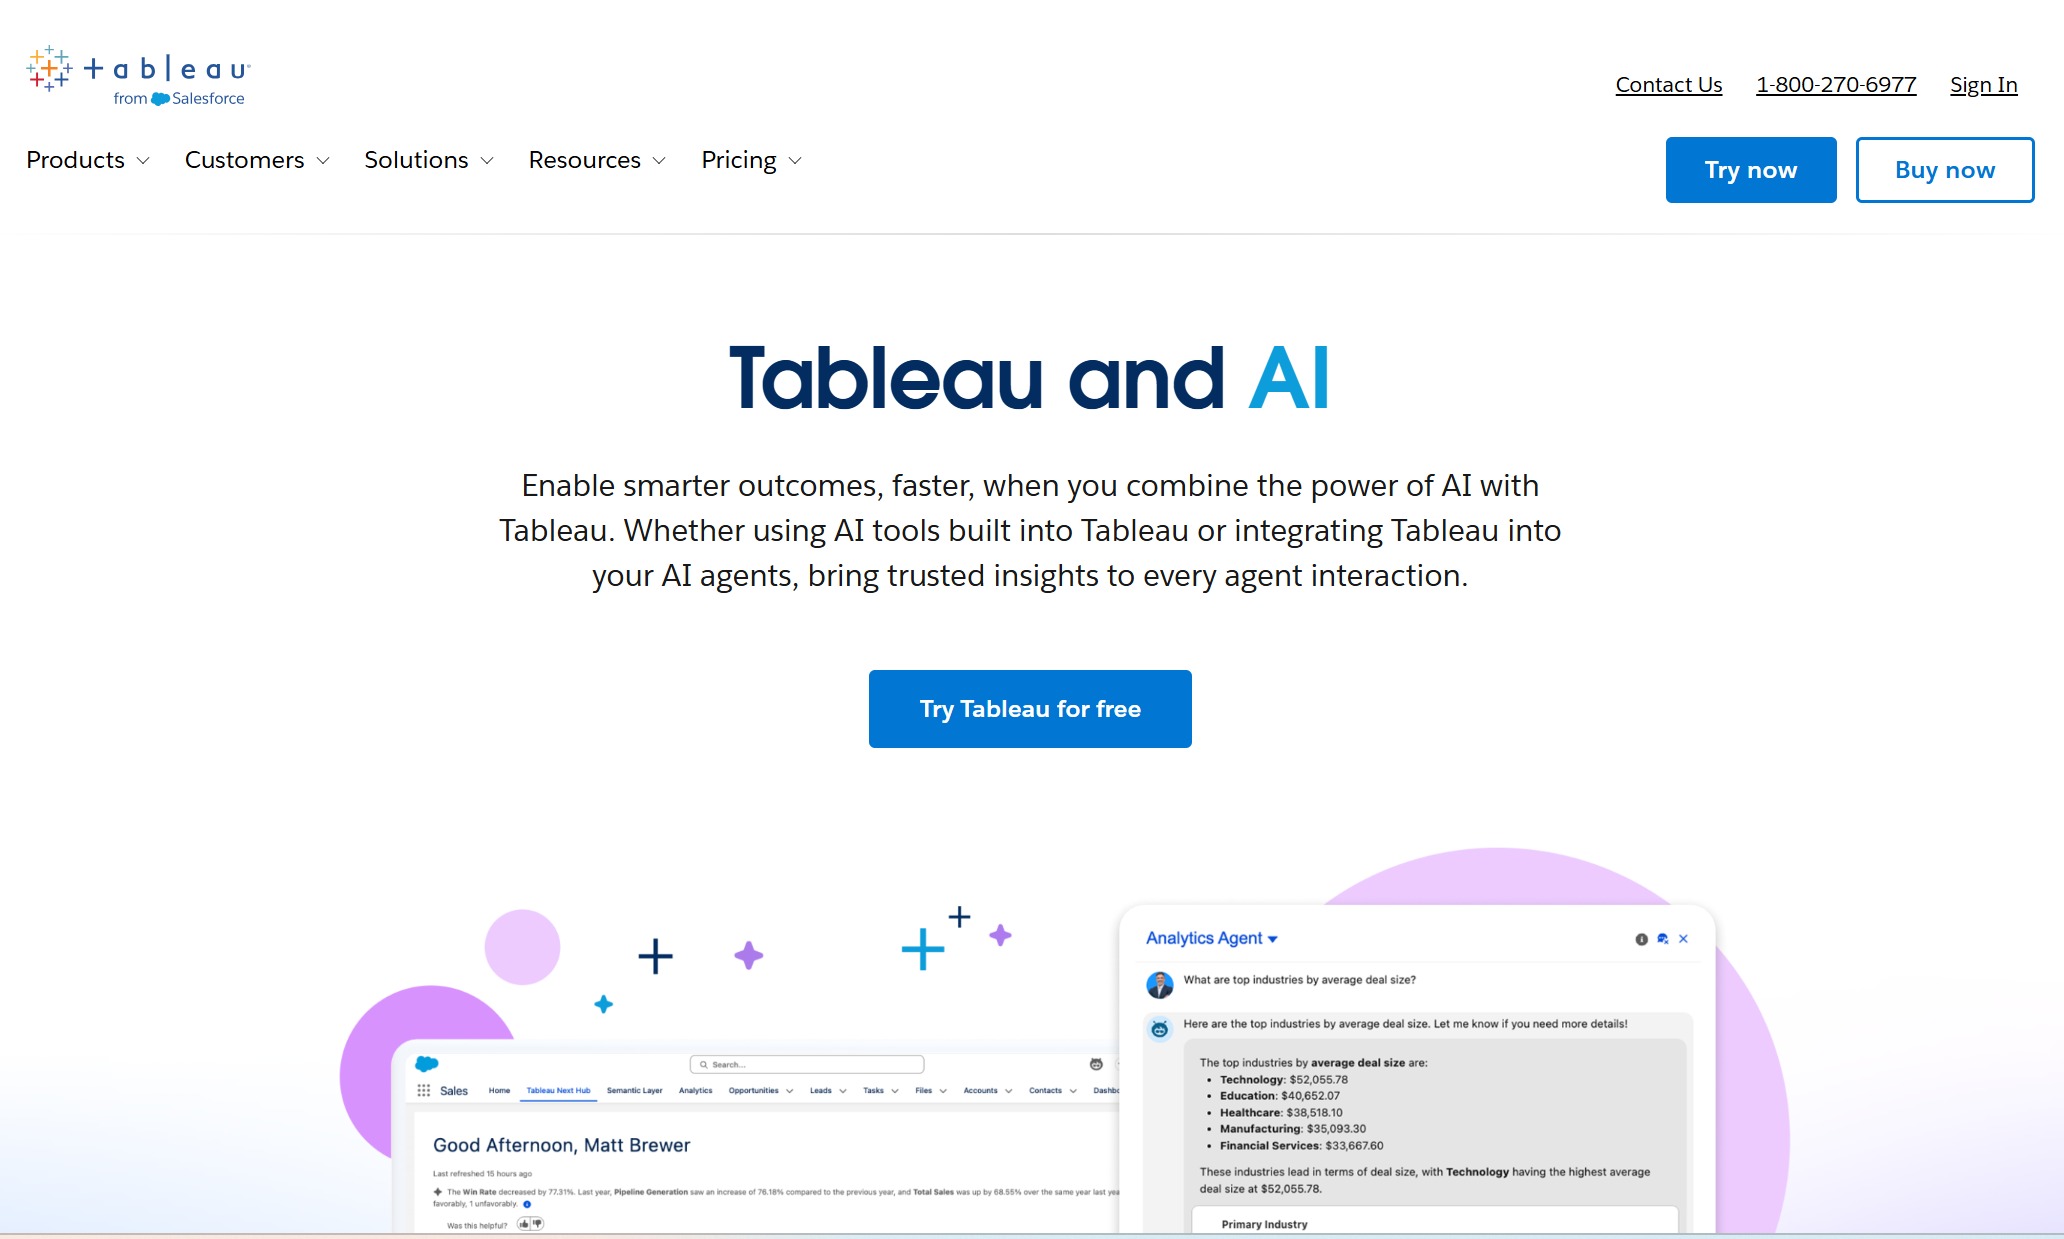
Website: https://www.tableau.com/products/artificial-intelligence
| Feature | Description |
|---|---|
| Tableau Agent | Explore data with natural language. |
| Automated Anomaly Detection | Spot unusual data patterns fast. |
| Smart Clustering | Group users or entities by trends. |
| Natural Language Processing | Ask questions in plain language for relevant insights. |
| AI-Powered Insights Generation | Get chart recommendations based on detected patterns. |
Tableau AI works well for businesses that need strong data visualization and quick analysis across departments.
Features Comparison of Data Analysis Tools

Feature Overview
When you compare analytics platforms, you want to know what sets each one apart. Most ai tools focus on user accessibility, real-time analytics, and advanced analytics features. Some tools, like FineChatBI, stand out with conversational ai and deep data integration. Others, such as Domo and Qlik, offer automation and flexible exploration. Here’s a quick look at the most important features you should check:
- User accessibility for all skill levels
- Real-time analytics capabilities
- Integration options with your current systems
- Advanced analytics tools for deeper analysis
- Conversational ai for easy data interaction
- Automation for reporting and dashboards
You get the best results when your data analytics software combines these features in one place.
Pricing and Value
Pricing for data analytics software can vary a lot. Most enterprise analytics platforms use a subscription model, but some offer usage-based or hybrid pricing. Here’s a simple table to help you compare:
| Pricing Model | Description | Average Cost Range |
|---|---|---|
| Subscription Models | Fixed fee, often tiered by features or usage | $100,000 to $500,000+ annually |
| Usage-Based Pricing | Pay for what you use (API calls, data processed) | Varies based on usage |
| Performance-Based Pricing | Pay based on results (like increased sales) | Varies based on performance |
| Hybrid Models | Mix of different pricing elements | Varies by components |
Small businesses might pay $5,000 to $15,000, while large enterprises can spend over $500,000. You want to balance cost with the value you get from analytics, reporting, and real-time analytics.
Integration Options
You need analytics tools that fit into your existing workflow. The best ai tools offer pre-built connectors for popular apps and databases. Some, like FanRuan, support over 100 data sources and let you build custom connectors. Microsoft Azure AI and Google Cloud AI both integrate with their own cloud services and other enterprise applications. Look for data analytics software that supports:
- Pre-built connectors to common business apps
- Custom connector options for unique systems
- Compatibility with cloud services, databases, and enterprise tools
FanRuan excels in data integration, making it easy to connect all your data for seamless analysis and interactive visualizations.

Ease of Use
You want analytics platforms that everyone can use, not just data experts. Tools like Akkio and Powerdrill offer no-code interfaces, while FineChatBI uses conversational ai so you can ask questions in plain language. Many platforms provide drag-and-drop dashboards and automated reporting. Real-time analytics and interactive visualizations make analysis fast and engaging. When your team finds analytics easy, you get more value from your data.
Tip: Choose analytics tools that make analysis, reporting, and dashboards simple for everyone. FanRuan’s conversational analytics and strong data integration help you get insights quickly and easily.
How to Choose the Right Data Analytics Tool
Assessing Business Needs
You want the right analytics for your business, not just any ai tools. Start by looking at your goals. What do you want to achieve with data? Do you need real-time data analysis or just basic excel data analysis? Here’s a simple way to get started:
- Define your business goals and what you want from analytics.
- Identify your main data sources and check how complex your data is.
- Think about who will use the tools and their skill levels.
- Focus on features like data integration, visualization, advanced analysis, and security.
- Compare popular ai tools for excel and other platforms.
- Make sure the analytics connect with your current systems.
- Check the cost and possible return on investment.
- Read reviews and ask for recommendations.
- Plan for training and smooth implementation.
If you follow these steps, you’ll find analytics that fit your needs and help you make data-driven decisions.
Evaluating Scalability and Performance
Scalability matters when your data grows. You want analytics that keep up with your business. Check how each platform handles performance. Here’s a quick table to help you compare:
| Platform | Performance Metrics | Scalability | User Satisfaction |
|---|---|---|---|
| Platform A | High throughput, Low response time | Excellent | High |
| Platform B | Moderate throughput, Moderate response time | Good | Moderate |
| Platform C | Low throughput, High response time | Fair | Low |
“The BARC Benchmark is designed to compare leading analytics platforms on performance, productivity, and scalability – factors that are becoming critical for user acceptance,” said Thomas Zeutschler, Senior Analyst at BARC.
Tests use hundreds of thousands of simulated user actions. They show how analytics and ai tools for excel perform under pressure.
Considering Budget and ROI
You want analytics that give you value for your money. Look at both upfront and ongoing costs. Don’t forget hidden costs like downtime or missed opportunities. Use the same timeframe to compare costs and returns. Set clear goals and success metrics before you start. Here are some ways to measure ROI:
- Adoption-based ROI looks at how many people use the analytics.
- Data-driven changes ROI measures the impact of decisions made with ai tools.
- Customer satisfaction ROI checks if analytics improve customer happiness.
If you track these, you’ll see how analytics and ai tools help your business grow.
Integration with Existing Systems
Connecting new analytics to your current systems can be tough. Legacy systems may not work well with modern ai tools. You might face technical issues, data fragmentation, or security risks. Integration can cost a lot and sometimes cause downtime. Employees may resist change. Legacy systems may not scale for ai or real-time data analysis. To avoid problems, choose analytics that support many data sources and offer easy integration. This way, you get seamless data-driven decisions and better excel data analysis.
FanRuan Solutions and Success Stories
FineChatBI in Action
You want analytics that work for everyone in your company. FineChatBI gives you a natural language interface, so you can ask questions about your data without needing technical skills. You get answers fast. This tool bridges the gap between business users and IT teams. You don’t have to wait for someone to build a report. You just type your question and get instant analysis. FineChatBI makes querying data simple and accessible. You see trends, spot problems, and make decisions quickly. This boost in accessibility leads to faster decision-making and better operational efficiency. You spend less time waiting and more time acting on insights. FineChatBI supports real-time analytics, so you always work with the latest information.
- You ask questions in plain language and get instant answers.
- You access data from multiple sources for unified analysis.
- You improve operational efficiency with quick decision-making.
Intelligent Inspection for Manufacturing
Manufacturing companies face tough challenges. You need analytics to keep up with quality control and efficiency. FanRuan’s intelligent inspection solution uses ai tools and data analytics to transform inspections. You switch from paper-based records to digital analysis. NFC technology verifies inspection staff and collects data in real time. You spot quality issues faster and reduce waste. The solution helps you meet sustainability goals and improve product quality. You get automated alerts when something goes wrong. This system makes your manufacturing process smarter and more reliable. You use analytics to track trends and optimize operations.
Tip: Digital inspection tools help you save time and resources. You get better data and faster analysis.
Customer Story: UnionPay Data Services
UnionPay Data Services wanted to improve their credit card business. They used FanRuan’s analytics platform to unify their data and boost efficiency. The company faced data fragmentation and slow analysis. With FanRuan, they built a single platform for data visualization and analytics. They identified key areas for growth and improved customer targeting. The system increased operation efficiency by 5%. Customer value identification accuracy reached 90%. UnionPay used analytics to analyze revenue, segment customers, and optimize marketing. You see how powerful data analytics can be for financial services. You get clear dashboards and actionable insights. FanRuan’s business intelligence capabilities helped UnionPay make smarter decisions and grow their business.
You want your business to grow, so you need the right analytics. The best ai analytics tools help you turn data into action. You get real-time analytics, easy data integration, and fast analysis. These platforms make data-driven decision-making simple. Look for analytics with strong features, fair pricing, and smooth integration. You want analytics that everyone can use. FanRuan gives you analytics that connect your data and deliver insights. Try their analytics solutions and see how data can drive your success. Stay curious about analytics trends and keep using data for smarter decisions.


FAQ

The Author
Lewis
Senior Data Analyst at FanRuan
Related Articles

Data Analysis Using AI for Non-Technical Teams: 7 Tools, Real Use Cases, and Key Limits
For non technical teams, $1 means turning business questions into usable answers without waiting in line for SQL queries, dashboard builds, or analyst bandwidth. Marketing managers want campaign answers today, sales lead
Saber Chen
May 29, 2026
AI With Access to Real Time Data: 10 Free Apps Compared for Business Teams in 2026
AI with access to real time data is software that uses live web signals, current business metrics, or connected internal systems to generate answers, insights, and actions based on what is happening now rather than yeste
Saber Chen
Jun 12, 2026

Google AI Sustainability Reporting: How to Build a Workflow Using Google’s Playbook
Google AI sustainability reporting is not just about drafting a better report faster. It is about building a controlled, traceable workflow that helps sustainability leaders, finance teams, legal reviewers, and data owne
Yida Yin
Jun 16, 2026