If you want the best cash flow dashboard templates for 2025, you need solutions that deliver real-time cash flow insights and automate cash flow tracking. Many businesses still rely on fragmented Excel sheets for cash flow reporting, which creates problems such as inaccurate invoices, heavy dependence on manual updates, and poor collaboration.
| Challenge | Description |
|---|---|
| Heavy Dependence on Excel | Frequent reliance on spreadsheets can lead to errors and inefficiencies in cash flow management. |
| Inaccurate Invoices | Manual data entry often results in inaccuracies, causing disputes and delayed payments. |
| Missed Invoices | Fragmented systems can lead to some invoices not being sent, impacting revenue and customer relations. |
| Long Days Sales Outstanding (DSO) | Delays in invoice generation affect cash flow and financial stability. |
| Multiple Sources of Truth | Inconsistent data across systems complicates decision-making and can lead to misinformed strategies. |
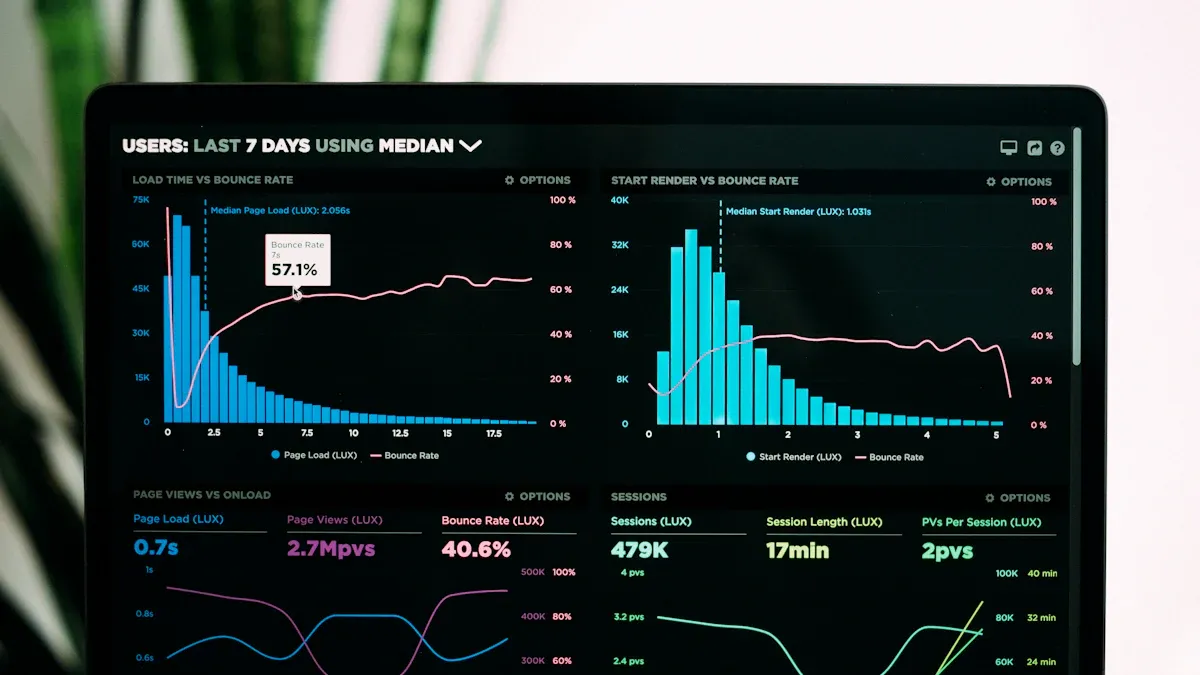
When you switch to a real-time cash flow dashboard, you gain clear visualization of cash flow metrics and cash flow status. FanRuan and FineReport help you automate financial management reporting dashboard, connect banking and ERP systems, and create a custom dashboard for cash flow overview, projections, and executive financial summary dashboard. You get a financial dashboard that simplifies cash flow statement and profit and loss dashboard, making budget planning dashboard and cash management dashboard easier to use.
A modern dashboard gives you cash flow summary, cash flow insights, and a kpi dashboard for projecting monthly cash flow. You can manage finance with a financial dashboard that supports cash flow reporting and helps you make better decisions.
Choosing the right finance dashboard templates can transform how you manage cash flow. You get clear insights, faster reporting, and better decision-making. Here are ten financial dashboard examples that help you track, analyze, and forecast your cash flow with ease.
Website: https://www.fanruan.com/en/finereport
FineReport gives you a real-time cash flow dashboard that centralizes your actual cash position. You see updates from all subsidiaries and bank accounts in one place. You can track both actual and forecasted liquidity, monitor net debt, and analyze variances between actual and forecasted cash. This template is perfect for finance teams who want accurate cash flow reporting and better control over cash flow processes.
| Use Case Description | Details |
|---|---|
| Consolidated actual cash position | Centralized view of cash positions across subsidiaries and bank accounts, updated in real time. |
| Total actual and forecasted liquidity | Displays both actual and forecasted liquidity for accurate reporting. |
| Covenants and net debt management | Monitors net debt and covenant metrics. |
| Variance analysis | Highlights differences between actual and forecasted cash. |
Tip: Use FineReport to automate your financial dashboard template and reduce manual updates.
Website: https://www.fanruan.com/en
FanRuan offers finance dashboard templates that stand out for zero-code development and real-time processing of massive data. You get robust permission management and access to a rich template market. These templates suit IT professionals, BI engineers, and finance managers who need flexible, secure, and scalable financial dashboards.
| Feature | FanRuan Finance Dashboard Template | Other Dashboard Solutions |
|---|---|---|
| Zero-code Development | Yes | Varies |
| Real-time Processing of Massive Data | Yes | Limited |
| Robust Permission Management System | Yes | Varies |
| Rich Template Market Resources | Yes | Limited |
Note: FanRuan templates help you build a finance dashboard that grows with your business.
Website: https://excel.cloud.microsoft/en-us/
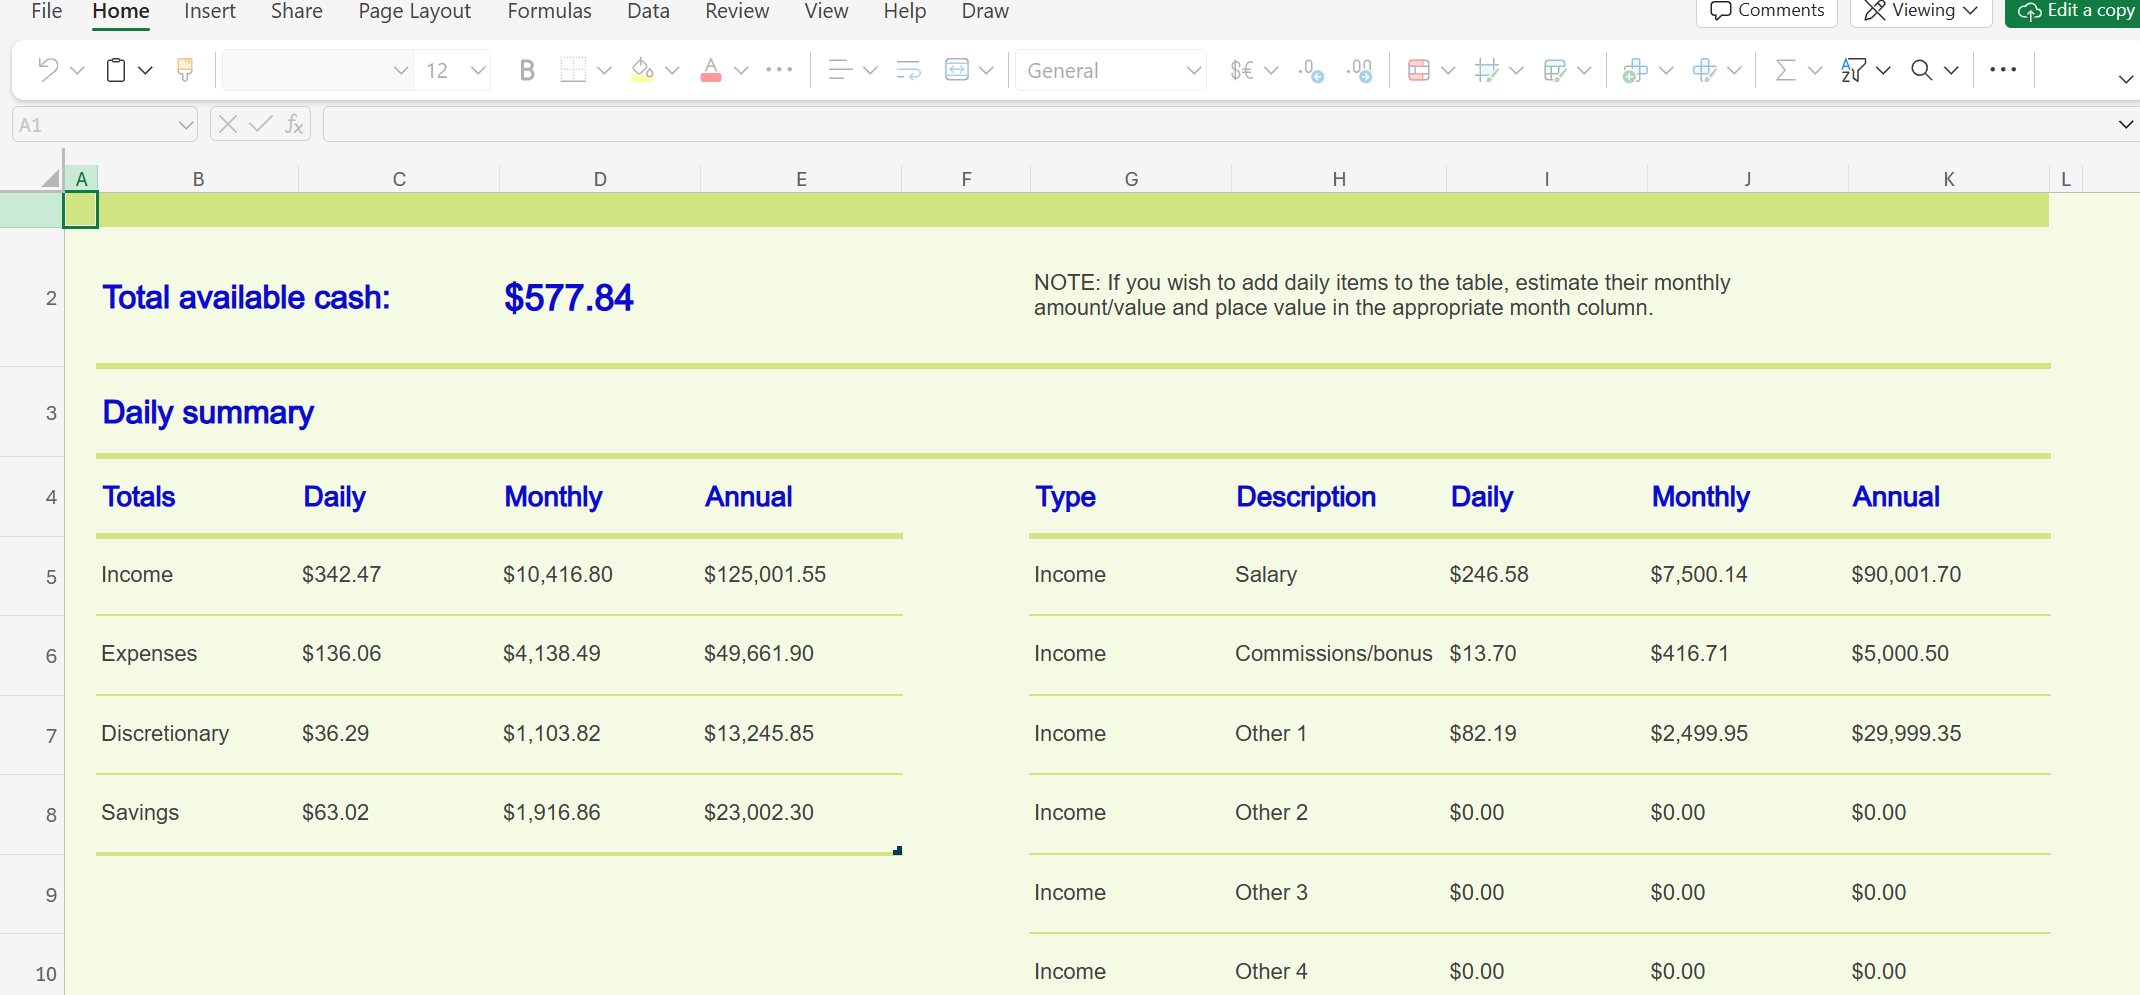
Excel remains a popular choice for finance dashboard templates. You can customize your template to fit your business needs. You get direct visibility into cash movements, but you must update data manually. This template works best for small businesses or teams who want a simple financial dashboard example without automation.
| Feature/Benefit | Excel Cash Flow Statement Template | Automated Solutions |
|---|---|---|
| Ease of Use | High | Varies |
| Customization | High | Limited |
| Real-time Tracking | Manual updates required | Automatic updates |
| Collaboration Features | Requires stakeholder input | Often built-in |
| Insight into Cash Movements | Direct visibility | May require additional tools |
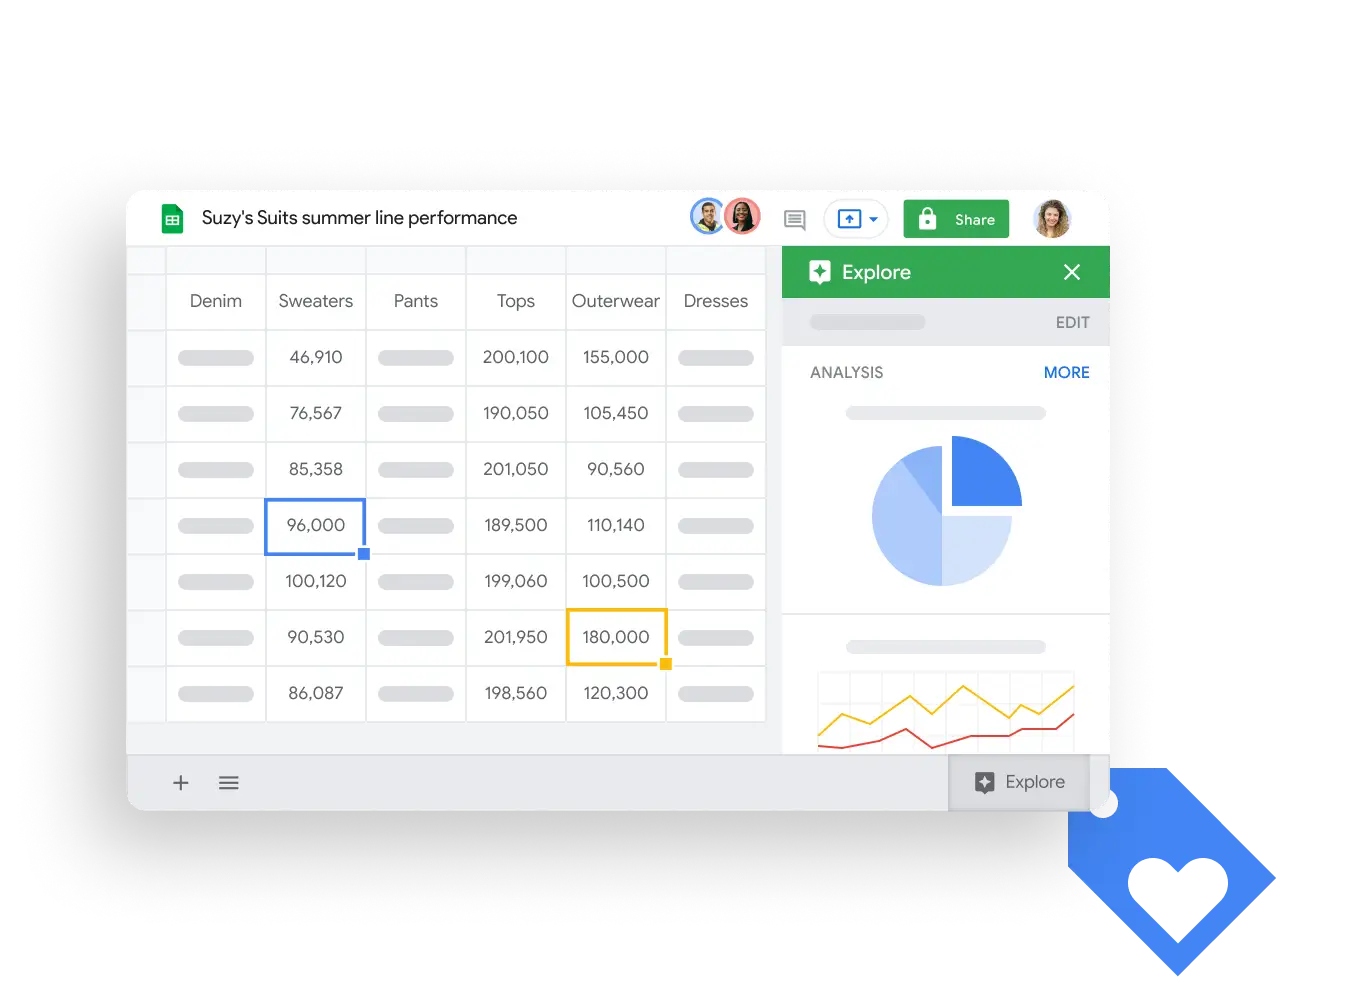
Website: https://workspace.google.com/products/sheets/
Google Sheets templates give you two-way sync and automatic insights push. You can integrate your cash flow dashboard with other Google tools. This template is ideal for small businesses that need easy collaboration and essential integration.
| Feature | Description |
|---|---|
| Two-way sync | Supports two-way synchronization with Google Sheets. |
| Automatic insights push | Pushes insights back to Google Sheets for seamless teamwork. |
| Essential integration | Google Sheets acts as the backbone for small business finance dashboards. |
Website: https://www.microsoft.com/en-us/power-platform/products/power-bi
Power BI templates offer advanced analytics for your cash flow dashboard. You can use machine learning for predictive modeling, statistical forecasting, and scenario planning. You also get automated variance analysis and benchmark comparisons. This template suits finance teams who want deep insights and strategic planning.
| Feature | Description |
|---|---|
| Machine Learning Integration | Predictive cash flow modeling and anomaly detection. |
| Statistical Forecasting | Time series analysis with advanced models. |
| Scenario Planning | What-if analysis for stress testing and planning. |
| Correlation Analysis | Finds relationships between cash flow patterns and business drivers. |
| Variance Analysis | Automated reporting with intelligent insights. |
| Benchmark Comparisons | Industry benchmarking for performance context. |
Website: https://www.tableau.com/
Tableau templates help you simulate financial scenarios and anticipate changes in cash flow dynamics. You can adjust key variables and use strategic foresight tools. This template is great for finance teams who want to plan for different outcomes and improve their financial dashboard examples.
| Feature | Benefit |
|---|---|
| Scenario Planning Tools | Simulate financial scenarios by adjusting variables. |
| Strategic Foresight | Anticipate changes in cash flow dynamics. |
Direct-to-consumer (DTC) templates focus on tracking cash flow metrics for online sales and marketing. You can monitor inflows from e-commerce platforms and outflows for advertising and fulfillment. This template helps DTC brands optimize cash flow reporting and manage growth.
Tip: Use DTC dashboard templates to align your cash flow with marketing and sales strategies.
Cash conversion cycle dashboard templates visualize metrics like days inventory outstanding, days sales outstanding, and days payables outstanding. You see the total time from paying suppliers to receiving cash from customers. This template is ideal for manufacturing companies that want to optimize their cash flow dashboard and improve operational efficiency.
| Metric | Description |
|---|---|
| Days Inventory Outstanding | Average time to sell inventory. |
| Days Sales Outstanding | Average time to collect cash after a sale. |
| Days Payables Outstanding | Average time to pay suppliers. |
| Cash Conversion Cycle (CCC) | Total time from paying suppliers to receiving cash from customers. |
Note: Use cash conversion cycle dashboard templates to spot bottlenecks and speed up your cash flow.
These finance dashboard templates give you the tools to manage cash flow, track financial performance, and plan for the future. You can choose a financial dashboard template that fits your business size, industry, and reporting needs. With the right dashboard, you gain better visibility, faster insights, and stronger financial health.
A cash flow dashboard is a digital tool that helps you track, visualize, and manage your company’s cash flow in one place. You see all your financial dashboard examples, including inflows and outflows, without switching between spreadsheets or systems. The dashboard pulls data from your banking, ERP, and accounting platforms, giving you a clear picture of your cash position. You can spot trends, monitor liquidity, and make decisions faster. The main purpose of a cash flow dashboard is to simplify cash flow reporting and provide instant access to key financial metrics. You use it to check your operating cash flow, forecast future balances, and compare actual results with projections.
Tip: With a cash flow dashboard, you avoid manual errors and gain confidence in your financial decisions.
You need a real-time cash flow dashboard to keep your business healthy and agile. Financial dashboard examples show that automated dashboards save time and reduce mistakes. You no longer spend hours updating spreadsheets or searching for the latest numbers. Instead, you get instant updates and can act quickly.
Imagine you are in a meeting and someone asks about your current cash flow. You open your financial dashboard, and the answer appears in seconds. You make decisions based on facts, not guesses. Financial dashboard examples help you see patterns, spot risks, and plan for growth.
Financial dashboards automate the reporting process, pulling data from various sources and presenting it in an easy-to-understand format. This not only saves time but also reduces the risk of human error, allowing you to focus on making informed decisions based on real-time insights. You use financial dashboard examples to monitor cash flow, analyze trends, and share results with your team. The right dashboard helps you stay ahead in finance and keep your business on track.
You need a real-time cash flow dashboard to keep your business decisions accurate and timely. Real-time data integration gives you up-to-date information that reflects your current financial status. This feature helps you make better decisions because you always see the latest numbers. You also get more precise predictions in cash flow forecasting, which improves your ability to plan ahead.
Customizable visualizations let you tailor your financial dashboard template to your business needs. You can choose which metrics to display and how to present them. Small business templates often come with pre-built metrics, but you can adjust them anytime. Highly visual dashboards make it easy to understand financial dashboard examples at a glance.

Tip: Use charts and graphs to highlight trends and spot issues fast.
Forecasting and scenario planning features help you stay proactive. You compare different scenarios, identify risks, and find growth opportunities. Scenario dashboards provide visual summaries for different stakeholders. Regular updates and discussions foster agility and informed decision-making.
Mobile and cloud access give you flexibility. You can view your dashboard from any device, anywhere. Cloud-first platforms enable seamless collaboration for remote teams. Native mobile apps let you scan receipts, approve bills, and monitor live dashboards on the go.
| Benefit | Description |
|---|---|
| Real-time access | Collaborate and view data from anywhere. |
| Mobile functionality | Complete tasks and monitor financial dashboard examples on your phone. |
Security and permissions protect your sensitive financial data. Password protection keeps your dashboard secure. Page-level permissions control who can view each section, preventing unauthorized access.
Essential features for effective cash flow management include:
You get a finance dashboard that supports your growth, adapts to your needs, and keeps your financial dashboard examples clear and actionable.

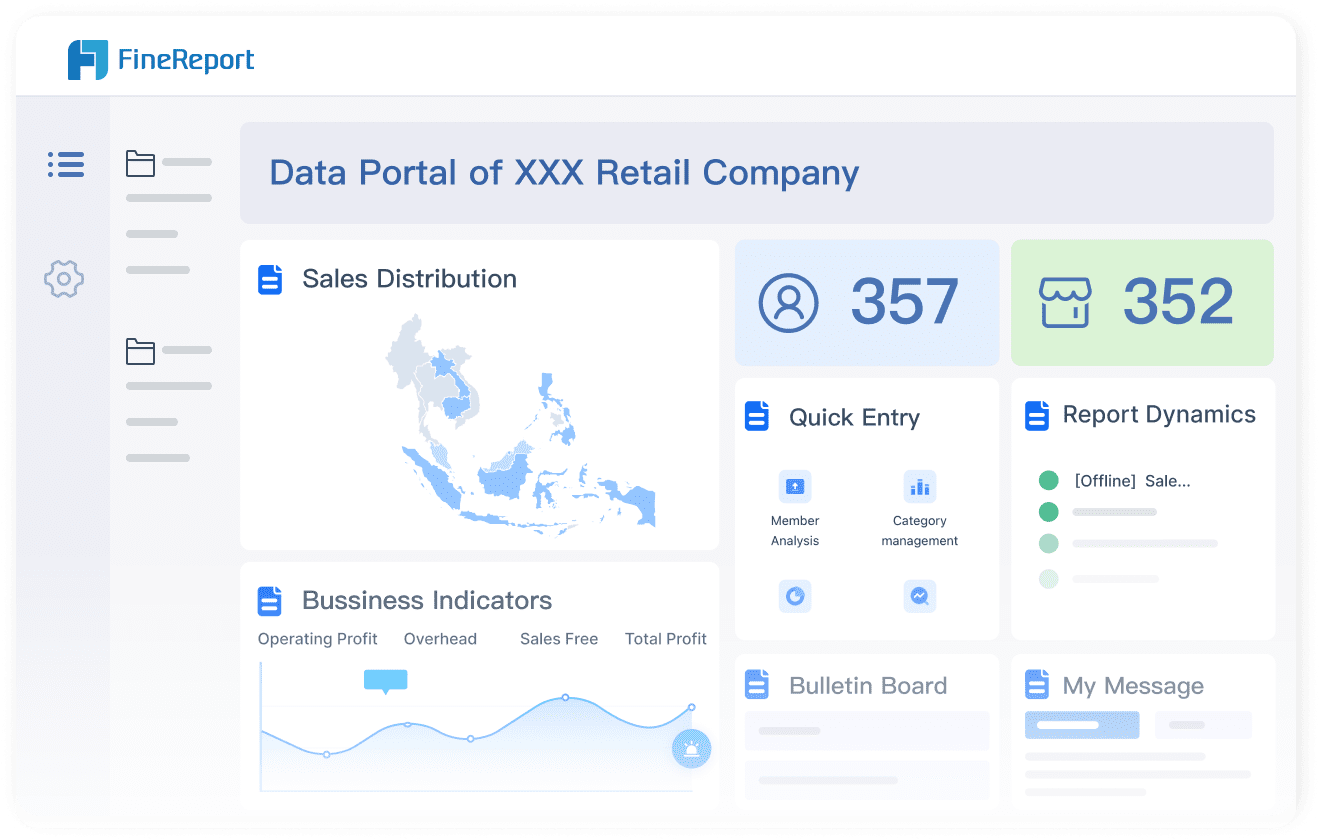
FineReport gives you powerful tools to build a cash flow dashboard that transforms how you manage finance. You see real-time cash flow dashboard updates, automate cash flow reporting, and connect data from every source. You get a financial dashboard template that helps you track, analyze, and forecast your cash position with confidence.
You can automate data aggregation with FineReport. The platform collects and updates financial dashboard examples from all your banking, ERP, and accounting systems. You avoid manual entry and reduce errors. Your dashboard always shows the latest numbers, so you make decisions based on facts. Scheduled tasks let you set up automatic report generation, so your team receives financial dashboard examples on time. You save hours every month and keep your finance dashboard accurate.

FineDataLink makes multi-source integration simple. You connect data from different systems and keep everything consistent. Here’s how FineDataLink improves your financial dashboard examples:
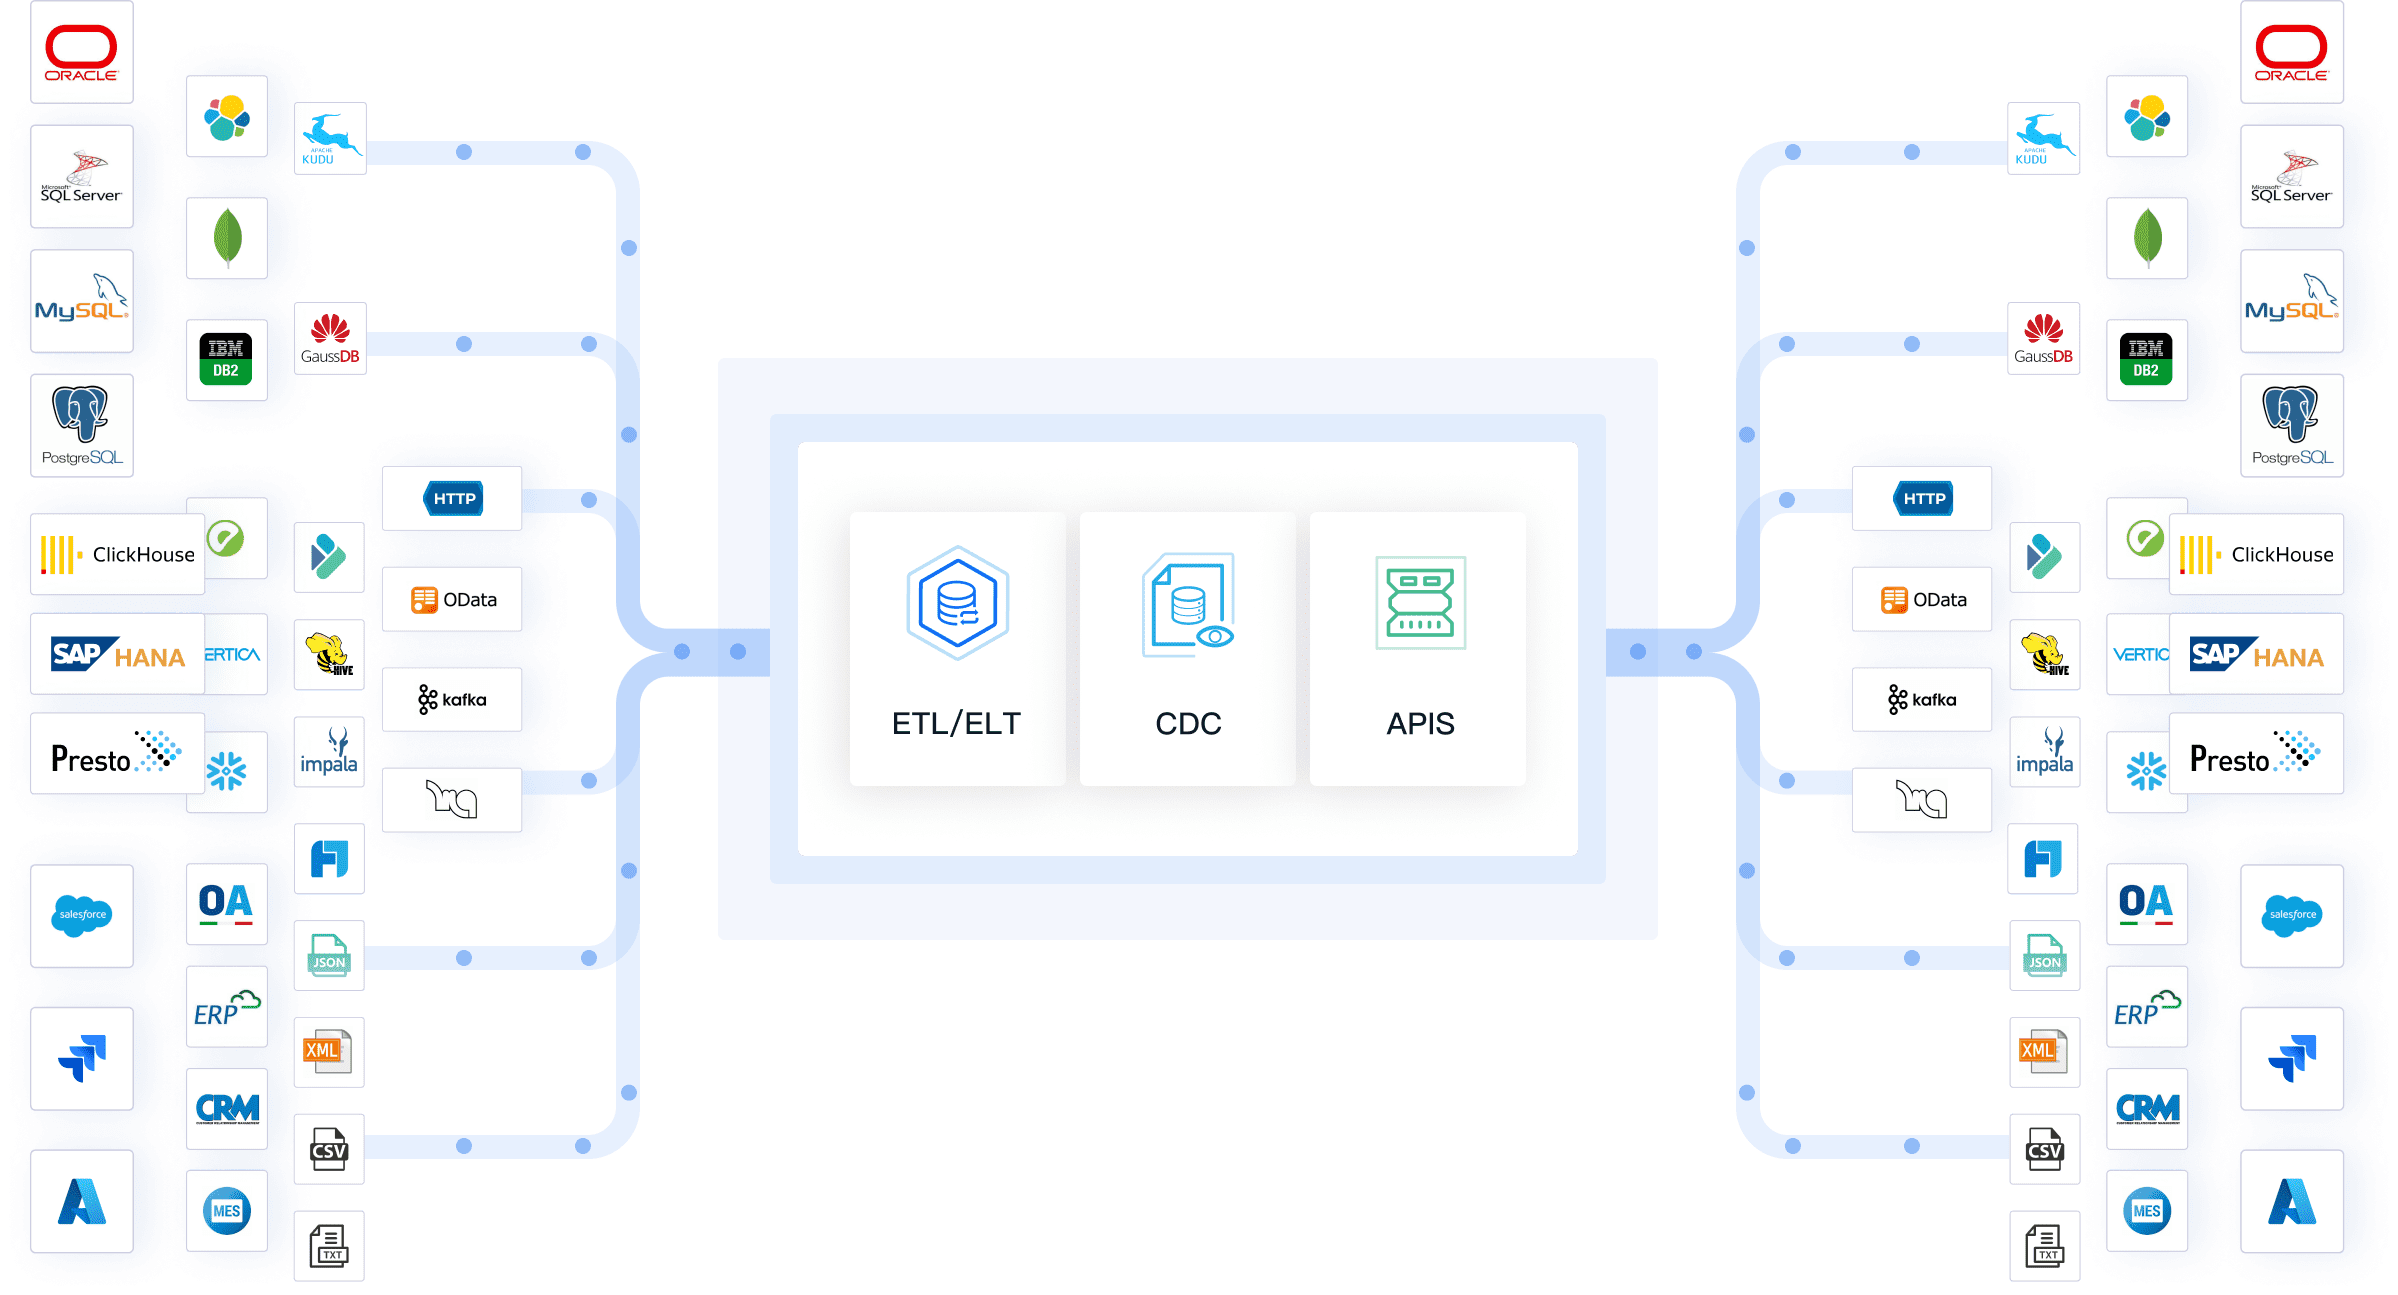
You use these features to build templates that combine banking, sales, and expense data. Your financial dashboard examples become more reliable and easier to understand.
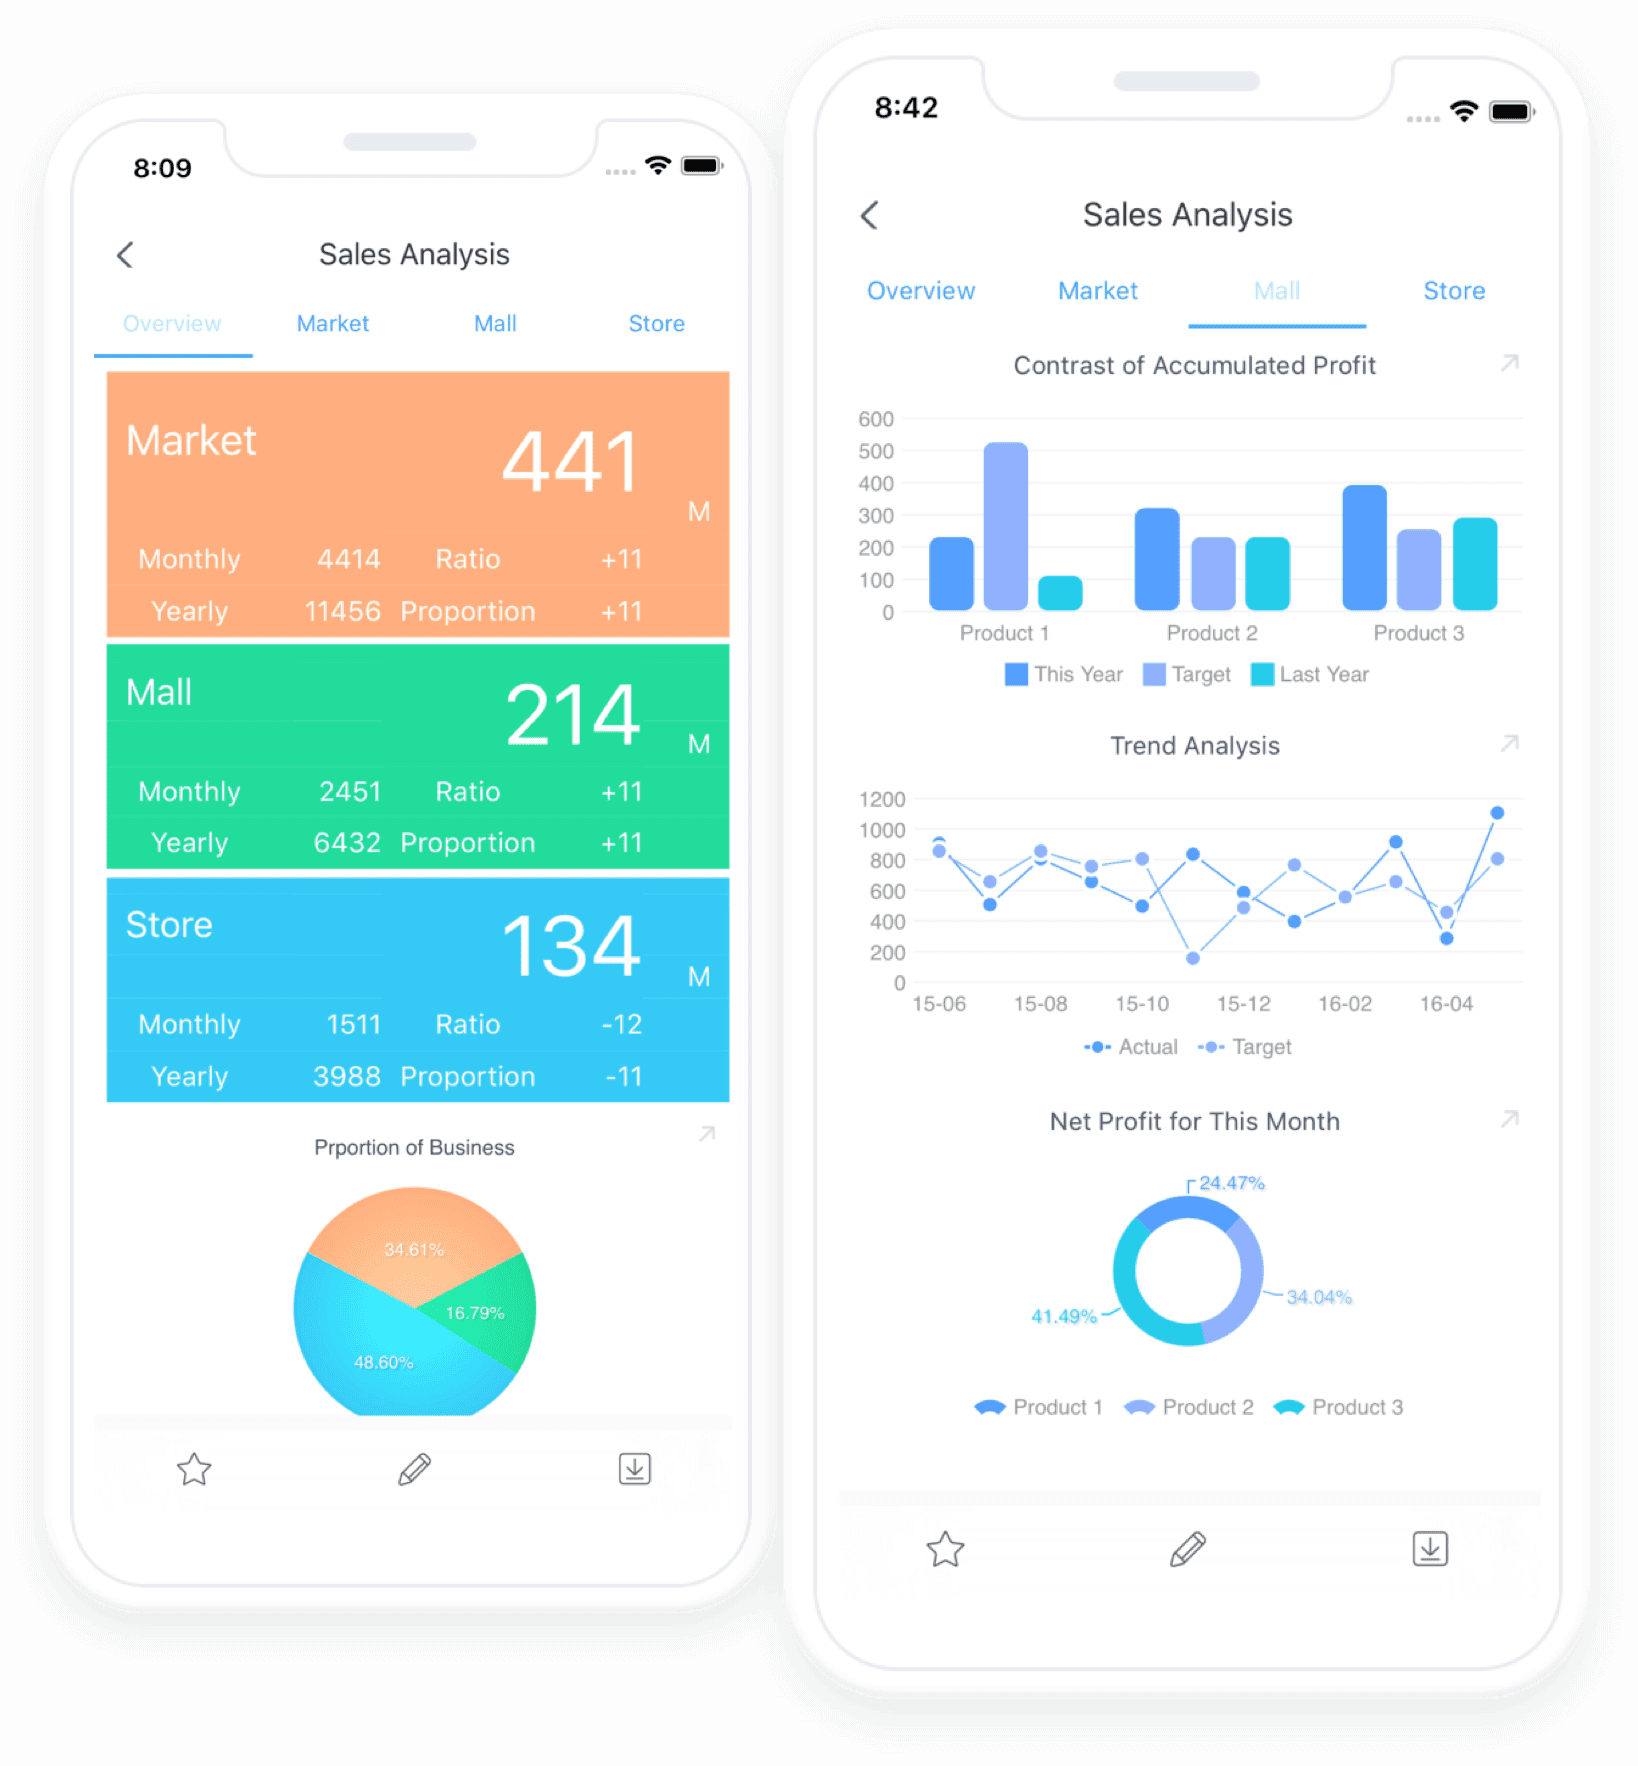
FineReport lets you access your dashboard anywhere. You use mobile-friendly dashboards to check financial dashboard examples on your phone or tablet. Real-time data visualization gives you instant insights, so you respond quickly to changes. You customize reports to fit your needs, making your financial dashboard template clear and relevant.

| Feature | Description |
|---|---|
| Mobile-Friendly Dashboards | Dashboards designed to be accessible and functional on mobile devices, ensuring usability on the go. |
| Real-Time Data Visualization | Provides up-to-date insights into financial metrics, allowing for timely decision-making. |
| Customizable Reporting | Users can tailor reports to meet specific needs, enhancing relevance and clarity in financial management. |
You also use time period controls and filtering options to focus on specific financial dashboard examples. Save and share capabilities help your team collaborate and review templates together.
FineReport supports financial management, risk management, and budget management. You use financial dashboard examples to monitor cash flow, spot risks, and plan budgets. Your finance dashboard adapts to your business, giving you the tools to grow and succeed.

When you choose a cash flow dashboard, you want to see how each template fits your business needs. You can compare features, integration options, and ideal use cases side by side. This table helps you decide which financial dashboard template works best for your finance team.
| Template Name | Main Features | Integration Options | Ideal Use Case |
|---|---|---|---|
| FineReport Real-Time Cash Flow Dashboard | Real-time cash flow dashboard, automated data aggregation, multi-source integration, mobile and 3D dashboards | Connects to banking, ERP, accounting systems, supports FineDataLink for seamless data blending | Large enterprises needing financial dashboard examples with advanced automation and visualization |
| FanRuan Finance Dashboard Template | Zero-code development, robust permission management, rich template market, scalable design | Integrates with multiple data sources, supports real-time processing | IT professionals, BI engineers, finance managers seeking flexible financial dashboard examples |
| Excel Cash Flow Statement Template | Manual updates, customizable layout, direct cash flow reporting | Imports from Excel, limited automation | Small businesses wanting simple financial dashboard examples |
| Google Sheets Cash Flow Dashboard | Two-way sync, automatic insights push, easy collaboration | Integrates with Google tools and Sheets | Teams needing collaborative financial dashboard examples |
| Power BI Cash Flow Dashboard Template | Machine learning, statistical forecasting, scenario planning, automated variance analysis | Connects to accounting, ERP, and cloud data sources | Finance teams focused on predictive financial dashboard examples |
| Tableau Cash Flow Analysis Template | Scenario planning, strategic foresight, interactive visualizations | Connects to databases, cloud platforms | Finance teams planning for multiple financial dashboard examples |
| SaaS Cash Flow Dashboard Template | Logical layout, scenario planning, automated calculations, cloud access | Integrates with SaaS platforms and APIs | Remote teams needing cloud-based financial dashboard examples |
| DTC Cash Flow Dashboard Template | Tracks e-commerce inflows/outflows, aligns with marketing and sales | Connects to e-commerce and marketing platforms | DTC brands optimizing cash flow reporting and financial dashboard examples |
| CFO KPI Dashboard Template | Centralizes KPIs, monitors operating cash flow, cash conversion cycle, working capital | Integrates with finance and ERP systems | CFOs needing executive-level financial dashboard examples |
| Cash Conversion Cycle Dashboard | Visualizes CCC metrics, tracks inventory, sales, payables | Connects to manufacturing and finance systems | Manufacturing companies improving operational financial dashboard examples |
Tip: Use this table to match your business needs with the right financial dashboard examples. You can see which dashboard offers the features and integrations that matter most for your finance goals.
You get a clear overview of each template. You can focus on real-time cash flow dashboard options if you want instant updates. You can select templates with strong automation for faster cash flow reporting. You can find financial dashboard examples that support your team’s workflow and help you make better decisions.
Selecting the right cash flow dashboard template helps you manage your business finances with confidence. You need to match your dashboard to your company’s goals, systems, and growth plans. Here’s how you can make the best choice.
Start by listing what your business needs from financial dashboard examples. You want a dashboard that supports your team and fits your workflow. Use the table below to compare important criteria:
| Criteria | Description |
|---|---|
| Audit Logs | Track changes and access history for accountability. |
| Collaboration | Enable team members to work together on cash flow reporting. |
| Model-Based Data Integration | Integrate data from various sources for comprehensive analysis. |
| Scalability | Make sure the solution can grow with your business. |
| Personnel Planning | Manage workforce costs and resources. |
| Accounts Receivable Management | Track incoming payments and customer invoices. |
| Accounts Payable Management | Monitor outgoing payments and supplier invoices. |
| Trend Analysis and Reporting | Analyze historical data to forecast future cash flow trends. |
| Seasonality | Account for seasonal changes in cash flow. |
Tip: Review your business processes and choose financial dashboard examples that cover your most important metrics.
Your dashboard should connect easily with your current finance and accounting software. This saves you time and keeps your data accurate. Look at these integration steps and benefits:
| Integration Steps | Benefits |
|---|---|
| Connect dashboard directly to financial systems | Reduces manual data exports |
| Use software suites that combine data securely | Ensures accurate and real-time data analysis |
| Set up seamless integrations with platforms | Provides a true real-time view of financial health |
You get a real-time cash flow dashboard when your template links to systems like QuickBooks or NetSuite.
As your business grows, your dashboard must adapt. You need financial dashboard examples that let you create custom metrics and scale with your team. Consider these factors:
| Factor | Description |
|---|---|
| Customization | Easy interface for creating custom metrics and reports. |
| Scalability | Cloud-based systems that grow with your business and flexible user management. |
| Data Integration | Dashboards pull data from accounting and CRM platforms. |
| Visualization Tools | Use platforms that offer real-time insights with clear visuals. |
| Business Goals | Dashboards should reflect your specific goals, like monthly recurring revenue. |
Note: Choose templates that let you adjust financial dashboard examples as your needs change.
Pricing models for dashboard templates vary. Some providers offer tiered plans, while others give custom quotes. Compare options to find what fits your budget:
| Tool | Pricing Model |
|---|---|
| Limelight | Starts at $1,400/month |
| Cube | Custom quote |
| Vena | Tiered plans |
| Workday Adaptive Planning | Custom quote |
| Datarails | Custom quote |
| Anaplan | Custom quote |
| Prophix | Custom quote |
| Jedox | Custom quote |
| Planful | Custom quote |
You want a finance dashboard that delivers value without straining your budget. Always check what features come with each plan and how they support your financial dashboard examples.
Setting up a real-time cash flow dashboard helps you gain control over your company’s finances. You need to follow proven steps to get the most value from your financial dashboard examples.
Start by defining the key metrics you want to track. Focus on cash position, cash flow, receivables, payables, and projections. Connect your dashboard to all important data sources. These include accounting software, bank feeds, and forecasting models. Set clear goals using KPIs such as working capital ratio, revenue growth rate, and cash runway. Choose visuals that make trends easy to spot. Use line charts, waterfall charts, and heat maps to highlight insights. Automate updates so your dashboard always shows the latest numbers. Schedule weekly reconciliations to keep your data accurate.
Tip: Use templates to speed up your setup. Many financial dashboard examples come with built-in visuals and metrics.
You should review your financial dashboard examples on a regular basis. Weekly reviews help you catch issues early. Look for changes in cash flow, unexpected expenses, or delayed receivables. Update your template as your business grows. Add new metrics or remove ones that no longer matter. Regular updates keep your finance dashboard relevant and useful.
Involve your team in the dashboard process. Ask finance, operations, and management to give feedback on your financial dashboard examples. This helps you spot gaps and improve the dashboard’s usefulness. Share the dashboard with key decision-makers. Use it in meetings to guide discussions about cash flow and financial health. When everyone understands the numbers, your business can act faster and smarter.
Note: A collaborative approach ensures your real-time cash flow dashboard meets everyone’s needs.
You gain better control over your financial health when you use a modern cash flow dashboard. A strong template helps you track and forecast your finance dashboard with ease. FanRuan and FineReport give you tools to build a financial dashboard that fits your business. Review the comparison table, start a trial, or talk to a finance expert. Proactive dashboard management supports your business growth.
Ready to master your company’s liquidity and secure your financial future? Click the banner below to start your FREE trial of FineBI and take control of your cash flow today!
How an AP Dashboard Optimizes Your Working Capital
What Makes an AR Dashboard Essential for Modern Finance Team
Profit and Loss Dashboard Made Easy for Beginners
Mastering Client Dashboards: A Complete Guide to Transform Data into Actionable Business Insights

The Author
Lewis
Senior Data Analyst at FanRuan
Related Articles

Payment Analytics Dashboard: 12 KPIs Every Operations Leader Should Track to Cut Revenue Leakage
Losing revenue to declines? Discover 12 essential KPIs to track in your payment analytics dashboard to stop leakage and manage disputes.
Lewis Chou
May 05, 2026

SOC Dashboard Explained: 12 Essential KPIs, Views, and Workflows Security Teams Use
Learn about SOC dashboards, the 12 essential KPIs for security teams, and how they centralize alerts and workflows for faster threat detection and response.
Lewis Chou
May 05, 2026

EMR Dashboard Guide: 12 Metrics to Track for Faster Clinical and Operational Decisions
Learn the 12 essential EMR dashboard metrics to track for faster clinical and operational decisions, improving patient flow and revenue cycle management.
Lewis Chou
May 05, 2026


