Did you know most finance teams still struggle with outdated spreadsheets and slow reporting cycles? If you want to keep up, you need financial data analysis tools that actually work for you. Top picks like FineBI, FineReport, Power BI, Tableau, and Qlik Sense help you tackle issues like disconnected planning, poor data accessibility, and long reporting times. These tools make it easier to see what drives your business, boost accuracy, and speed up decisions. The finance world is transforming fast—choosing the right tools is how you stay ahead.
When you hear the term financial data analysis tools, you might picture complicated dashboards or endless spreadsheets. In reality, these tools are software solutions that help you collect, organize, and analyze financial data from different sources. They turn raw numbers into clear insights, making it easier for you to spot trends, manage risks, and make smart business decisions.
Financial data analysis tools are essential for any finance team that wants to move beyond manual processes. Instead of spending hours on repetitive tasks, you can use these tools to automate reporting, visualize key metrics, and collaborate with your team in real time. The right financial analysis software will help you improve accuracy, save time, and respond quickly to changes in your business.
Below, you’ll find a list of the most important financial data analysis tools. Each one brings something unique to the table, whether it’s self-service analytics, advanced reporting, or seamless integration with other business systems.
Tip: Choosing the right tool depends on your team’s needs, the complexity of your data, and how much control you want over reporting and analysis.

FineBI stands out as a self-service business intelligence platform designed for business professionals and data analysts. You can connect to a wide range of data sources, including big data platforms, relational databases, and Excel files. FineBI’s drag-and-drop interface makes it easy for you to build dashboards and reports without writing code. The OLAP analysis feature lets you explore data from different angles, drill down into details, and spot trends quickly.
FineBI is especially useful if you want to empower your team to analyze data independently. With real-time analysis and role-based access control, you can ensure that everyone sees the right information at the right time. Many organizations choose FineBI because it boosts efficiency and helps teams make faster, data-driven decisions.
| Tool | Target Users | Key Features |
|---|---|---|
| FineBI | Business professionals, data analysts | Self-service BI, OLAP analysis, user-friendly interface |
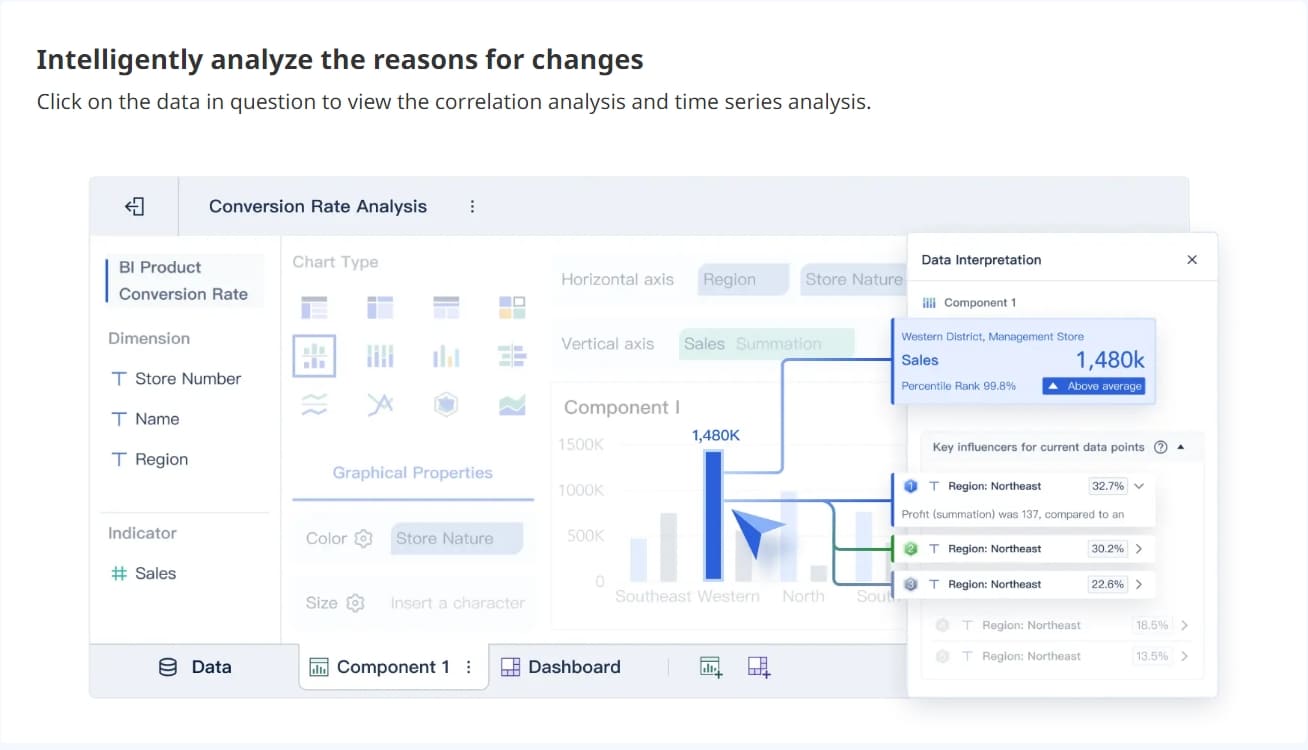
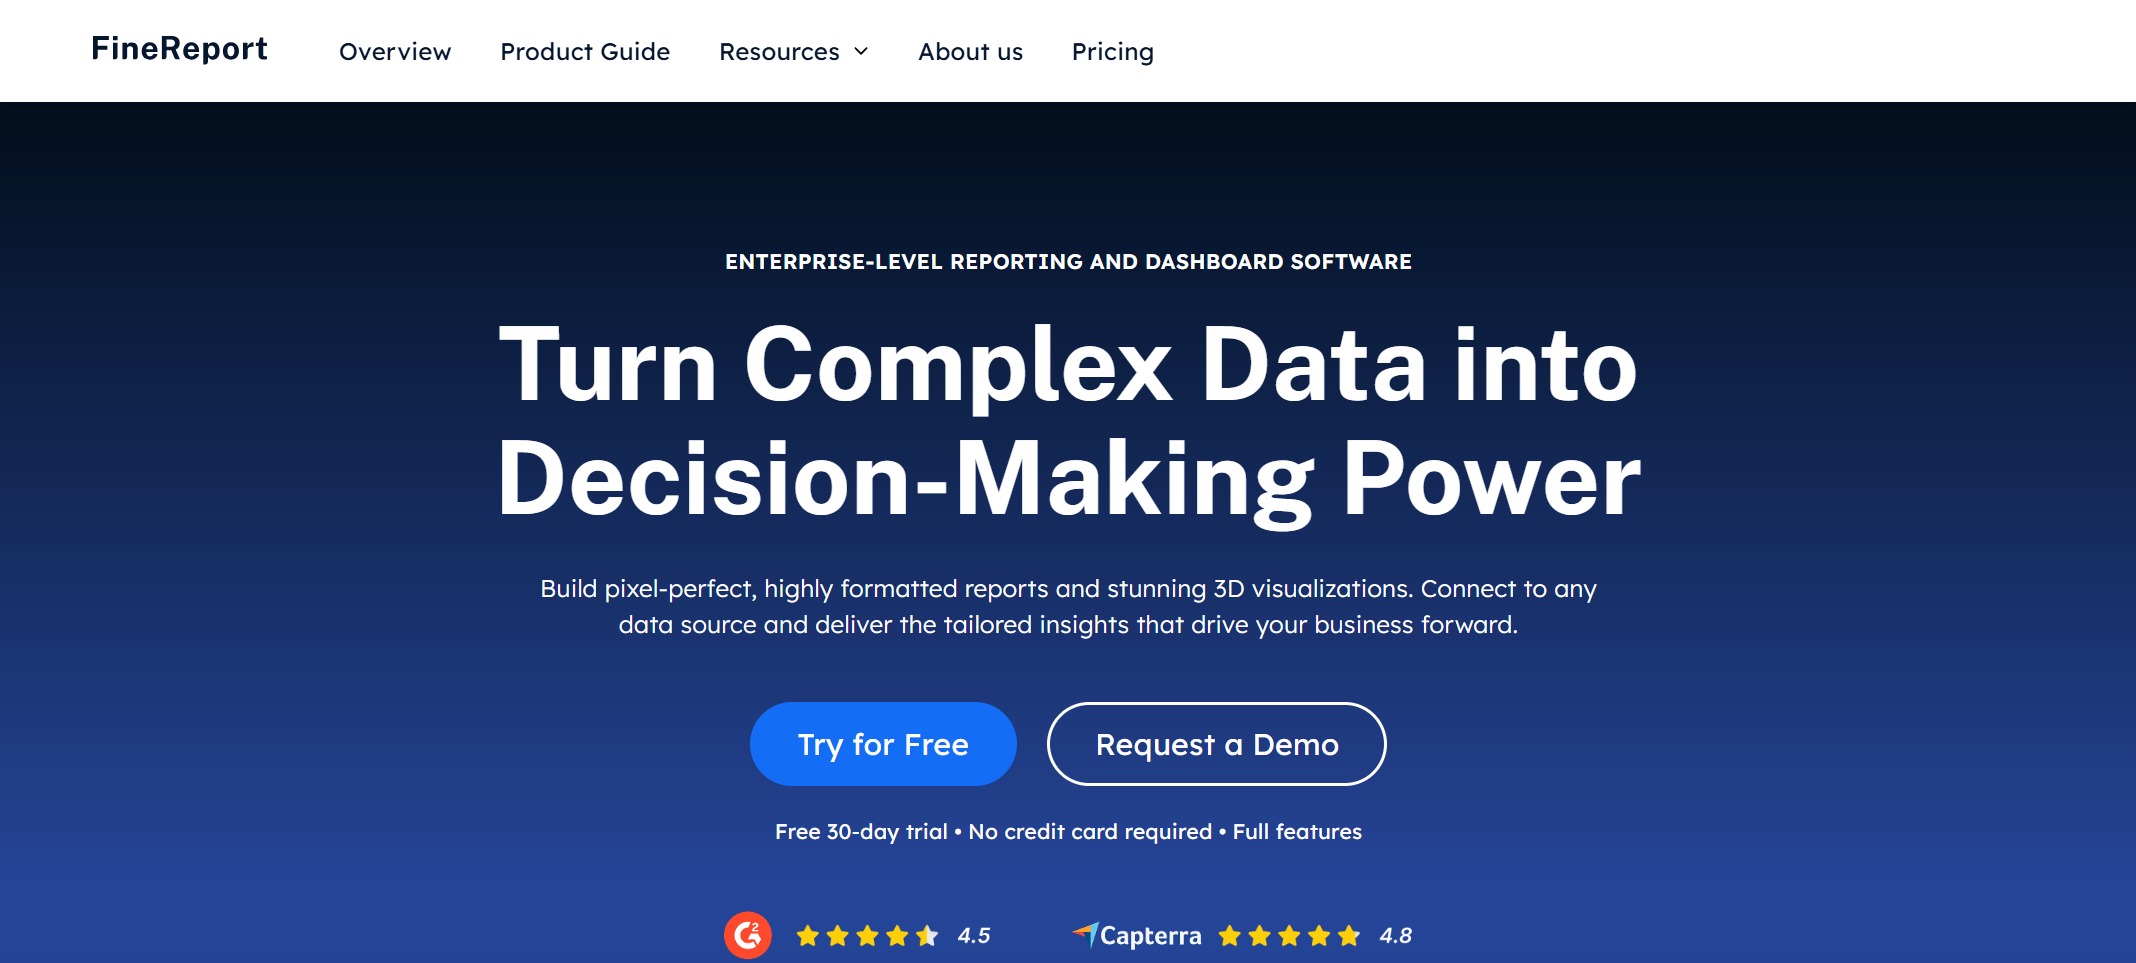
FineReport is a flexible reporting and dashboard tool aimed at IT specialists and report developers. If you need to create pixel-perfect reports or complex dashboards, FineReport gives you the control you want. Its Excel-like interface makes it easy to design custom reports, automate scheduled tasks, and integrate data from multiple sources.
You can use FineReport to automate regular financial reporting, manage permissions, and collaborate across departments. The tool supports advanced visualization, mobile access, and real-time data entry, making it a strong choice for organizations with complex reporting needs.
| Tool | Target Users | Key Features |
|---|---|---|
| FineReport | IT specialists, report developers | Advanced reporting capabilities, Excel-like interface |
Microsoft Power BI is one of the most popular financial data analysis tools worldwide. You can connect it to almost any data source, from cloud databases to Excel files. Power BI’s integration with the Microsoft ecosystem makes it a favorite for organizations already using Office 365 or Azure.
If you want a tool that combines powerful analytics with familiar interfaces, Power BI is a solid choice.
Tableau is known for its easy-to-use visualization features. You can quickly connect to large data sources and build interactive dashboards. Many finance teams use Tableau to create clear, effective reports that help managers and executives understand complex financial data.
Qlik Sense offers a unique associative data model that lets you explore data in a non-linear way. You’re not limited to pre-set paths or filters. Instead, you can ask unexpected questions and analyze data from different perspectives.
SAP Analytics Cloud is a cloud-based platform that brings together financial, supply chain, and operational planning. You get real-time access to data through live connections with SAP S/4HANA and SAP Datasphere. This tool centralizes performance management and data models, reducing file clutter and ensuring everyone works from a single source of truth.
| Evidence Description | Impact on Financial Reporting Efficiency |
|---|---|
| Real-time data access through live connections | Enhances decision-making and reporting processes by providing immediate insights. |
| Collaborative planning | Breaks down silos, aligns budgets, and improves overall efficiency in reporting. |
| Centralization of performance management | Reduces file proliferation and ensures a single source of truth for stakeholders. |
| Automated reporting and financial analysis | Streamlines performance reviews and enhances the efficiency of financial reporting. |
Oracle Analytics is a comprehensive platform that helps finance teams monitor KPIs, create reports, and visualize data. You can access real-time insights, set up automated alerts, and build interactive dashboards. Oracle Analytics supports self-service analytics, so you don’t need to rely on IT for every report.

Sage Intacct is a cloud-based financial management tool that supports real-time reporting and automation. You can automate report generation, which saves time and reduces manual errors. Finance leaders can access reports on demand, making it easier to review performance whenever needed.
Anaplan is a powerful platform for financial planning and analysis. You can use it for budgeting, forecasting, revenue planning, and more. Anaplan supports integrated financial statements, long-range planning, and specialty finance processes.
| Use Case |
|---|
| Financial Planning & Analysis |
| Planning, Budgeting & Forecasting |
| Revenue Planning |
| Operating Expense (OpEx) Planning |
| Capital Expenditure (CapEx) Planning |
| Headcount Expense Planning |
| Integrated Financial Statements |
| Long-Range Planning |
| Specialty Finance Processes |
| Product & Customer Profitability |
| Gross-To-Net Planning |
| Rolling Forecasting |
| Management Reporting & Analytics |
| Consolidation & Reporting |
Planful automates financial planning and reporting, helping you focus on strategic tasks. The platform uses AI-driven tools to minimize errors and improve accuracy. You can collaborate with other departments, track key metrics, and make better decisions with real-time data.
| Measurable Outcome | Description |
|---|---|
| Improved Efficiency | Automation reduces manual processes, allowing finance teams to focus on strategic tasks. |
| Enhanced Accuracy | AI-driven tools minimize errors in financial reporting and forecasting. |
| Strategic Decision-Making | Access to real-time data and insights supports better-informed decisions across the organization. |
| Increased Collaboration | Modern tools facilitate teamwork between finance and HR, aligning goals and resources effectively. |
| Better Tracking of AI Metrics | Automated systems track key performance indicators, improving visibility into AI's impact. |
ThoughtSpot brings search-driven analytics to finance teams. You can use natural language queries to search your data, even if you don’t have technical skills. The platform uses AI to deliver quick, actionable insights.
Visbanking is a bank intelligence system designed for financial institutions. You get advanced analytics, AI integration, and real-time monitoring. The platform helps you track key performance indicators, optimize operations, and measure ROI.
| Feature | Benefit |
|---|---|
| Advanced Analytics Capabilities | Enables real-time monitoring and predictive analytics for informed decision-making. |
| AI and Machine Learning Integration | Processes vast amounts of data efficiently, enhancing operational efficiency and customer service. |
| Comprehensive Insights | Provides insights into operational performance and risk management. |
| Real-time Monitoring | Allows banks to track key performance indicators and respond to market changes instantly. |
| Performance Optimization Tools | Identifies operational inefficiencies and implements corrective measures proactively. |
| ROI Measurement Metrics | Offers visibility into the impact of strategic decisions, aiding in adjustments based on data. |
| Automated Reporting Functions | Streamlines compliance processes and provides timely, accurate information to stakeholders. |
| Customization Options | Tailors the platform to specific needs, ensuring maximum utility and return on investment. |
| Case Studies | Demonstrates significant improvements in operational efficiency and risk reduction. |
NetSuite is a cloud-based financial management platform that integrates with FP&A tools for dynamic budgeting and forecasting. You can automate financial reporting, create interactive dashboards, and collaborate with your team in real time.
QuickBooks is a favorite among small and medium-sized businesses for financial analysis. You can generate detailed reports, track expenses, and integrate with third-party apps like Shopify and PayPal.
QuickBooks provides a wide range of reports that help you track financial performance and make informed decisions. These reports offer insights into income, expenses, sales, inventory, and payroll, enabling you to analyze trends and identify opportunities for growth.
| Feature | Description |
|---|---|
| Detailed Reporting | Customizable reports including profit-and-loss statements, balance sheets, and cash flow reports. |
| Expense Tracking and Management | Connects to bank accounts to download and categorize expenses automatically. |
| Integration with Third-Party Apps | Seamless integration with apps like Shopify, PayPal, and Square for enhanced functionality. |
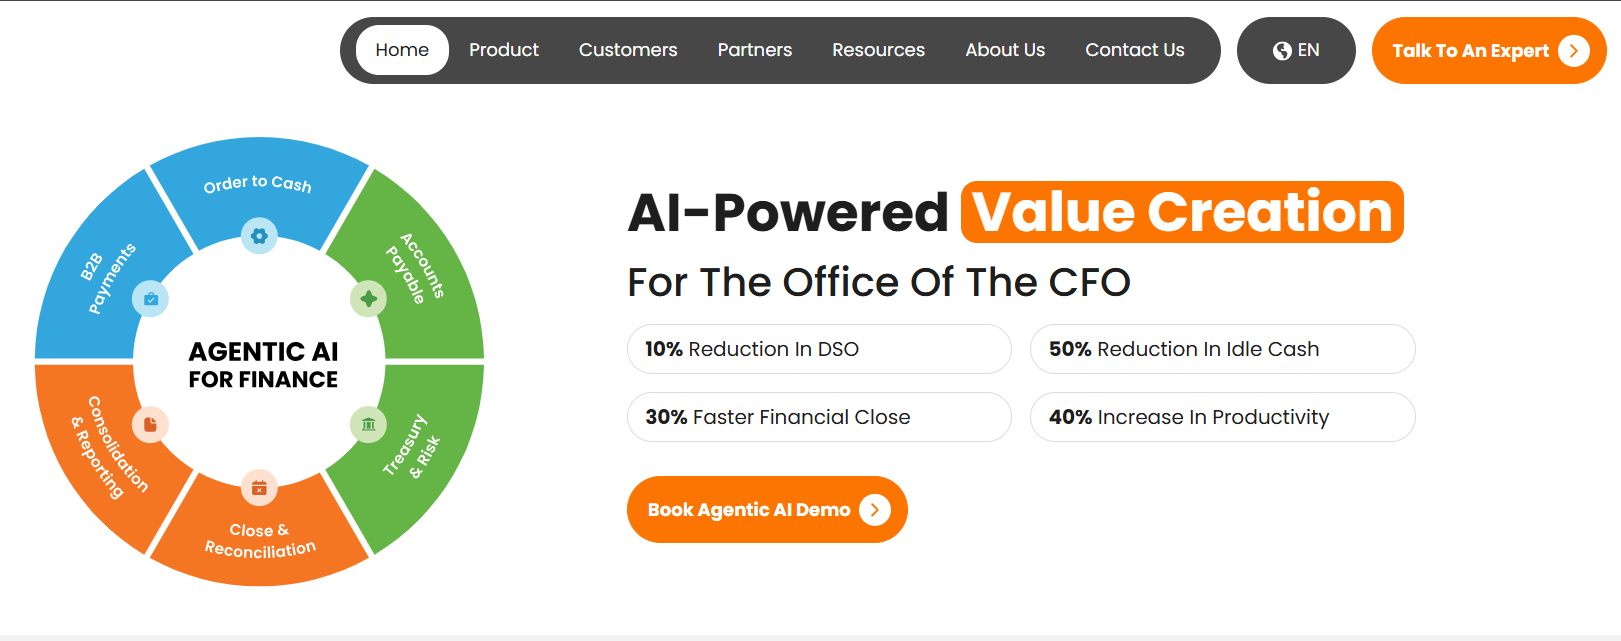
Highradius automates financial processes, boosting efficiency and reducing manual effort. You can automate cash application, reconciliation, and reporting, which saves time and cuts costs.
| Metric | Result |
|---|---|
| Efficiency Boost | 85% |
| Automation of Cash Application Process | Yes |
| Reduction in Manual Effort | Yes |
| Automated Reconciliation | 97% |
| Entries Processed | 1700+ |
| Reduction in Person-Hours | ~60% |
Prophix is a budgeting and forecasting platform that uses automation and real-time collaboration. You can customize planning approaches and improve accuracy, with users reporting a 50% increase in budget accuracy and a 6.7% increase in operating margins.
Note: The table below highlights a few additional financial data analysis tools projected to see wide adoption.
| Tool Name | Key Features | Projected Adoption |
|---|---|---|
| Refrens | Powerful Invoicing, Automated Accounting, Business Automation Tools, Inventory & Expense Management, Integrated Sales CRM, Multi-User & Multi-Business Support | Widely used by over 150,000 businesses globally |
With so many financial analytics tools available, you have more options than ever to find the best financial analysis software for your needs. Whether you want advanced analytics, easy reporting, or seamless integration, these tools help you turn financial data into actionable insights.
Financial data analysis tools are changing the way you work in finance. These tools help you collect, organize, and analyze financial data from many sources. You no longer need to rely on slow spreadsheets or manual reporting. Instead, you get fast, accurate insights that drive your business forward.
When you use financial data analysis tools, you gain more control over your financial analysis software. These tools automate routine tasks, reduce errors, and give you real-time access to financial insights. You can spot trends, manage risks, and make smarter decisions. The best financial analysis software helps you move from guesswork to data-driven decisions.
You want your numbers to be right. Financial analytics tools make that possible. They process data quickly and use smart validation algorithms to catch mistakes before they happen. Automation saves you time and cuts down on manual errors. You get predictive insights that help you manage financial trends and risks.
Financial analytics software gives you the power to make decisions based on facts, not gut feelings. You see real-time data and use predictive models to plan ahead. You can understand customer behavior and personalize your offerings. Companies using analytics report big savings in operational costs and gain a competitive edge by spotting trends early.

Financial reporting tools solve many common pain points. You can unify data from different sources, manage taxes and regulations, and ensure data accuracy. The right financial planning and analysis platform makes reporting faster and easier. You get clear, reliable reports that help you make better decisions.
| Pain Point | Description |
|---|---|
| Data accuracy | The challenge lies in ensuring the quality of data, as inaccurate or incomplete data can lead to flawed decisions. |
| Unify disparate data | Integrating data from various fragmented sources is difficult, making it hard to conduct comprehensive analyses. |
| Manage taxes and regulation | Keeping up with evolving tax laws and regulatory compliance across jurisdictions is complex. Automation helps. |
Financial analytics tools help you overcome these challenges. You get unified data, automated compliance, and accurate financial insights. With the best financial analysis software, you can focus on strategy instead of manual reporting.
When you look for financial data analysis tools, you want more than just basic reporting. These tools help you collect, organize, and analyze financial data so you can make better decisions. Financial data analysis tools are designed to turn raw numbers into clear insights, making your job easier and your results more reliable.
Let’s break down the features you should expect from top financial analysis software. These features make your work faster, more accurate, and much more collaborative.
You need tools that connect to all your data sources. Financial analysis software should pull data from databases, spreadsheets, and cloud platforms without hassle. When your data is integrated, you can make decisions three times faster. Companies with seamless integration report productivity gains that speed up month-end closing by 50%. Automated validation rules catch errors before they enter your system, so your financial analysis stays accurate.
| Evidence Description | Impact on Efficiency |
|---|---|
| Integrated financial data speeds up decision-making by 3x | Improves efficiency |
| Productivity gains accelerate month-end closing by 50% | Reduces manual work |
| Automated validation rules catch inconsistencies | Improves data quality |

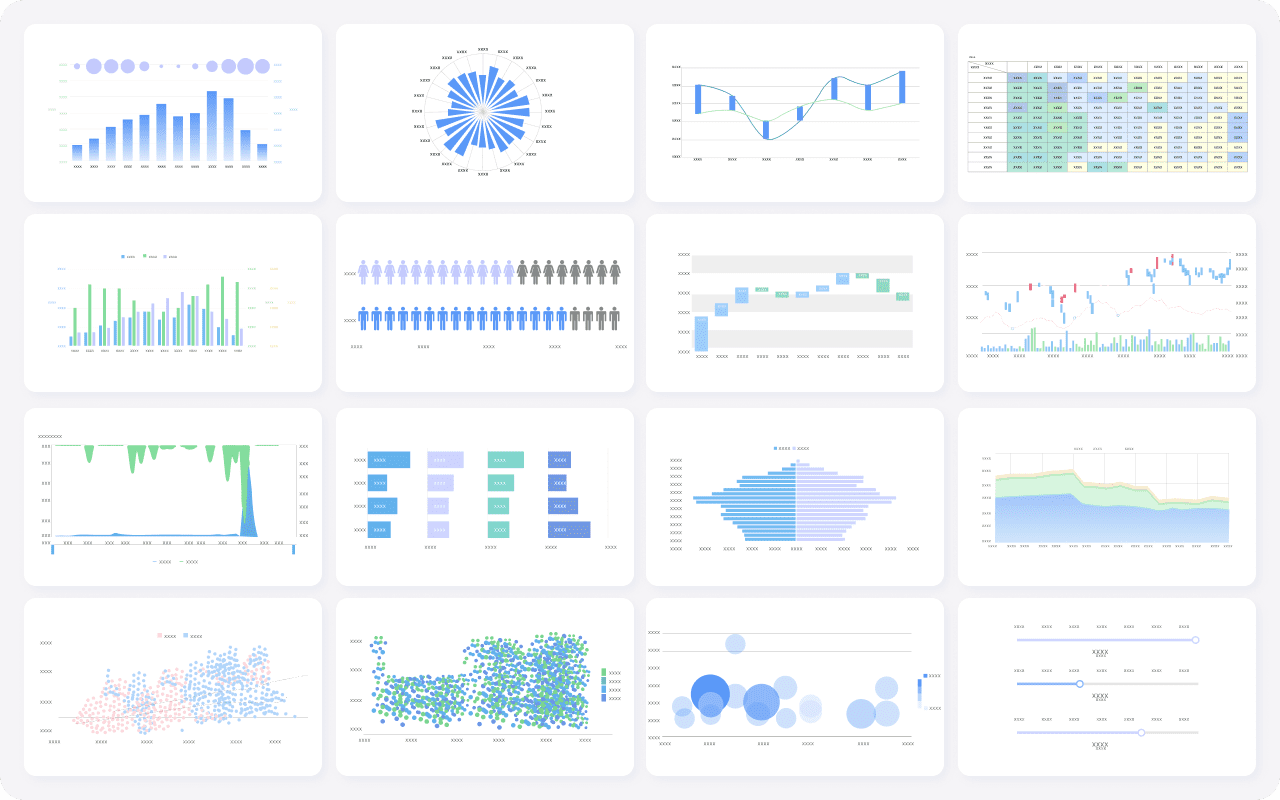
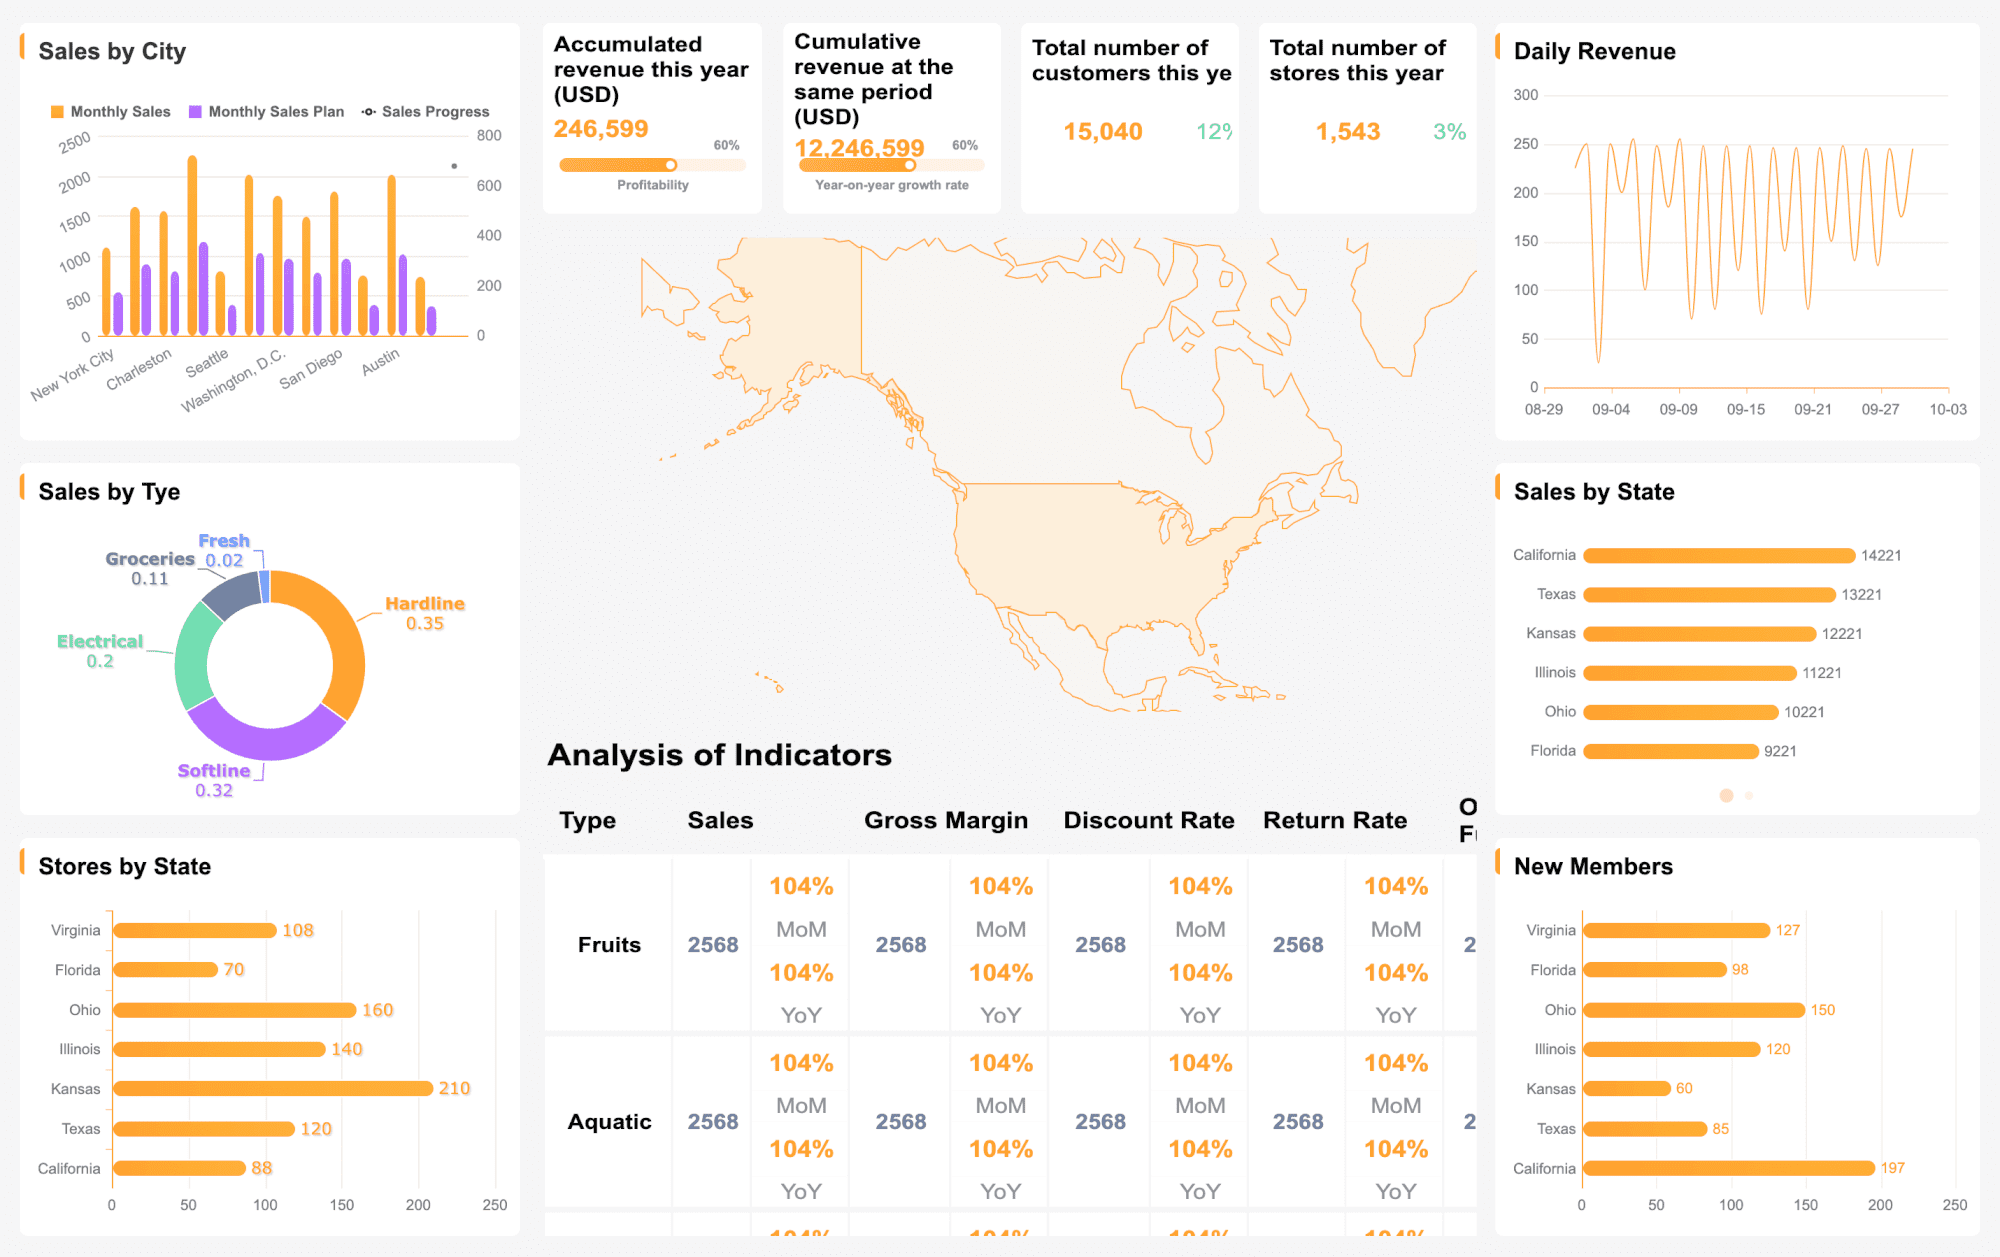
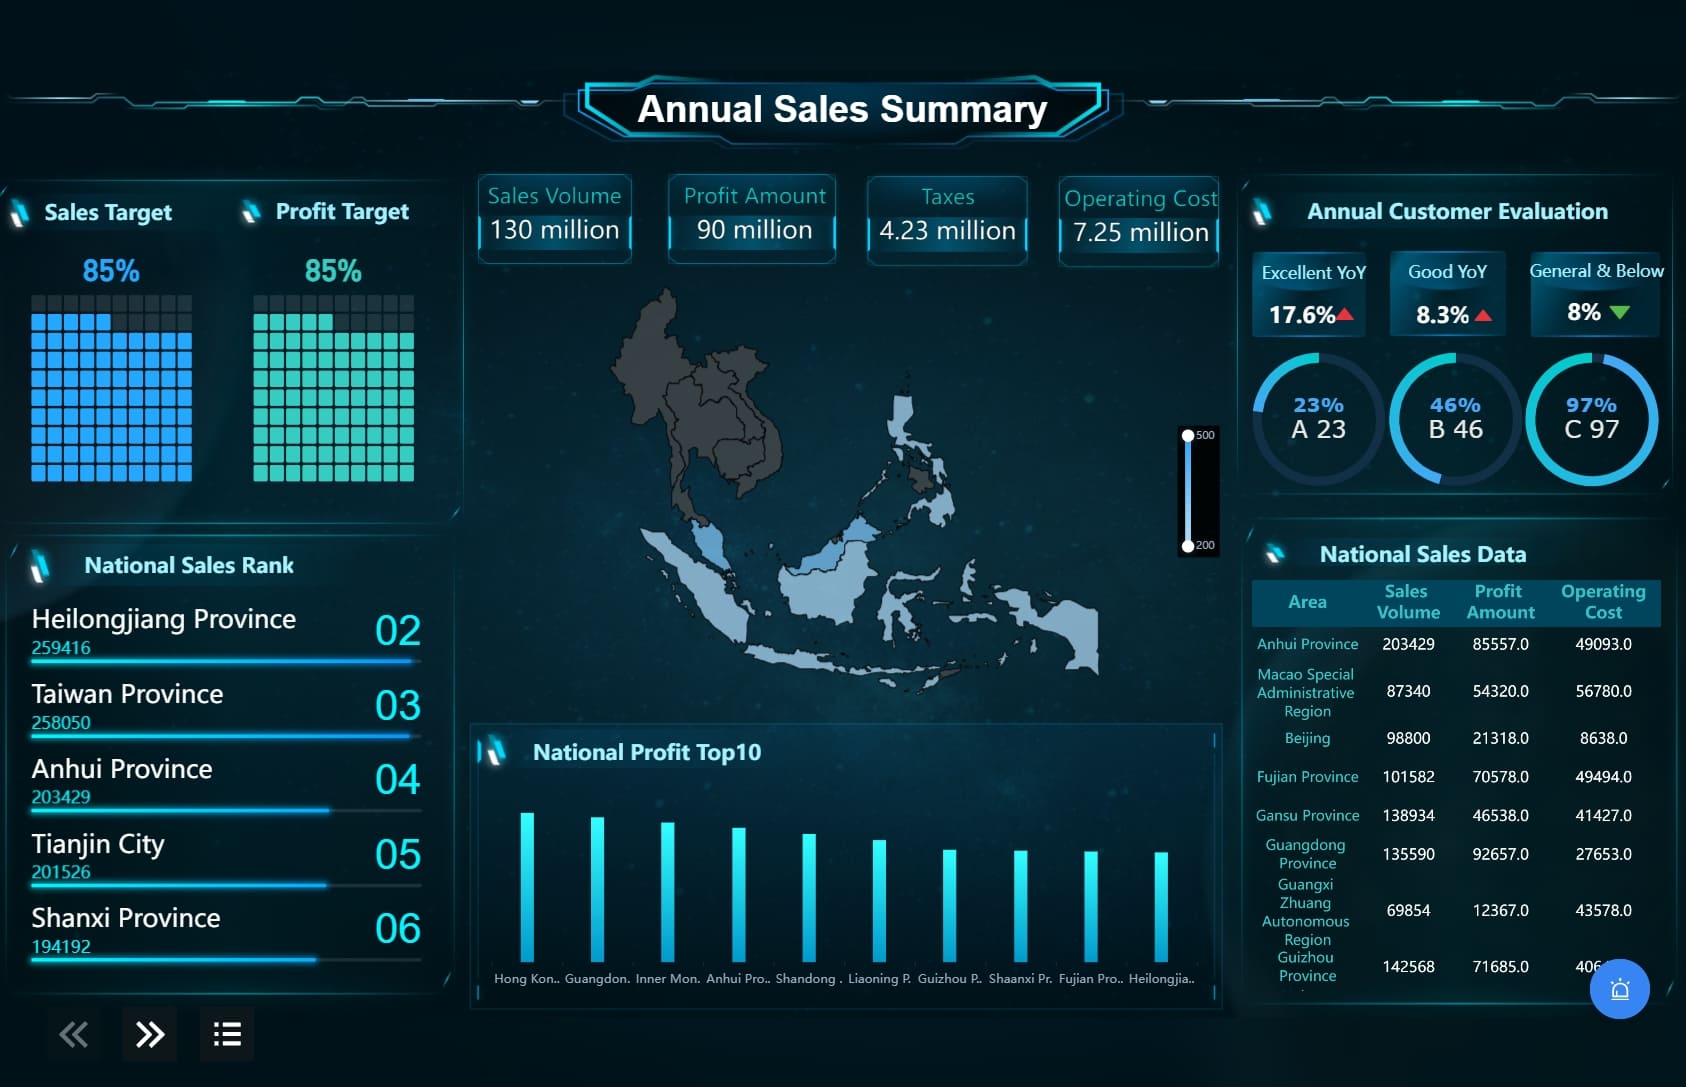
You want more than numbers—you want insights. Financial analytics software offers advanced analytics and data visualization tools that help you spot trends and patterns. Customizable dashboards and interactive graphs make it easy to share findings with your team. Data analysis and visualization features turn complex financial data into actionable insights.
| Feature | Description |
|---|---|
| Data Visualization and Advanced Analytics | Custom dashboards and interactive graphs for actionable insights |
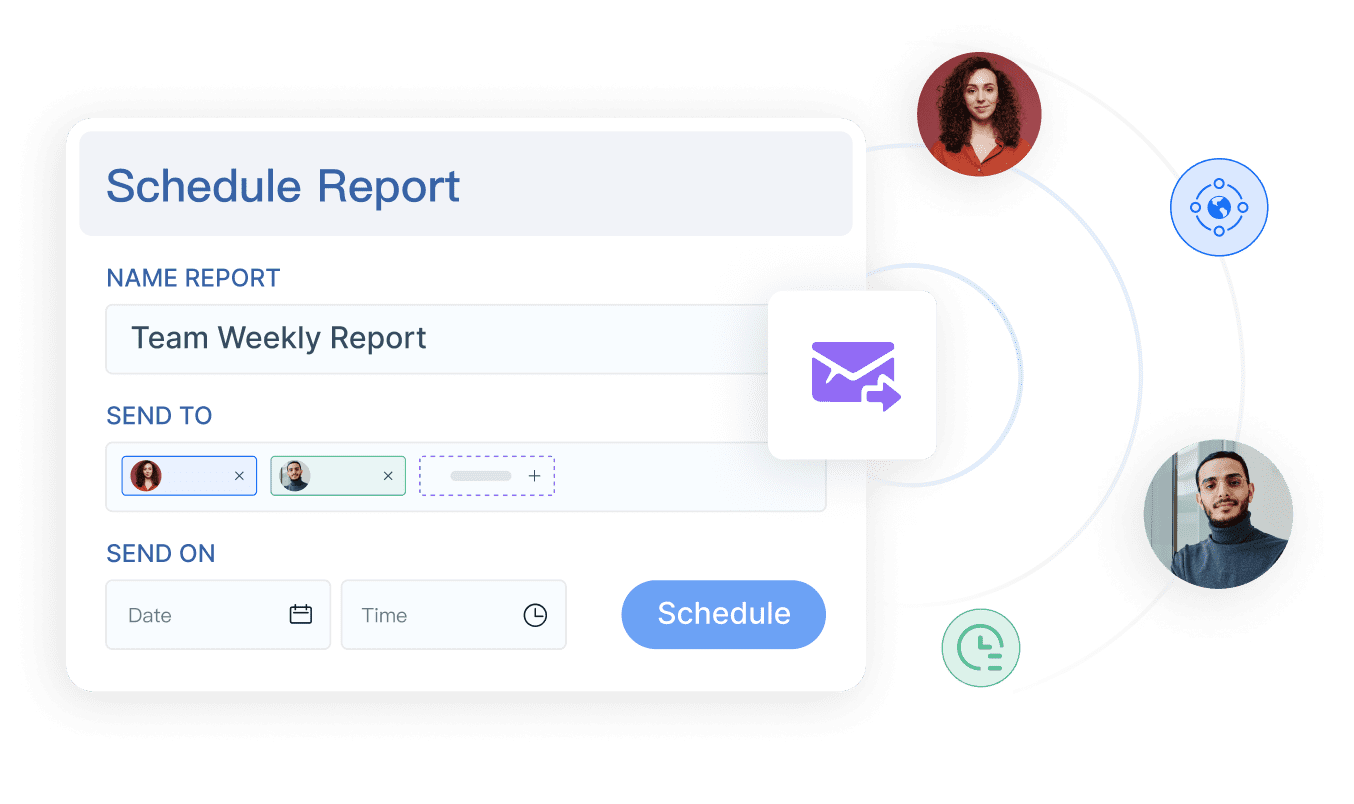
Automation is a game changer. Financial analysis software automates routine reporting, freeing up your time for strategic work. Real-time data analysis lets you track key metrics instantly. You get up-to-date information, so you can respond quickly to changes in your business.
| Feature | Description |
|---|---|
| Real-Time Financial Reporting | Instant access to current financial data and KPI tracking |
Protecting your financial data is critical. The best tools offer strong security features and help you stay compliant with regulations. You control who can access sensitive information, and automated compliance checks keep your reporting accurate.
As your team grows, you need tools that scale with you. Collaboration features let you share data and insights across departments. Automation reduces bottlenecks, so teams can focus on strategic decisions. Real-time insights and independent decision-making help your finance team stay efficient as you scale.
Financial data analysis tools with these features help you work smarter, not harder.
You want to choose the right financial analysis software for your team. This section gives you a quick look at the top financial data software options. Each tool helps you turn financial data into useful insights. You can use these profiles to compare features, strengths, and best use cases.
FineBI lets you connect to many data sources and build dashboards with a simple drag-and-drop interface. You do not need to code. You can explore data, drill down into details, and get real-time financial insights. FineBI uses AI to help you find trends and make predictions. Teams use it for budgeting and forecasting, tracking KPIs, and sharing reports. FineBI works well if you want self-service analytics and strong data governance.
FineReport is a flexible reporting tool. You can create pixel-perfect reports and dashboards that look great on any device. The Excel-like designer makes it easy to build custom reports. FineReport supports real-time data entry and automates scheduled reporting. It is a good fit for companies with complex budgeting and forecasting needs. You can use it to combine data from many sources and share results across departments.
Power BI connects to almost any data source. You can build interactive dashboards and share them with your team. It works well for budgeting and forecasting, especially if you already use Microsoft products. Power BI helps you visualize data and spot trends fast.
Tableau is known for its easy-to-use dashboards. You can connect to large data sets and create visual reports quickly. Tableau is great for budgeting and forecasting because you can see patterns and share insights with others.
Qlik Sense lets you explore data in any direction. You are not limited to set paths. This makes it easy to find new insights for budgeting and forecasting. Qlik Sense handles large data sets and gives you flexible analysis tools.
SAP Analytics Cloud brings together planning, analysis, and reporting. You get real-time access to financial data. It is strong in budgeting and forecasting for large organizations that need to centralize their data.
Oracle Analytics offers real-time dashboards and automated alerts. You can use it for budgeting and forecasting, KPI tracking, and advanced reporting. It works well for companies that need deep financial analysis.
Sage Intacct is a cloud-based tool. You can automate reporting and get real-time financial data. It is popular for budgeting and forecasting in growing businesses.
Anaplan supports collaborative budgeting and forecasting. You can plan, model, and track expenses with your team. It is ideal for companies that want to align goals across departments.
Planful automates budgeting and forecasting. You can use AI tools to reduce errors and improve accuracy. Planful helps you track key metrics and make better decisions.
ThoughtSpot lets you search your data using natural language. You can get quick answers for budgeting and forecasting. AI features help you spot trends and outliers.
Visbanking gives banks advanced analytics and real-time monitoring. You can use it for budgeting and forecasting, risk management, and performance tracking.
NetSuite combines financial management with budgeting and forecasting tools. You can automate reporting and collaborate in real time.
QuickBooks is popular with small businesses. You can track expenses, generate reports, and manage budgeting and forecasting with ease.
Highradius automates cash application, reconciliation, and reporting. You can save time and improve accuracy in budgeting and forecasting.
Prophix focuses on budgeting and forecasting. You can automate planning, collaborate with your team, and improve accuracy with real-time data.
Tip: When you compare financial data software, look for tools that match your team’s budgeting and forecasting needs. The right choice will help you turn data into actionable insights.

When you use financial analysis software, you move beyond manual spreadsheets and guesswork. These tools help you collect, organize, and analyze financial data from different sources. Financial analysis software means you can turn raw numbers into clear insights, making your job easier and your decisions smarter.
You might wonder what makes these tools so valuable. Financial analytics software gives you the power to automate reporting, improve accuracy, and collaborate with your team. You can see trends, manage risks, and plan for the future with confidence. Let’s look at the main benefits you’ll experience.
Accurate data is the foundation of good decisions. Financial analysis software automates data collection and validation, so you catch errors early. You can trust your numbers and avoid costly mistakes. For example, a modern financial management system lets you create data-driven budgets and assess the impact of your choices. You streamline budgeting and forecasting, which means less time fixing errors and more time planning for growth.
| Benefit | Description |
|---|---|
| Streamlined budgeting | Automates budgeting processes, reducing time and errors. |
| Enhanced forecasting | Provides tools for scenario modeling, preparing you for different business conditions. |
| Data-driven decision-making | Empowers you to make informed choices that drive growth. |
You save time when you automate routine tasks. Financial analytics software handles data entry, reporting, and analysis, freeing you up for more important work. Companies like Meta saw a 30% increase in server utilization and $1.1 billion in cost optimization after improving their reporting and analytics. Saks Global reduced overdue payables and improved cash flow management. These results show how the right tools boost productivity and efficiency.
With accurate data and real-time insights, you can plan for the future. Financial planning and analysis tools help you model different scenarios and prepare for change. You get a clear view of your business, so you can set goals and track progress. Teams that use analytics make smarter decisions and adapt quickly to new challenges.
Financial analysis software breaks down silos. You and your team can share data, reports, and insights across departments. This leads to better teamwork and faster problem-solving. Saks Global, for example, improved inventory alignment and operational efficiency by using integrated analytics. When everyone works from the same data, you get better results.
When you invest in financial analysis software, you give your team the tools to work smarter, not harder. You gain accuracy, speed, and the ability to turn data into real business value.
Choosing the right financial data analysis tools can feel overwhelming, but it’s all about finding what fits your team’s needs. Financial data analysis tools are software solutions that help you collect, organize, and analyze data from different sources. These tools turn raw data into clear insights, making it easier for you to make data-driven decisions and improve your financial planning and analysis process.
When you start looking for financial analysis software for fp&a teams, focus on how these tools can help you automate reporting, connect to your existing data systems, and support your analytics goals. The right choice will help your team move faster, reduce errors, and get more value from your data.
Start by understanding what your team really needs from financial analysis software for fp&a teams. Think about your current workflow, the types of data you use, and the level of technical skill on your team. Here’s a quick table to help you break down the main criteria:
| Criteria | Description |
|---|---|
| Ease of use | The tool should have an intuitive interface for users of all technical levels. |
| Integration capabilities | It should integrate seamlessly with existing systems and data sources. |
| Cost | The tool must align with the budget of the finance team. |
| Advanced analytics | Check for features like machine learning if required now or in the future. |
| Security and compliance | Ensure the tool complies with security standards for financial data. |
| Support options | Look for community forums and customer support for implementation help. |
When you compare financial data analysis tools, look beyond the sticker price. Consider the total cost of ownership, including setup fees, support, and any hidden costs. Make sure the tool is easy to use and offers automation to cut down on manual work. Here are some key factors to keep in mind:
You want financial analysis software for fp&a teams that connects smoothly with your existing systems. Check if the tool can pull data from your ERP, CRM, and other platforms. Strong integration means you spend less time moving data around and more time getting insights.
A good user experience makes all the difference. Pick financial data analysis tools with a simple interface and clear navigation. Reliable customer support and active user communities can help you solve problems quickly and keep your analytics running smoothly.
Tip: Take advantage of free trials or demos to see how the tool fits your workflow before making a final decision.
Choosing the right financial data analysis tools can transform how you handle reporting and make decisions. Take a close look at your current process. Try advanced software like FineBI or FineReport to get better insights and work faster. Start by researching, then test a few options before you commit. These tools help you improve accuracy and efficiency. Stay curious and keep learning about new solutions in financial analytics.

How to Do Retention Analysis for Business Success
What is Pareto Chart and How Does it Work
How DuPont Analysis Helps You Understand Your Business

The Author
Lewis
Senior Data Analyst at FanRuan
Related Articles
Data Analyst Dashboard: A Scenario-Based Guide to KPI Views That Drive Better Business Decisions
Learn how data analyst dashboards turn raw data into actionable KPI views for operational, analytical, and strategic decisions. Drive better business outcomes.
Lewis Chou
May 03, 2026

Self-Service Analytics Defined and Why You Need It
Self-service analytics lets you analyze data without IT help, empowering faster, data-driven decisions and boosting agility for your business.
Lewis
Jan 04, 2026
Best Self-Service Tools for Analytics You Should Know
See which self-service tools for analytics let business users access data, build dashboards, and make decisions faster—no IT help needed.
Lewis
Dec 29, 2025


