Dashboard
Lewis Chou
Mar 26, 2026
If you want your online store to grow fast, you need to know what is happening behind the scenes. Ecommerce dashboard examples show your sales, marketing, and customer behavior in one place. With the right e-commerce tools, you can find problems before they get worse. Many stores use dashboards to check inventory, get more conversions, and make better choices every day. You can act fast and get better results because all your numbers are easy to see.

When you have an online store, you need to see all your important information in one spot. Ecommerce dashboard examples help you do this easily. These dashboards collect data from your sales, marketing, and inventory. This gives you a simple way to see what is going well and what needs help.
Here are the main things most e-commerce dashboards can do:
| Function | Description |
|---|---|
| Optimize performance | Centralizes data to provide a clear picture of business direction and performance metrics. |
| Provide key metrics | Essential KPIs help businesses make informed decisions based on data analytics. |
| Manage inventory | Analytics assist in inventory management, forecasting, and timely reordering to meet customer demand. |
| Create personalized experiences | Data-driven insights enable tailored offers and recommendations to enhance customer engagement. |
You can use ecommerce dashboard examples to check things like total revenue and customer retention. These dashboards help you notice patterns and act quickly. You can also keep track of your inventory and make sure you always have enough of your best-selling products.
There are different kinds of e-commerce dashboards. Some are made for big-picture planning, and others help with daily work. Here are some types you might find:
| Dashboard Type | Description |
|---|---|
| Ecommerce KPI Dashboard | Brings KPIs together for online sellers to optimize performance. |
| Shopify Dashboard | Provides key metrics for Shopify merchants to overview online store performance. |
| Ecommerce Marketing Dashboard | Offers Marketing Managers a complete overview of metrics needed for successful online campaigns. |
| Inventory Dashboard | Gives a real-time view of stock levels to help manage product availability and orders. |
| Warehouse Dashboard | Displays live order information to help warehouse teams anticipate demand and meet fulfillment goals. |
You want to make good choices for your store. E-commerce dashboards show you real-time data so you can act fast. If you see sales drop or more people leave their carts, you can check what is wrong right away. This helps you fix problems before they get bigger.
Dashboards also make your job easier. You do not have to search through lots of spreadsheets or wait for reports. Everything you need is right there. Leadership teams can use ecommerce dashboard examples to stop using slow, manual reports and start making quick, smart decisions. Stores that use these dashboards often get more sales and happier customers.
You can see how dashboards help real stores. For example, one company fixed checkout problems and got 30% more sales. Another made the customer experience better and got thousands of new subscribers. E-commerce dashboards help you watch what matters, so your store can grow and your customers will want to come back.
Are you ready to learn how dashboards can help your store? Let’s look at the top 10 ecommerce analytics dashboard types. These dashboards help you make smart choices and grow faster. You will see how each dashboard works. You will also learn which numbers are most important. Tools like FanRuan’s FineReport make things simple.
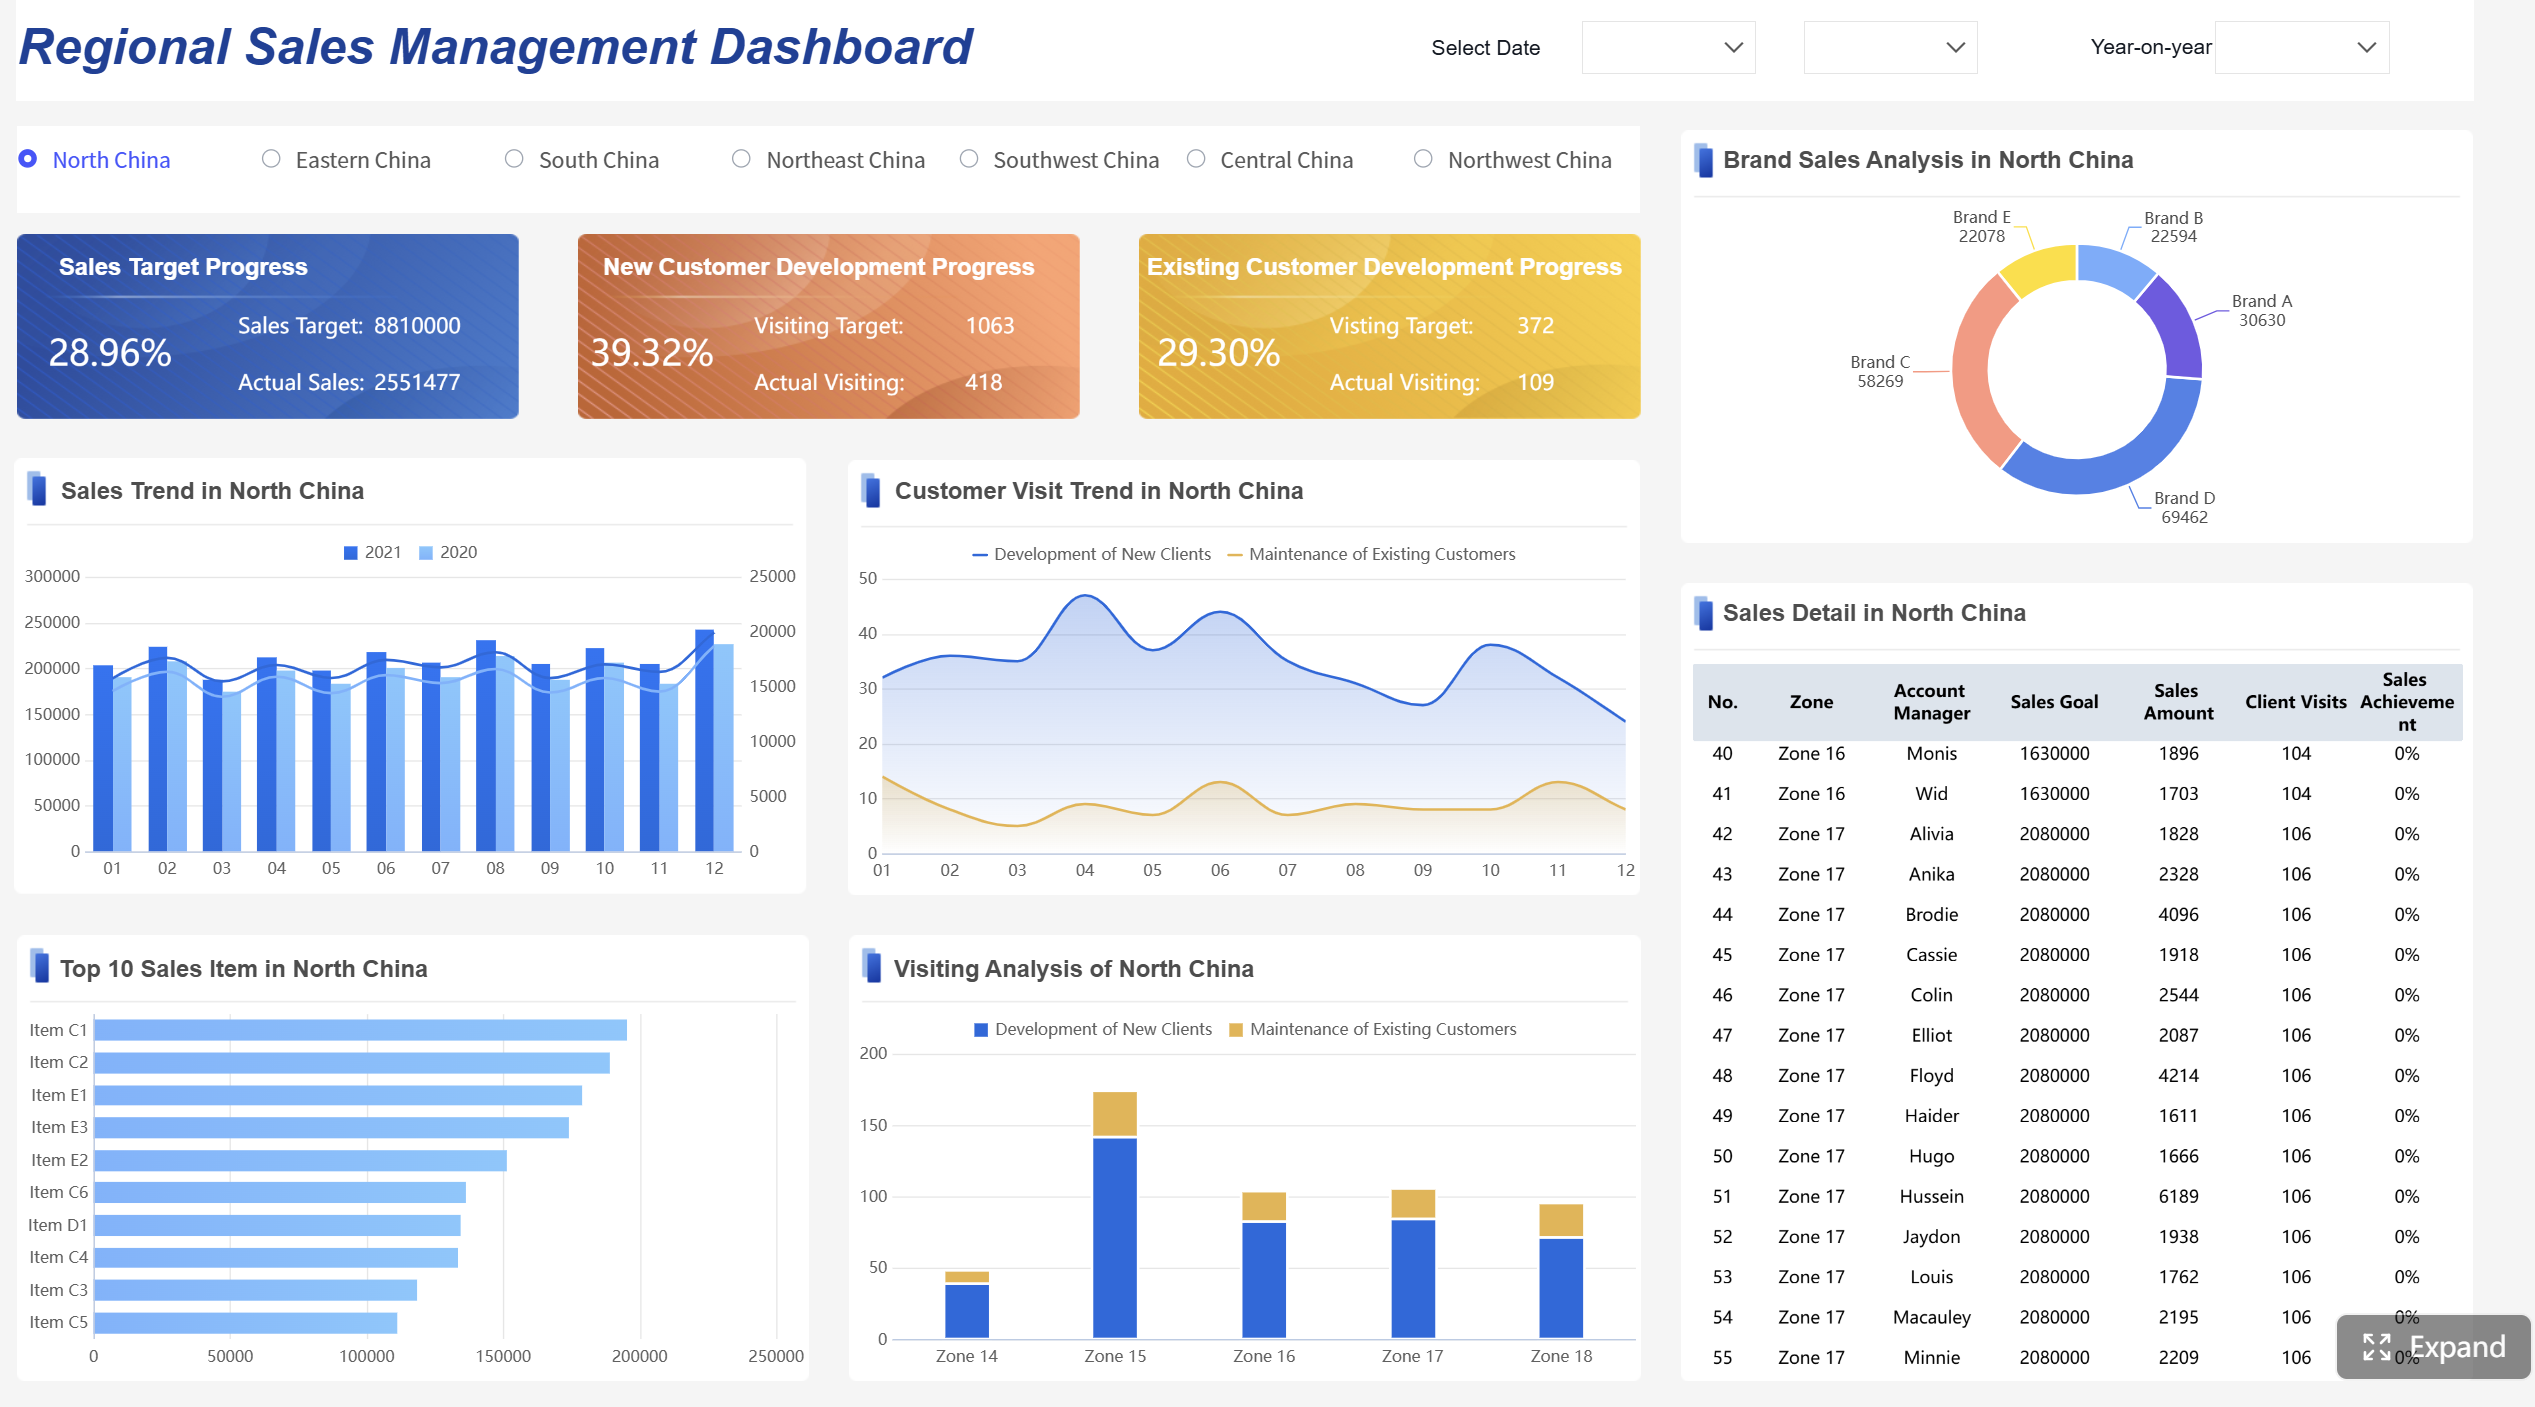
You need to know how your sales are doing. The sales performance dashboard shows your revenue, conversion rates, and average order value. You can see trends and find your best-selling products. You can also check if your marketing is working.
Here are the most important numbers in a sales performance dashboard:
| Metric | Description |
|---|---|
| Revenue | Total income generated from sales. |
| Conversion Rate | Percentage of visitors who make a purchase. |
| Average Order Value (AOV) | Average amount spent per transaction. |
| Customer Acquisition Cost (CAC) | Cost associated with acquiring a new customer. |
| Customer Lifetime Value (CLV) | Total revenue expected from a customer over their lifetime. |
| Cart Abandonment Rate | Percentage of shoppers who add items to their cart but do not complete the purchase. |
| Campaign Performance | Effectiveness of marketing campaigns in driving sales. |
FanRuan’s FineReport helps you build a dashboard that updates right away. You can connect data from your store, CRM, and marketing tools. For example, BOE used dashboards and made their work 50% better. When you see all your numbers together, you can act fast and get better results.
Do you want to know if your ads and emails work? The marketing dashboard shows how your campaigns are doing. You can track conversion rates and cart abandonment. You can also see which channels bring the most customers.
FineReport lets you put data from Google Ads, Facebook, and emails in one place. Here is how real companies use marketing dashboards:
| Case Study | Approach | Outcome |
|---|---|---|
| Email Marketing | Tracked outreach performance, showing lead movement and engagement. | Improved campaign effectiveness and increased replies. |
| Google Ads | Summarized KPIs like ROAS and CTR for quick assessment. | Optimized budgets and boosted campaign performance. |
| Ecommerce Brand | Unified dashboard for daily purchases and cost per purchase. | Identified profitable sources and improved efficiency. |
| Facebook Ads | Tracked funnel performance and costs at each stage. | Improved budget allocation and campaign profitability. |
With FineReport, you can see all your marketing data in one spot. You can make changes that help your store grow.
Do you want to know what your customers think and do? The customer insights dashboard helps you measure happiness and track email engagement. You can also group your customers for special offers.
| Customer Insight Type | Description |
|---|---|
| Measuring Satisfaction | Surveys and NPS scores show how happy your customers are. |
| Email Engagement | Open rates and click-through rates reveal customer interests. |
| Segmentation and Personalization | CRM data helps you target customers based on purchase history. |
| Behavioral Insights | See how customers navigate your site and spot friction points. |
| Predictive Analytics | Use past data to predict future behavior and find churn risks. |
FineReport’s dashboards let you look deeper into customer data. You can make groups and send special offers. This helps you keep customers coming back.
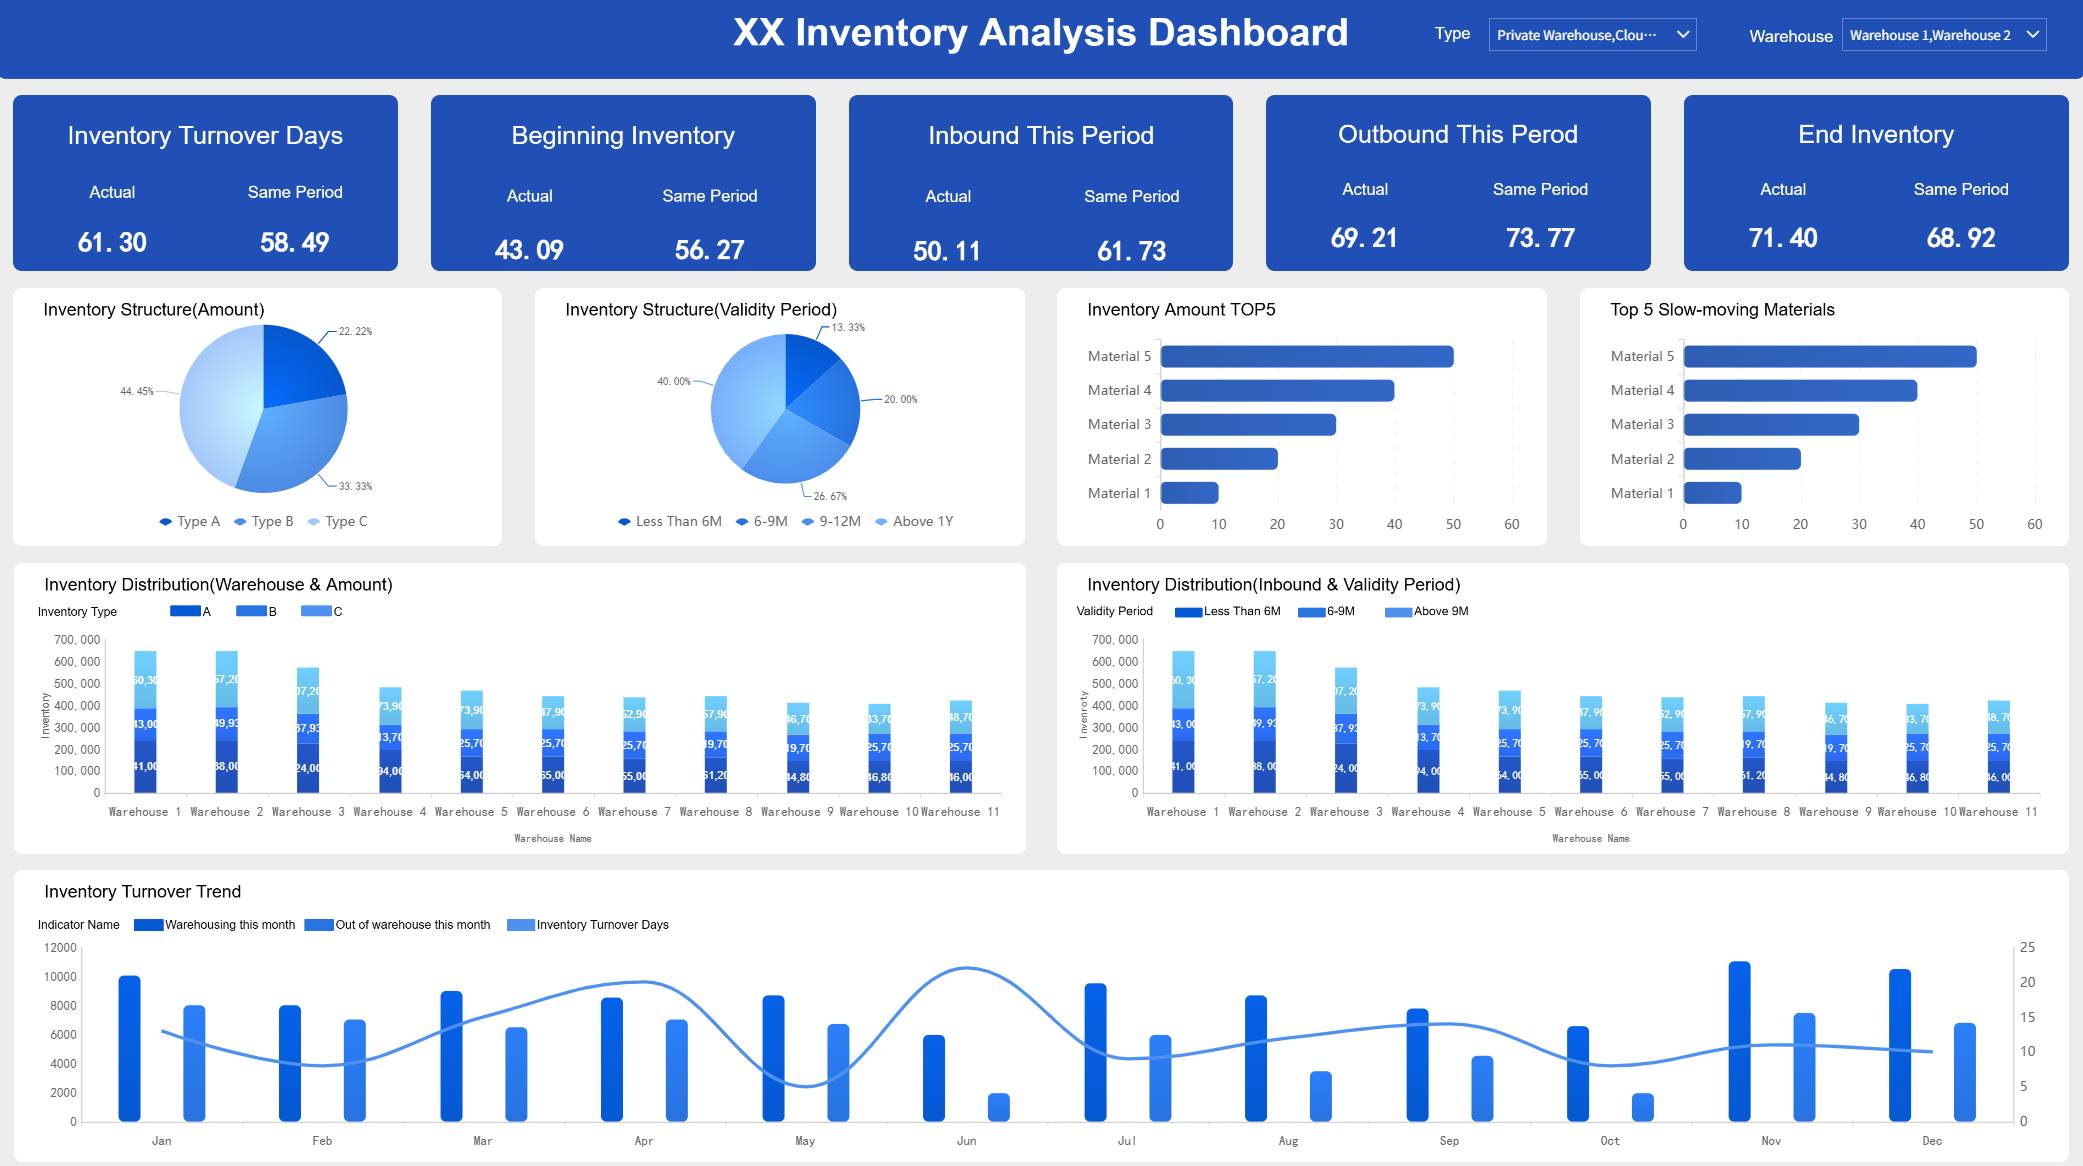
You need to know if you have enough products. The inventory dashboard tracks how fast you sell items and how long they stay. You can find slow-moving stock and make sure you do not run out.
Other important numbers are inventory turnover, accuracy, stockout rate, fill rate, and shrinkage rate. FineReport connects your sales and inventory for quick updates. Companies using dashboards had 37% fewer stockouts, 29% less extra stock, and 24% happier customers.
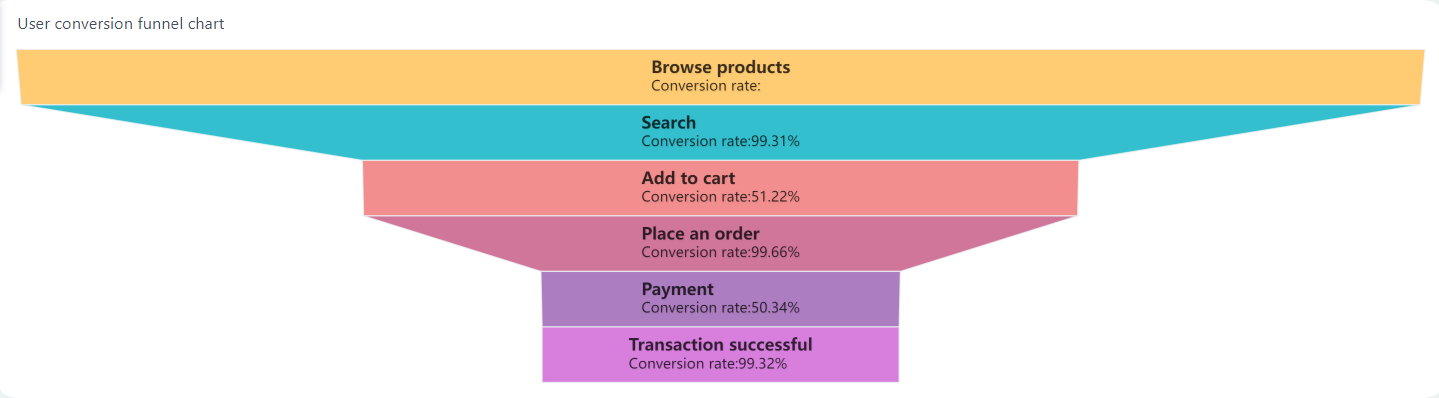
You want to know how many visitors buy something. The conversion rate dashboard shows where people leave the buying process. You can fix problems and get more sales.
| Category | Conversion Rate |
|---|---|
| Global average | 1.9-2% |
| Shopify average | 2.5-3% |
| Triple Whale 2025 median | 2.01% |
| Top 20% of stores | 3.2% and up |
| Top 10% of stores | 4.7% and up |
| Desktop conversion | 3.9% |
| Mobile conversion | 1.8% |
| Americas region | 3.14% |
| Food & Beverage | 4.9% |
| Home Goods | 1.4% |
Funnel analysis helps you see where customers stop shopping. FineReport’s dashboards let you find these spots and fix them. You can raise your conversion rates and grow your store.
You need to know where your visitors come from. The traffic and acquisition dashboard tracks sources like search, ads, referrals, and email. You can see which channels bring the most people and spend your money better.
| Source Type | Examples/Platforms |
|---|---|
| Ecommerce Platforms | Shopify, Magento, WooCommerce |
| Analytics Platforms | Google Analytics 4 (GA4) |
| Advertising Channels | Meta Ads, Google Ads, TikTok Ads |
| CRM Platforms | Klaviyo, HubSpot, Zoho |
| Marketplaces | Amazon, eBay, Flipkart |
| Traffic Channels | Organic, Paid, Social, Email, Affiliates |
You can track numbers like customer acquisition cost and return on ad spend. Research shows data-driven stores get more customers and make more money. FineReport puts all this data in one place for quick choices.
You want to know which products sell best and which need help. The product performance dashboard tracks conversion rates, average order value, customer lifetime value, and repeat buys.
| Metric | Description |
|---|---|
| Sales Conversion Rate | Shows how well your products convert visitors into buyers. |
| Average Order Value (AOV) | Tells you how much customers spend per transaction. |
| Customer Lifetime Value (LTV) | Predicts long-term revenue from each customer. |
| Customer Acquisition Cost (CAC) | Measures how much it costs to get a new customer. |
| Repeat Purchase Rate (RPR) | Tracks how often customers buy again. |
| Refund Rate | Shows how many orders get returned. |
| Cart Abandonment Rate | Measures shoppers leaving without purchase. |
FanRuan and FineReport dashboards show your numbers in real time. You can use the inventory optimization dashboard to find your best products. The PSI & Detail Table helps you plan and make smart choices.
You want every order to ship on time. The order fulfillment dashboard tracks fill rate, order accuracy, cycle time, and on-time shipping. You can find mistakes and make shipping better.
These numbers help you manage stock and keep customers happy. FineReport’s dashboards give you alerts for mistakes and better routing. Companies saw a 12% jump in on-time orders after using dashboards.
| Improvement Aspect | Before Dashboard | After Dashboard | Improvement Rate |
|---|---|---|---|
| On-time Fulfillment Rates | / | 12% | 12% increase |
| Error Detection | Small errors | Real-time alerts | / |
| Routing Efficiency | Manual | Dynamic routing | / |
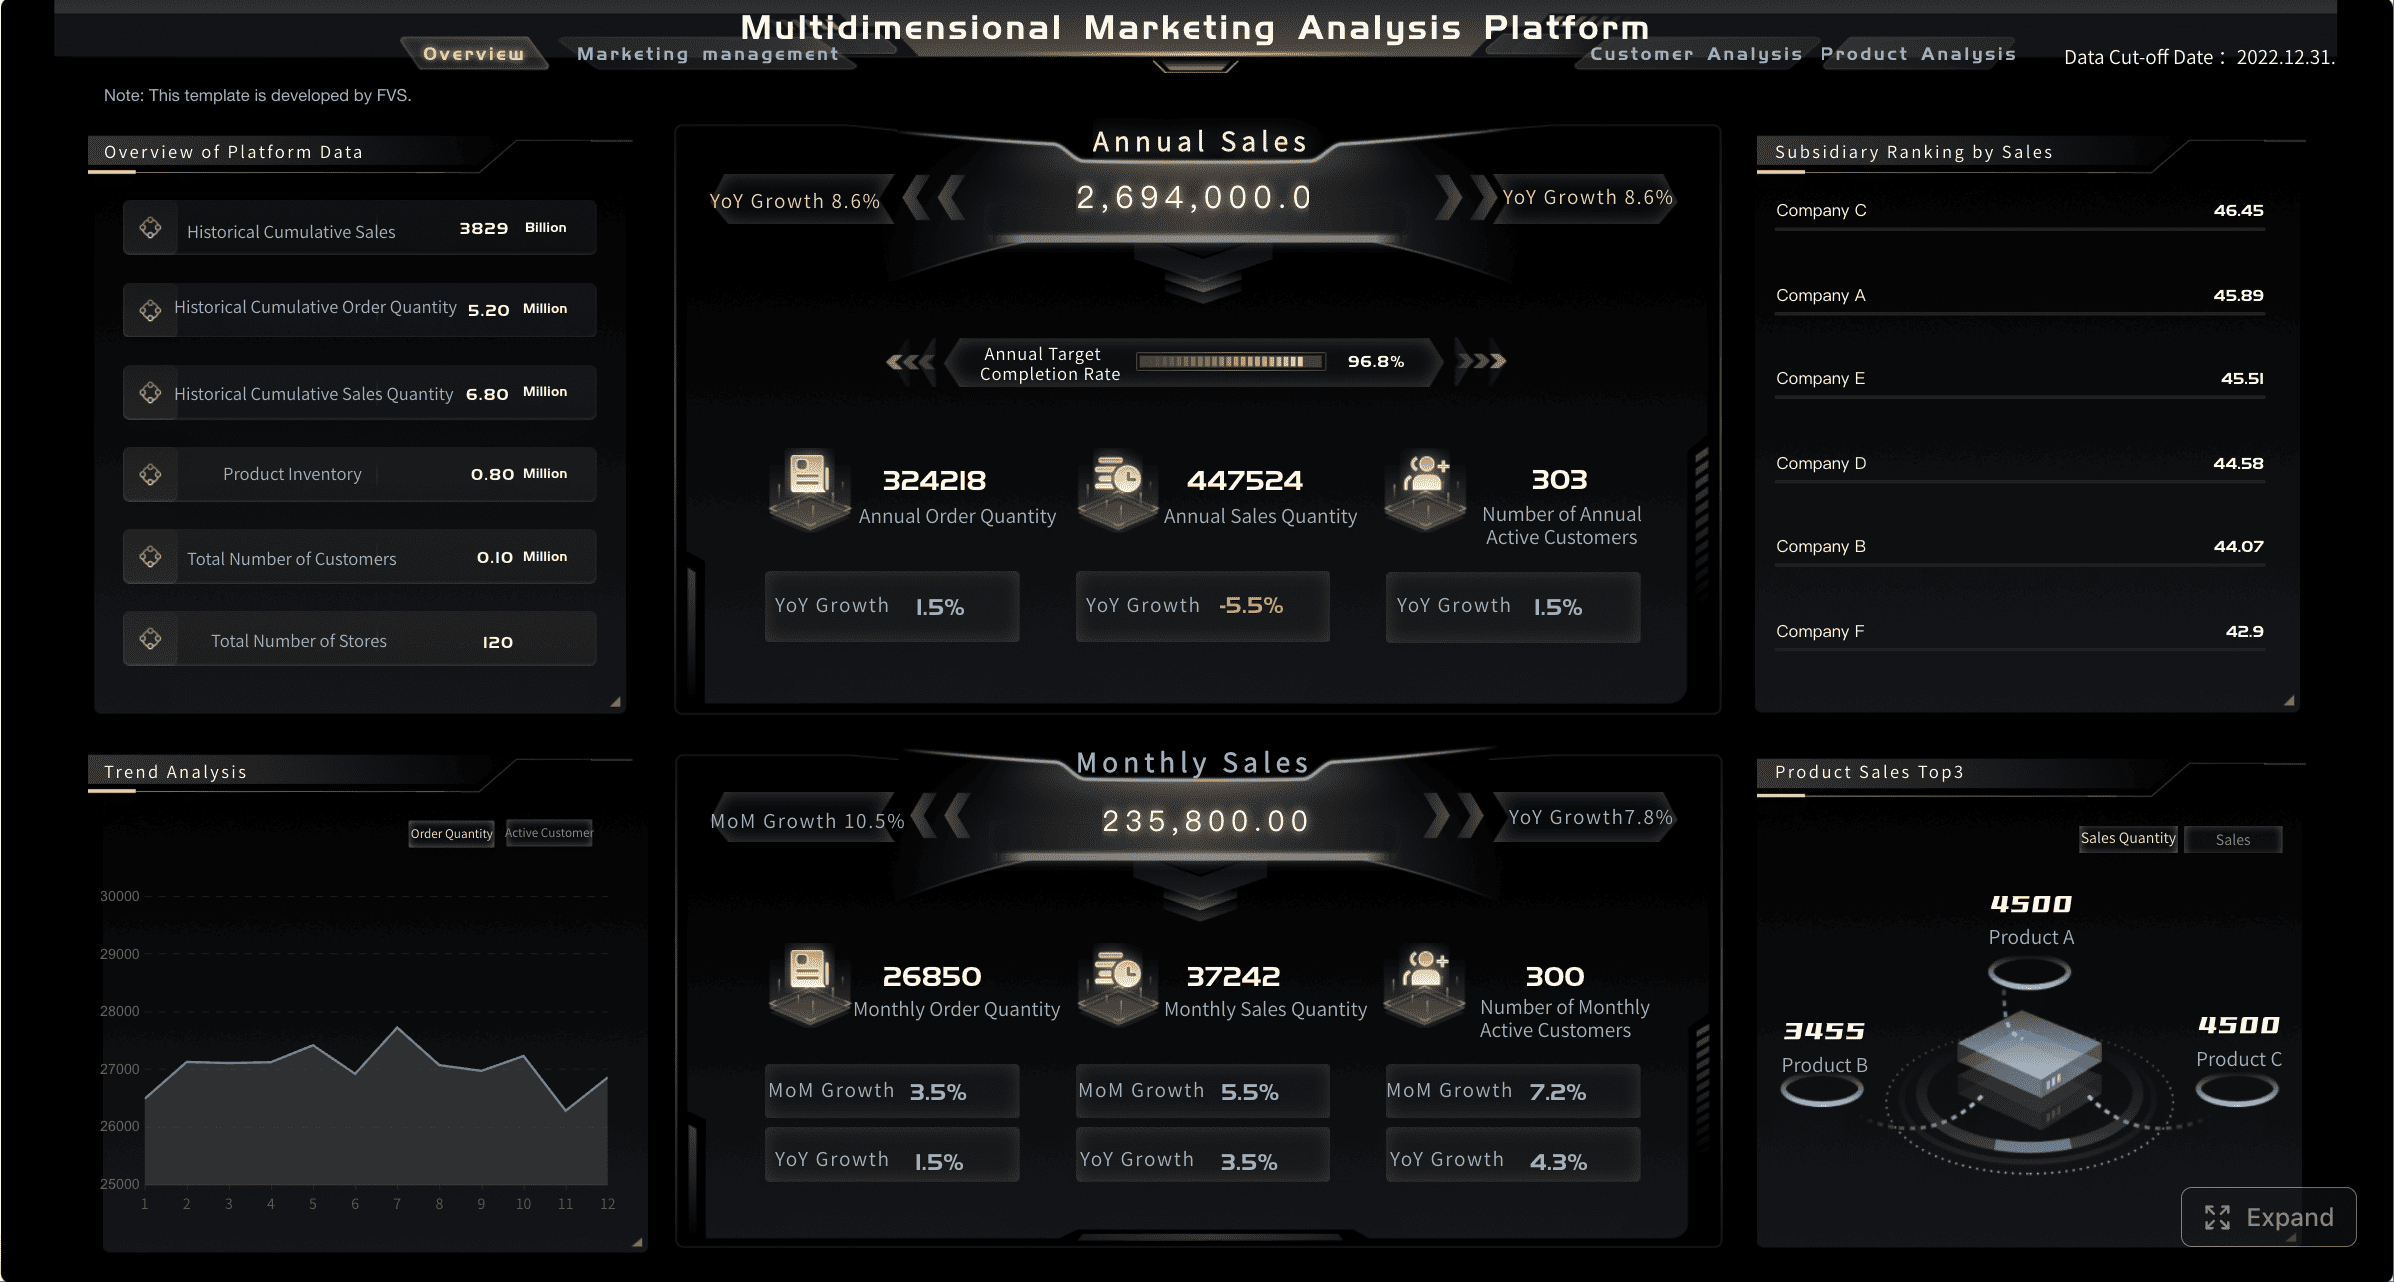
You need to watch your store’s money. The financial overview dashboard shows profit margins, customer acquisition cost, average order value, and revenue growth.
Financial dashboards put all your money data in one spot. You can change budgets fast and use graphs to see trends. FineReport helps you watch trends, plan for the future, and make smart changes.
You want customers to come back and shop again. The retention and loyalty dashboard tracks repeat buys, customer lifetime value, churn rate, and program use.
| Metric | Description |
|---|---|
| Repeat Purchase Rate | Shows how many customers buy again. |
| Customer Lifetime Value (CLV) | Predicts total revenue from each customer. |
| Churn Rate | Measures how many customers stop buying. |
| Average Order Value | Tells you how much customers spend per order. |
| Early Repeat Customer Rate | Tracks customers who buy again soon after their first purchase. |
| Program Participation Rate | Measures engagement in loyalty programs. |
| Customer Retention Rate | Shows how many customers stay with your store. |
| Time Between Purchases | Measures how often customers buy again. |
FineReport’s dashboards let you track these numbers and build loyalty programs. You can find trends and send offers to keep customers interested. When you know what makes customers return, you can grow your store and do better online.
Now you know the top 10 ecommerce dashboards. Each dashboard helps you see what matters and take action. With tools like FineReport, you can connect your data, see trends, and make smart choices every day.
When you pick a dashboard for your store, you want it to be simple. You need tools that help you see important numbers and act quickly. Here are things that make a dashboard great:
| Feature | Description |
|---|---|
| User-Focused Design | Dashboards are made for your job, so you see what matters. |
| Clear Layout | Big, colorful numbers stand out and are easy to find. |
| Easy Navigation | You can use filters and click to look deeper into data. |
| Visual Data Presentation | Charts and graphs help you spot trends and patterns fast. |
| Real-Time Data Updates | You always see the newest info because it updates right away. |
| Customization Options | You can change how things look and pick what to track. |
| Mobile-Friendly Design | Dashboards work on phones and tablets, so you can check anywhere. |
| Clean and Simple Design | There is no extra stuff—just what you need to make choices. |
You also get cool tools like predictive analytics and cohort analysis. These help you see trends and guess what will happen next. Real-time personalization metrics let you make special offers for each customer.
FineReport gives you dashboards that connect to sales, marketing, and inventory. The drag-and-drop tool makes building dashboards fast and easy. You get real-time analytics, so you always know what is happening.
You need to watch the right numbers to help your store grow. The best dashboards show you the most important metrics. Here are some KPIs you should keep an eye on:
An ecommerce kpi dashboard puts these numbers together in one place. You can spot trends and act quickly. FanRuan’s tools help you break down data walls and get teams working together. Shared dashboards help everyone work toward the same goals.
You get dashboards that help you plan and find slow spots in your process. With good data, you do not get confused by wrong numbers. FineReport’s dashboards let you track KPIs in real time, so you always know how your store is doing.
You want your dashboard to fit your store perfectly. Start by thinking about what you need most. Do you want to track sales every hour? Maybe you care more about customer loyalty or inventory levels. Write down your top goals. Ask yourself which numbers help you make decisions. If you run a Shopify dashboard, you might want to see sales, traffic, and conversion rates all in one place. Make a list of the features you need, like real-time updates or mobile access.
Now, look at the tools that can help you build your dashboard. Check if the tool connects to your store’s data sources. FineReport lets you link sales, marketing, and inventory data with just a few clicks. You can customize layouts and choose which metrics to track. Some tools offer drag-and-drop design, so you don’t need to code. Make sure the dashboard updates in real time and works on phones and tablets. Compare features like integration, visualization, and security.
| Feature | Why It Matters |
|---|---|
| Data Integration | Connects all your sources |
| Customization | Lets you track what you want |
| Real-Time Updates | Shows the latest info |
| Mobile Access | Check data anywhere |
Ready to set up your dashboard? Use this checklist to make sure you cover everything:
You can use FineReport to build dashboards that fit your store’s needs. With the right setup, you’ll spot trends, fix problems fast, and help your business grow.
The right e-commerce dashboard can change how you run your store. You see what matters, fix problems fast, and make smarter choices every day. Take a look at your current setup. If you want better results, try FanRuan’s FineReport. Tracking the right numbers helps your store grow.


The Author
Lewis Chou
Senior Data Analyst at FanRuan
Related Articles

10 Customer Intelligence Dashboard Tools Compared: Features, Pros, Cons & Best-Fit Teams
Compare 10 customer intelligence dashboard tools. See features, pros, cons, and which teams each tool is best for, from B2B to enterprise analytics.
Saber Chen
Apr 28, 2026

9 Open Source Metrics Dashboard Tools Compared for 2026: Which One Fits Your Team Best?
Compare Grafana, Metabase, Apache Superset, Redash, and Prometheus for metrics dashboards. Find the best open source tool for your team.
Lewis Chou
Apr 28, 2026

Chowbus Dashboard Guide: 7 Ways to Monitor Delivery Operations in Real Time
Learn 7 ways to use the Chowbus dashboard for real-time delivery monitoring. Track orders, drivers, and KPIs to improve on-time performance and operations.
Lewis Chou
Apr 28, 2026


