Ecommerce analytics means using data and analytics tools to measure and understand every action your customers take in your online store. You gain the power to track sales, spot trends, and see which marketing efforts work best. When you understand ecommerce analytics, you make smarter decisions that drive growth and improve your bottom line. By focusing on real numbers, you can boost revenue, create better marketing strategies, and deliver a stronger customer experience.
Ecommerce Analytics Explained
What is Ecommerce Analytics
Ecommerce analytics gives you the ability to study and understand every aspect of your online store’s performance. Industry experts define ecommerce analytics as the study of online shopping data, which helps you gain insights into customer behavior, purchase patterns, and marketing performance. You use tools and processes to collect, measure, and analyze ecommerce business data. This approach helps you understand what your customers do, why they buy, and how your marketing efforts perform.
E-commerce analytics covers a wide range of activities. You track website visits, sales transactions, customer feedback, and marketing campaigns. You analyze this data to find patterns and trends. You learn which products sell best, which marketing channels drive the most traffic, and which customers are most valuable. By using ecommerce analytics, you make informed decisions that improve your store’s performance.
Ecommerce analytics is not just about numbers. You use it to answer important questions about your business. You discover what works and what needs improvement. You see the impact of your decisions in real time.
E-commerce analytics tools help you collect and organize data from many sources. You can use basic tools if you run a small business, or advanced platforms if you manage a large online store. The table below shows some popular tools and the types of data they collect:
| Tool Name | Type of Data Collected | Purpose of Use |
|---|---|---|
| Google Analytics | Quantitative data (traffic, sales) | Measure traffic sources, customer engagement, and ecommerce metrics. |
| Contentsquare | Quantitative and qualitative data (user behavior, feedback) | Optimize digital journeys and understand customer interactions. |
| Woopra | Customer interaction data | Analyze customer journeys and build real-time profiles across touchpoints. |
| Kissmetrics | Customer-specific data | View key metrics, segment data, and analyze sales funnels. |
E-commerce analytics practices differ based on business size. Small businesses use affordable tools like Google Analytics and Shopify Analytics for essential insights. Mid-sized brands rely on platforms such as Mixpanel and Hotjar for deeper product analytics and visual behavior analysis. Large retailers choose comprehensive solutions like Adobe Analytics and Quantum Metric to manage complex data across multiple channels.
How Ecommerce Analytics Works
Ecommerce analytics follows a clear process. You start by collecting raw data from your website, marketing campaigns, sales transactions, customer support, and supply chain systems. You bring this data together into a unified platform, such as a data warehouse, CRM, or analytics tool. This integration eliminates silos and ensures accuracy.
You analyze the data using statistical methods, segmentation, and attribution modeling. You uncover patterns, trends, and problem areas. You visualize your findings in dashboards, charts, and reports. These visualizations make complex data easy to understand for decision-makers across your team.
You use the insights to take action. You optimize product pages, adjust pricing, refine marketing campaigns, and improve logistics. You continuously test and refine your strategies, learning from results to drive long-term performance improvement.
Here are the typical steps in the ecommerce analytics process:
- Collect: Gather raw data from all sources, including website interactions, marketing campaigns, sales transactions, customer support, and supply chain systems.
- Integrate: Bring this data together into a unified platform to eliminate silos and ensure accuracy.
- Analyze: Apply statistical methods, segmentation, and attribution modeling to uncover patterns, trends, and problem areas.
- Visualize: Present findings in dashboards, charts, and reports, making complex data easy to understand.
- Act: Use insights to implement changes, optimize product pages, tweak pricing, adjust campaigns, or improve logistics.
- Optimize: Continuously test and refine strategies, learning from results to drive long-term performance improvement.
E-commerce analytics technology continues to evolve. You see new trends such as artificial intelligence, machine learning, and augmented reality. These technologies enable personalized shopping experiences, virtual try-ons, and intelligent recommendations. The concept of agentic commerce is also growing, allowing AI to perform tasks autonomously for shoppers. Hyper-personalization is now essential for successful ecommerce strategies, driven by advancements in AI and data analytics.
You measure the return on investment from ecommerce analytics initiatives using several key metrics. You track total revenue, number of orders, number of customers, average order value, purchase frequency, and customer lifetime value. You use A/B testing, control groups, and incremental analysis to assess the impact of your analytics efforts. You see increased revenue from better-targeted marketing and personalized recommendations. You save costs through improved inventory management. You improve customer experience, leading to higher loyalty and retention rates.
E-commerce analytics gives you the tools to understand your business, make smarter decisions, and stay ahead in a competitive market. You use data to drive growth, optimize operations, and deliver better experiences for your customers.
Why Ecommerce Analytics Matters for Online Stores
Key Benefits for Ecommerce Businesses
Ecommerce analytics gives you the ability to unlock powerful advantages for your online store. When you use analytics, you gain a deeper understanding of customer behavior and make smarter decisions that drive growth. You can track every action your customers take, analyze patterns, and respond quickly to changes in the market.
Here are the most commonly reported benefits of ecommerce analytics for online businesses:
- You gain better insight into customer behavior. You can track what customers view, what they buy, and how they interact with your store.
- You refine your marketing strategies. Analytics lets you measure campaign effectiveness in real time and optimize your efforts for higher returns.
- You improve user experience. Analytics tools help you identify areas that need improvement, leading to greater customer satisfaction.
- You optimize inventory management. You use data to understand product performance and demand trends, which helps you keep inventory levels balanced.
- You forecast and plan more accurately. Predictive analytics allows you to anticipate customer demands and market trends.
- You reduce the probability of fraud. Analytics helps you spot suspicious activity and protect your business.
Tip: When you integrate ecommerce analytics into your daily operations, you create a foundation for continuous improvement and smarter decision-making.
FineReport plays a key role in helping ecommerce businesses realize these benefits. With FineReport, you can connect data from multiple sources, including your website, CRM, and supply chain systems. You can create dynamic dashboards and reports that visualize sales trends, customer segments, and marketing performance. This integration eliminates data silos and ensures that you have a unified view of your business.

Improving Sales and Customer Experience
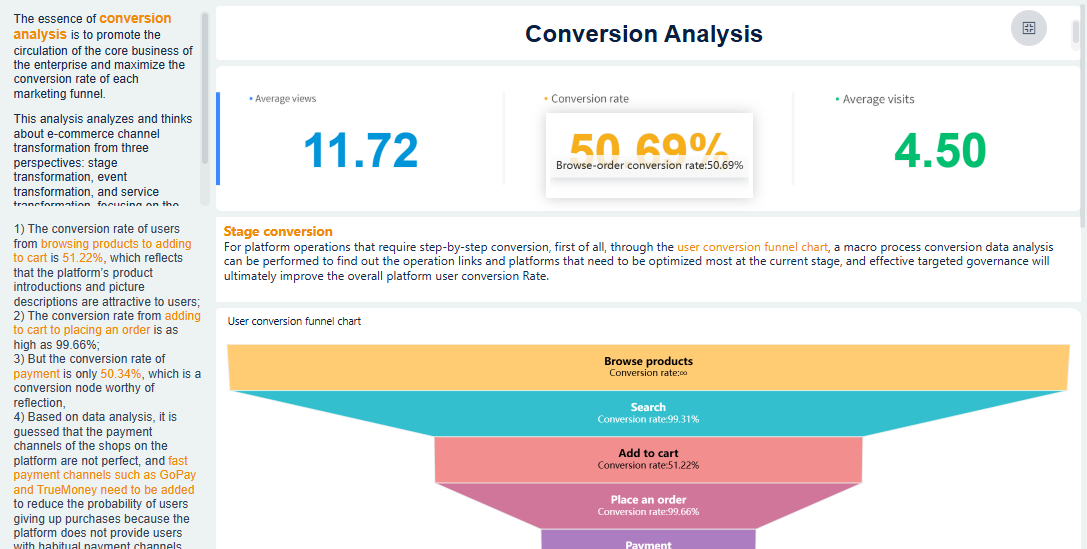
Ecommerce analytics directly impacts your sales and customer experience. You use analytics to identify what drives conversions and where customers drop off in the buying process. By analyzing data, you can personalize marketing efforts, target high-intent visitors, and optimize the user journey.
- Ecommerce analytics provides actionable insights that guide improvements in your store.
- You can see where users disengage, which products have the highest potential, and which micro-conversion indicators matter most.
- By consolidating data from various platforms, you make informed decisions without complex setups.
- Personalization increases the chances of conversions and helps you reduce customer acquisition costs.
- Targeting high-intent visitors and optimizing the user journey are essential for boosting conversion rates.
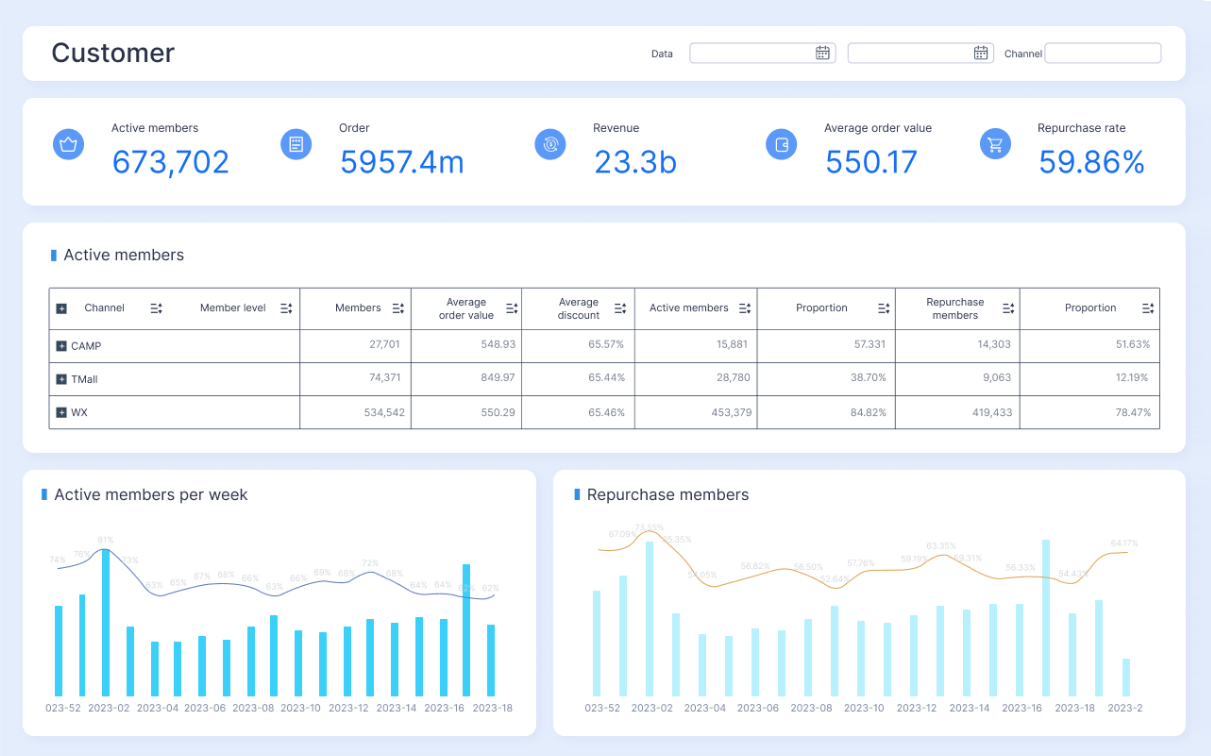
FineReport empowers you to monitor key sales metrics and customer behavior in real time. You can set up dashboards that track conversion rates, average order value, and customer retention. For example, in the retail industry, businesses use FineReport to analyze sales by SKU, store, or campaign. They spot trends and adjust strategies quickly, leading to higher conversions and improved customer satisfaction.
| Evidence | Description |
|---|---|
| 71% of consumers | Expect personalized interactions from companies. |
| 76% of consumers | Feel frustrated when they do not receive personalized experiences. |
| 40% more revenue | Companies that excel at personalization generate significantly more revenue than those that do not. |
Ecommerce analytics helps you identify specific customer segments for targeted marketing. Advancements in AI and machine learning enhance personalization, making it easier to deliver tailored experiences. When you understand user behavior, you can make changes that improve satisfaction and loyalty.
Note: FineReport’s integration capabilities allow you to combine sales, marketing, and customer data for a complete view of your business. This unified approach leads to better decisions and stronger results.
Gaining a Competitive Edge
Ecommerce analytics gives you the tools to outperform competitors and capture more market share. You use analytics to analyze competitor strategies, optimize pricing, and enhance customer experience. When you leverage data-driven insights, you stay ahead of industry trends and respond quickly to changes.
| Evidence Description | Impact |
|---|---|
| Churn reduction of 5% correlates with CLV increases exceeding 25% | Retention outperforms acquisition in profitability |
| Personalized suggestions account for up to 31% of total sales | Personalization drives sales growth |
| A single click on a personalized recommendation correlates with 288% higher conversion rates | Behavioral targeting increases purchase intent |
- A thorough competitor analysis helps you differentiate your store.
- You can optimize pricing strategies based on real-time market data.
- Enhancing customer experience allows you to capture more market share.
FineReport supports your competitive strategy by providing real-time dashboards and standardized KPIs across all channels. Retailers use FineReport to unify data from POS, CRM, ERP, and ecommerce platforms. This integration enables faster, more accurate decisions and helps you spot opportunities before your competitors do.
| Benefit | Description |
|---|---|
| Enhanced Customer Experience | Personalization and targeted marketing lead to higher engagement and improved customer satisfaction. |
| Increased Revenue & Profitability | Optimized pricing, demand forecasting, and customer retention strategies drive higher conversion rates and sales. |
| Operational Efficiency | Automation of data-driven decision-making reduces costs and improves supply chain management. |
| Data-Driven Decision Making | Businesses can make faster, more accurate decisions based on real-time insights and predictive analytics. |
| Fraud Prevention & Security | Advanced anomaly detection minimizes financial risks and enhances trust in ecommerce transactions. |
| Competitive Advantage | Leveraging big data analytics ensures businesses stay ahead of industry trends and outperform competitors. |
Retailers using FineReport have seen measurable improvements in operational efficiency and profitability. For example, FanRuan’s BI platform helps retail businesses break down data silos, standardize KPIs, and deliver actionable insights. This approach leads to smarter product management, optimized inventory, and better customer engagement.
When you adopt ecommerce analytics, you position your online store for long-term success. You make decisions based on facts, not guesswork, and you build a business that adapts quickly to changing market conditions.
Types of Ecommerce Analytics
Descriptive, Predictive, and Prescriptive Analytics
You encounter three main types of ecommerce analytics when you analyze your online store’s performance. Each type serves a unique purpose and helps you make better decisions. Descriptive analytics interprets past results and gives you a clear picture of what happened in your ecommerce business. You use descriptive analytics as the foundation for deeper analysis. Without it, you cannot progress to predictive or prescriptive analytics.
Predictive analytics uses historical data to forecast future performance. You can anticipate trends, customer behavior, and sales outcomes. This helps you plan inventory and marketing strategies with greater accuracy.
Prescriptive analytics develops strategies for predicted scenarios. You receive recommendations on what actions to take to achieve your goals. This type of analytics guides you in optimizing pricing, promotions, and customer engagement.
Here is a table that summarizes the differences:
| Type of Analytics | Purpose |
|---|---|
| Descriptive Analytics | Analyzes historical data |
| Predictive Analytics | Forecasts future performance |
| Prescriptive Analytics | Develops strategies for predicted scenarios |
Digital Shelf Analytics Overview
Digital shelf analytics plays a critical role in ecommerce. You use digital shelf analytics to monitor and optimize your products’ visibility and sales across online platforms. This approach helps you understand digital shelf performance and improve your store’s results.
- Digital shelf analytics provides insights into search rankings. You see how your products rank by keywords, which is crucial for improving visibility.
- You monitor and optimize product content across various platforms. Consistency and compliance enhance product visibility.
- Analytics tools track pricing and promotions. You adjust strategies based on competitor pricing and trends, optimizing sales.
- Daily stock availability reporting helps you manage supply chains. You ensure products are available when customers want to buy.
- You analyze customer ratings and reviews. This helps you optimize product offerings and influence purchase behavior, directly impacting sales.
You rely on digital shelf analytics to gain a competitive edge in ecommerce. By tracking digital shelf performance, you make informed decisions that boost product visibility, increase sales, and improve customer satisfaction.
Essential Metrics and Analytics Tools in Ecommerce Analytics
Key Ecommerce Metrics to Track
You need to track the right metrics to measure the success of your online store. Ecommerce analytics helps you focus on the numbers that matter most for growth and improvement. Here are the top five metrics you should monitor:
- Conversion rate
- Average order value
- Customer lifetime value
- Customer acquisition cost
- Return on investment
Conversion rate shows how well your online store turns visitors into buyers. You calculate it by dividing the number of purchases by the total number of visitors. A higher conversion rate means your site is effective at convincing people to buy. Average order value tells you how much customers spend each time they shop. You can increase this by using cross-selling and upselling strategies. Customer lifetime value measures the total revenue you earn from a customer over time. Customer acquisition cost shows how much you spend to get a new customer. Return on investment helps you see if your marketing and sales efforts pay off.
Tracking these metrics gives you actionable insights. You can see which strategies work and where you need to improve. For example, improving your conversion rate can boost online sales without extra traffic costs. Monitoring average order value helps you understand customer spending and adjust your offers.
Choosing Analytics Tools for Your Online Store
Selecting the right analytics tools is important for your ecommerce business. You want tools that collect data on sales and customer behavior. Good analytics tools help you analyze information and track key performance indicators. Look for platforms that offer strong data collection, advanced analysis, and easy KPI tracking. These features help you gain actionable insights and support conversion rate optimization.
Finereport for Ecommerce Analytics
FineReport stands out as a leading analytics and reporting tool for ecommerce. It offers advanced dashboard creation, multi-dimensional report design, and integrated AI charting. You can generate pixel-perfect reports for financial needs and deploy the tool with your existing systems. FineReport supports real-time updates and seamless data integration, making it easy to track the customer journey and online sales. The user-friendly interface encourages adoption across your team. Compared to other tools like Shopify Analytics, Kissmetrics, and Adobe Analytics, FineReport provides flexible pricing and broad access to analytics. This makes it a strong choice for online store owners who want actionable insights and best practices for ecommerce analytics.
| Feature Description | Relevance to Ecommerce Analytics |
|---|---|
| Advanced dashboard creation | Enables visualization of key ecommerce metrics in real-time |
| Multi-dimensional report design | Facilitates in-depth analysis of sales data across various dimensions |
| Integrated AI charting functionality | Enhances data interpretation through intelligent visualizations |
| Pixel-perfect report generation | Ensures high-quality reports for financial and compliance needs |
| Versatile deployment options | Allows integration into existing ecommerce systems |
| Concurrent user licensing model | Reduces costs for broad access to analytics |
Applying Ecommerce Analytics to Boost Ecommerce Performance
Real-world Use Cases and Best Practices
You can transform your ecommerce business by applying analytics to everyday operations. Many retailers use ecommerce analytics to unify data from sales, marketing, and inventory systems. For example, FanRuan’s retail solution helps you break down data silos and create a single source of truth. You gain a clear view of product performance, customer engagement, and user experience across all channels.
UnionPay Data Services improved its digital transformation by adopting a centralized analytics platform. The company increased system efficiency and identified valuable customers by analyzing credit card revenue data. You can follow similar steps to boost your own results:
- Define clear objectives for what you want to measure.
- Select analytics tools that match your business needs.
- Set up tracking to capture user interactions and customer engagement.
- Create dashboards to visualize key performance indicators.
- Analyze data to spot trends and patterns.
- Take action to optimize your strategies.
- Monitor results and refine your approach.
Tip: Develop a change management plan and identify stakeholders to ensure that insights lead to real improvements.
Choosing tools with cross-channel reporting capabilities streamlines your analysis and reduces manual reporting time. You improve user experience by acting on insights and personalizing your store for different customer segments.
Overcoming Common Challenges
You may face several obstacles when implementing ecommerce analytics. Data silos and fragmented technology stacks often make it hard to get a unified view. Poor governance and trust in data can slow down decision-making. Integrating various tools and systems adds complexity. Shopping cart abandonment and inconsistent user experience remain persistent issues.
Retailers have overcome these challenges by adopting centralized data platforms and robust validation processes. Advanced integration technologies, such as API-driven architectures and cloud-based data warehousing, help you share information seamlessly. Improving data quality management and governance frameworks ensures reliable insights.
To avoid common pitfalls:
- Address departmental silos by centralizing your data.
- Invest in tools that support seamless integration.
- Focus on consistent user experience across all touchpoints.
- Monitor security and fraud risks to protect your business.
You can boost ecommerce performance by following best practices and learning from successful companies. Analytics empowers you to make informed decisions, improve customer engagement, and deliver a better user experience.

Ecommerce analytics drives success for your online store by turning data into actionable insights. You can focus on key metrics like average order value, customer lifetime value, and conversion rate to boost growth:
| Metric/Strategy | Importance in Ecommerce Success |
|---|---|
| Average Order Value | Increases revenue through upselling and better shopping journeys. |
| Customer Lifetime Value | Improves retention and long-term profit. |
| Conversion Rate | Measures how well you turn visitors into buyers. |
To get started, collect data, set up automated reporting, and share insights with your team. Using analytics tools like FineReport helps you overcome data silos and make informed decisions. When you adopt data-driven strategies, you gain a strong competitive edge in ecommerce.

Continue Reading About Ecommerce Analytics
How to Do Retention Analysis for Business Success
What is Pareto Chart and How Does it Work
How DuPont Analysis Helps You Understand Your Business


FAQ

The Author
Lewis
Senior Data Analyst at FanRuan
Related Articles
What is Ad-Hoc Analysis and Why is it Important
Ad-hoc analysis lets you answer unique business questions instantly, offering flexible, real-time insights that drive smarter, faster decisions.
Lewis
Sep 16, 2025

What Is a Data Model and Why Does It Matter
A data model defines how data is structured and connected, making information easier to manage, analyze, and use for smarter business decisions.
Lewis
Aug 04, 2025

Break Even Analysis Made Easy with Practical Step-by-Step Instructions
Break even analysis explained step by step with real examples. Calculate your break-even point, set sales goals, and make smarter business decisions.
Lewis
Jul 16, 2025