You want your marketing campaigns to succeed in 2026. A marketing analytics dashboard gives you the power to see what’s happening right now. With real-time data, you can spot trends, track marketing performance, and adjust your dashboard strategy instantly. Teams get actionable insight and respond to marketing changes fast. You don’t have to wait for reports—just check your dashboard and see how your marketing efforts perform. As you explore dashboard templates from top platforms like FineReport by FanRuan, think about your business goals and how your dashboard will connect your data for smarter analytics.Below are 12 Marketing Analytics Dashboard Templates you can try:
- FineReport
- Google Analytics
- HubSpot
- Power BI
- Tableau
- Klipfolio
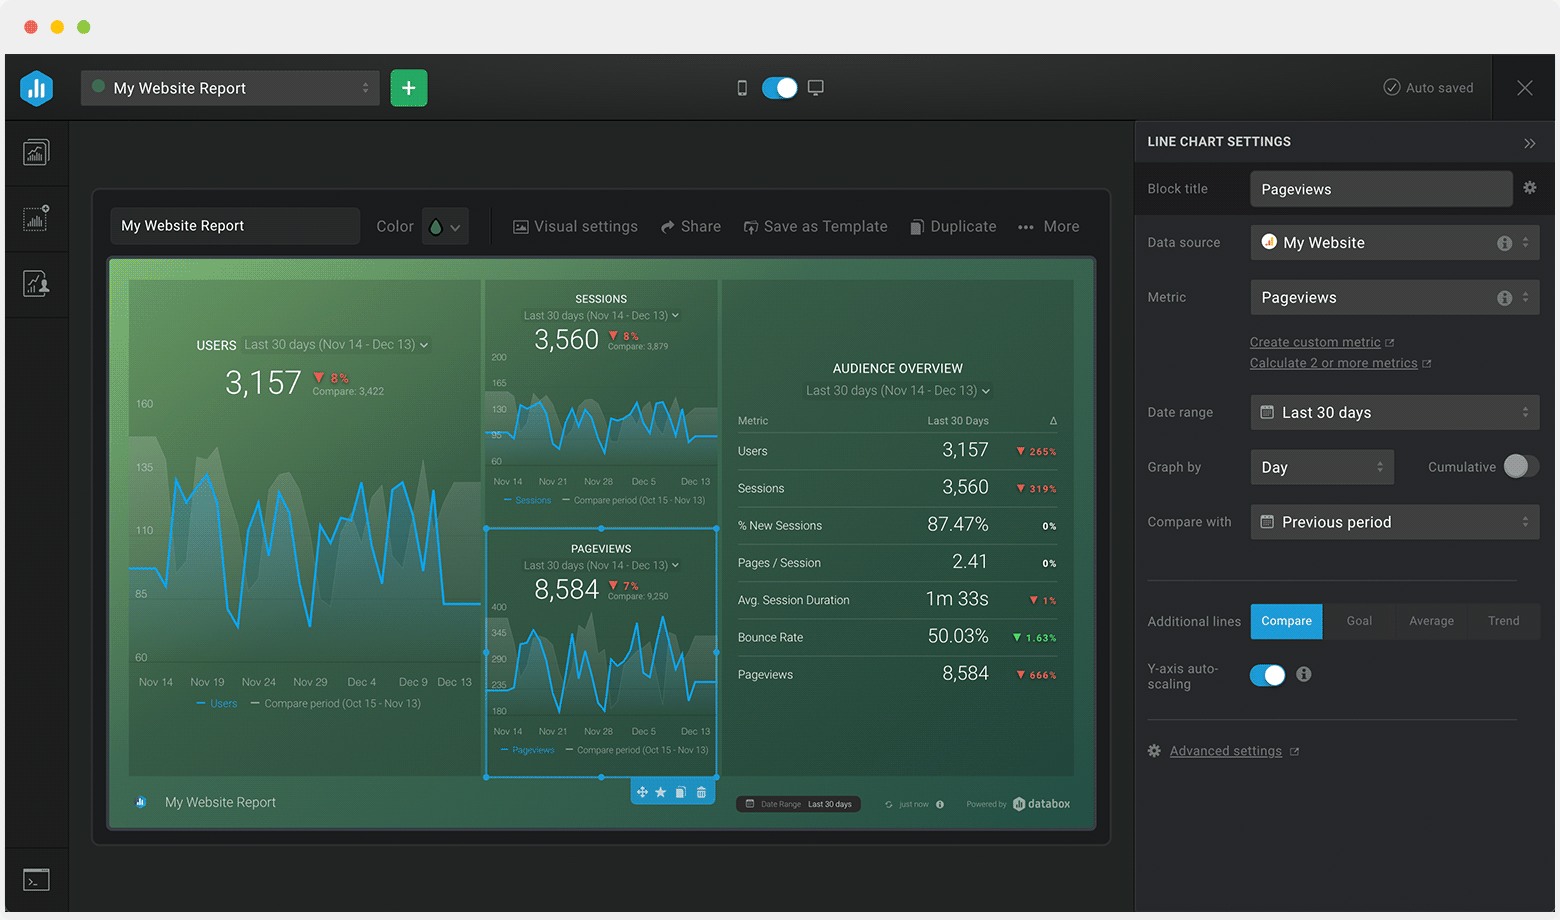
- Databox
- Domo
- Looker Studio
- Zoho
- Salesforce
- Supermetrics
Best Marketing Analytics Dashboard Templates for 2026
Choosing the right marketing dashboard can make your campaigns smarter and more successful. You want a dashboard that gives you real-time insights, connects all your data, and helps you track the metrics that matter. Let’s look at the top marketing dashboard templates for 2025. Each one offers unique features for different marketing channels, so you can find the best fit for your business.
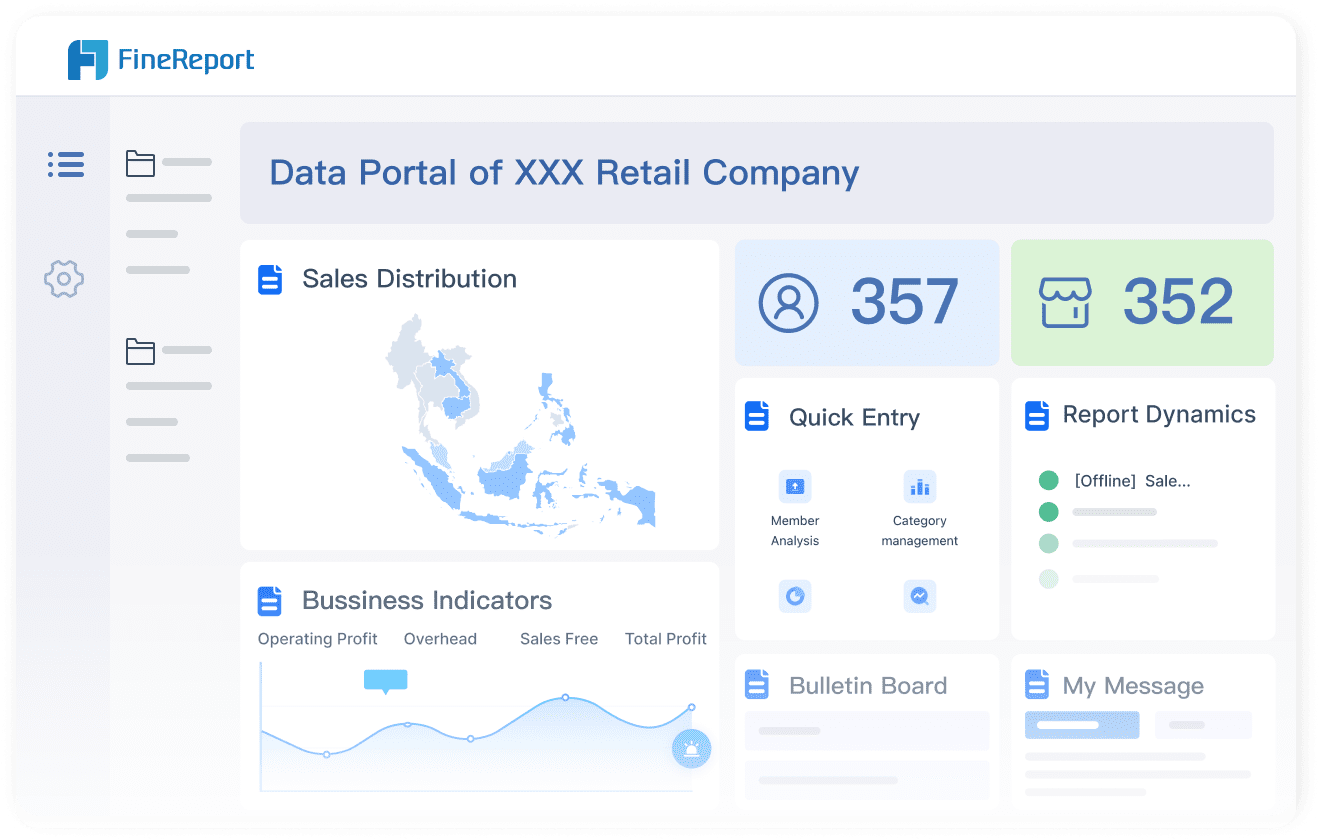
1.FineReport Marketing Analytics Dashboard (FanRuan)
Wbesite: https://www.fanruan.com/en/finereport
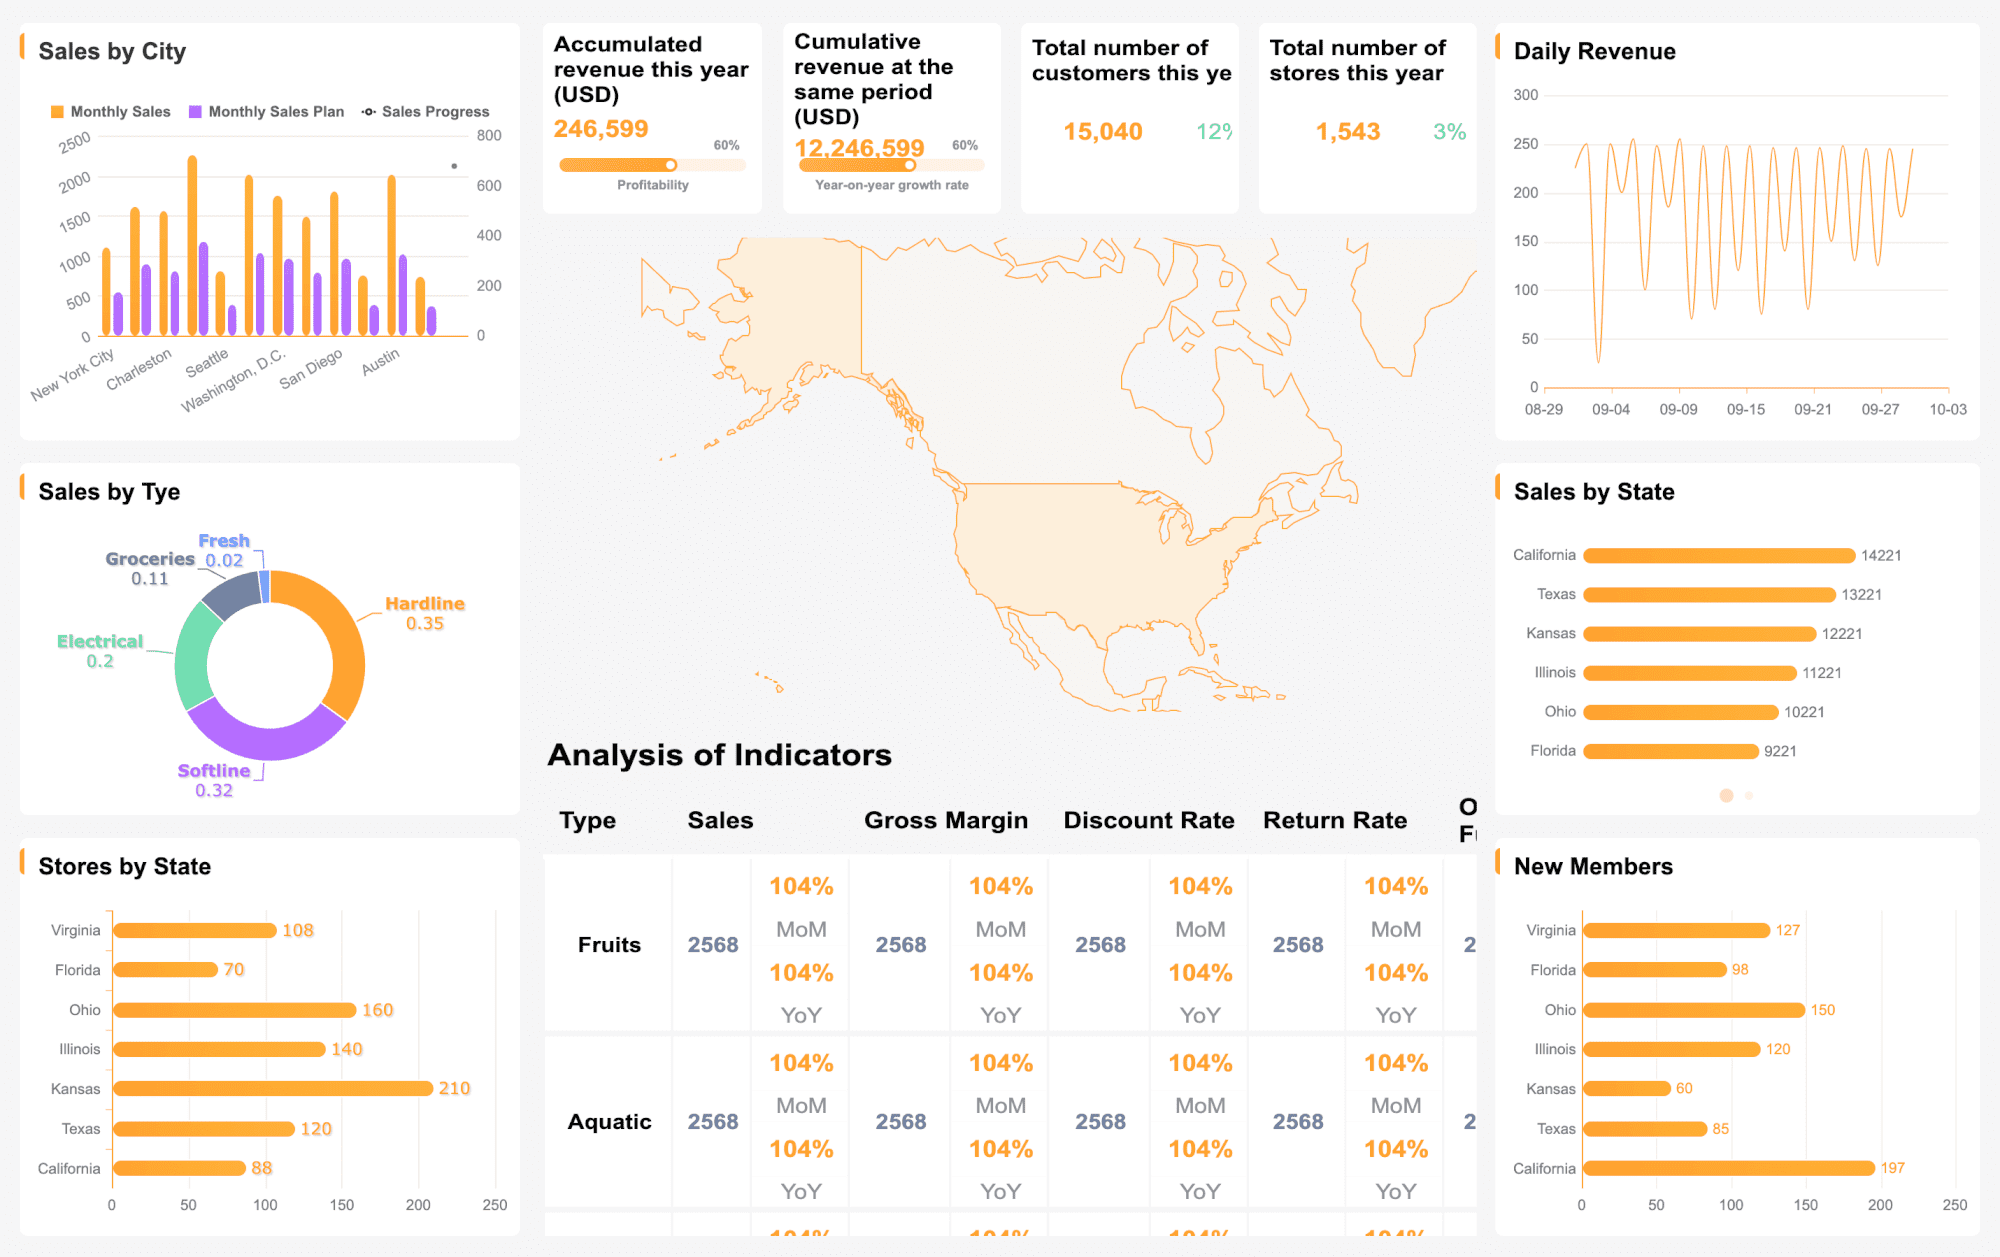
FineReport by FanRuan stands out as a powerful marketing analytics dashboard. You get seamless integration with over 100 data sources, including databases, spreadsheets, and cloud platforms. The drag-and-drop designer makes it easy to build custom dashboards for any marketing channel—SEO, PPC, social media, or email. You can visualize marketing performance dashboard metrics in real time and drill down into campaign details.

FineReport supports multi-channel marketing dashboards, so you can combine data from Google Ads, Facebook, and more. The dashboard layout is fully customizable, letting you display sales performance, customer segmentation, and channel analytics side by side. You can access your marketing dashboard on any device, thanks to responsive design and mobile BI features. FineReport’s decision-making platform centralizes all your dashboards, making collaboration and data sharing simple.
Tip: FineReport’s integration with FineDataLink lets you synchronize data across systems in milliseconds. You never miss a beat when tracking marketing performance dashboard metrics.
Best Use Case:
You want a flexible marketing dashboard template for unified campaign tracking, deep visualization, and instant insights.
Notable Features:
- Real-time data integration
- 3D and animated visualizations
- Mobile and cross-device access
- Automated report scheduling
- Multi-source data connectors

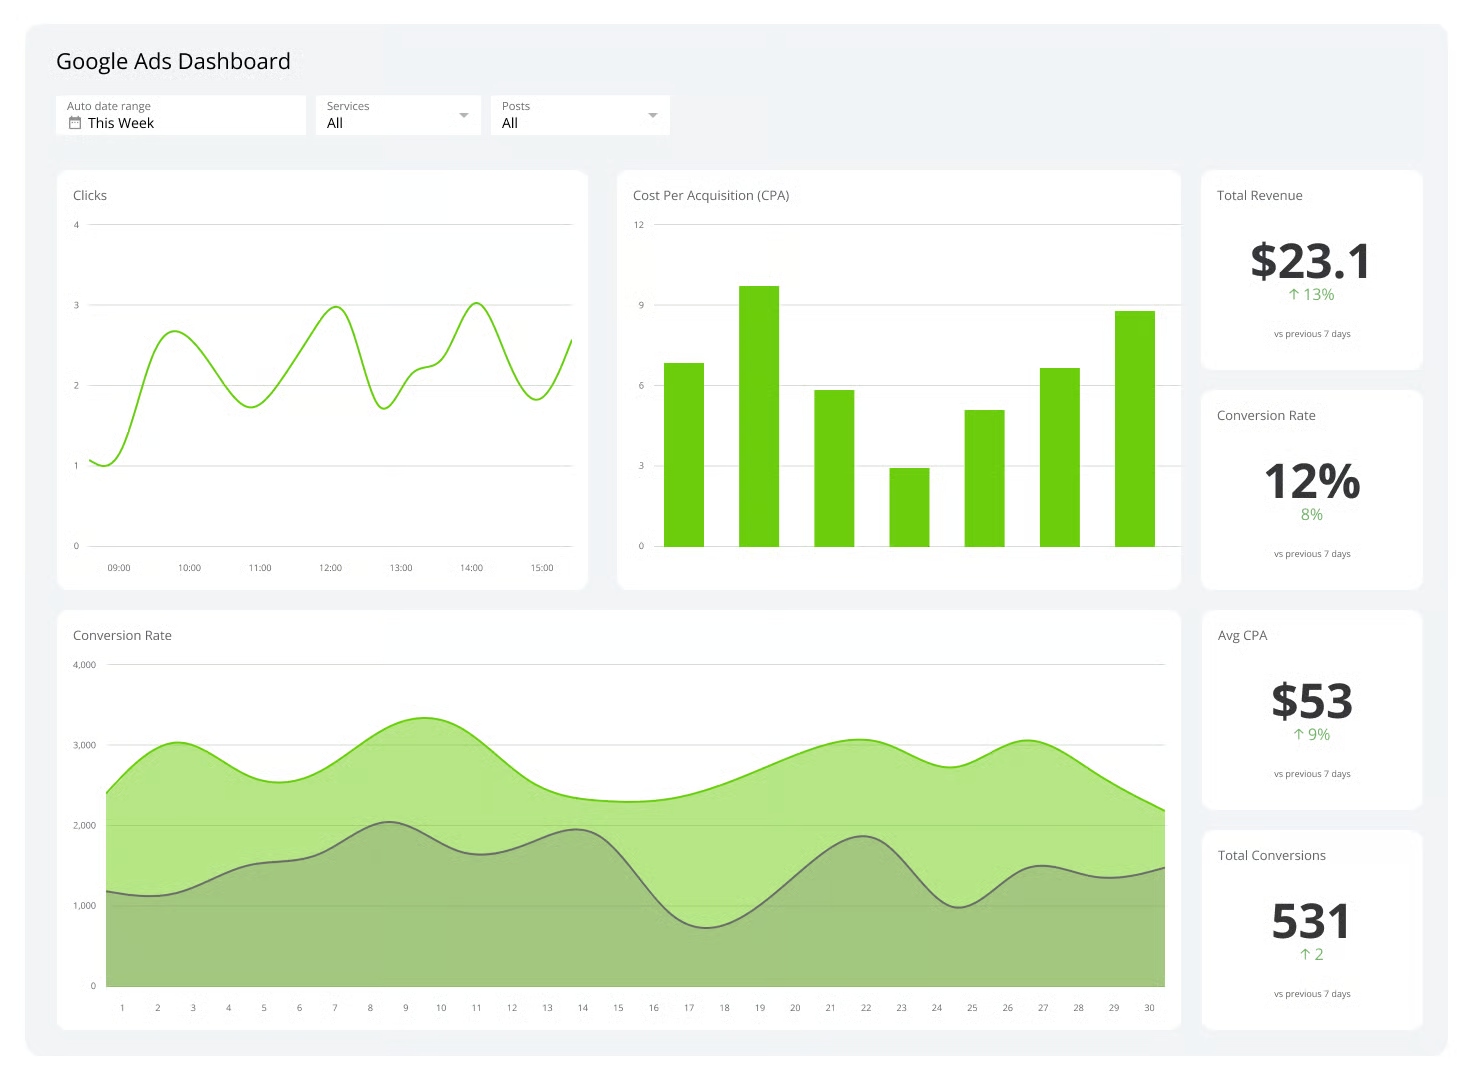
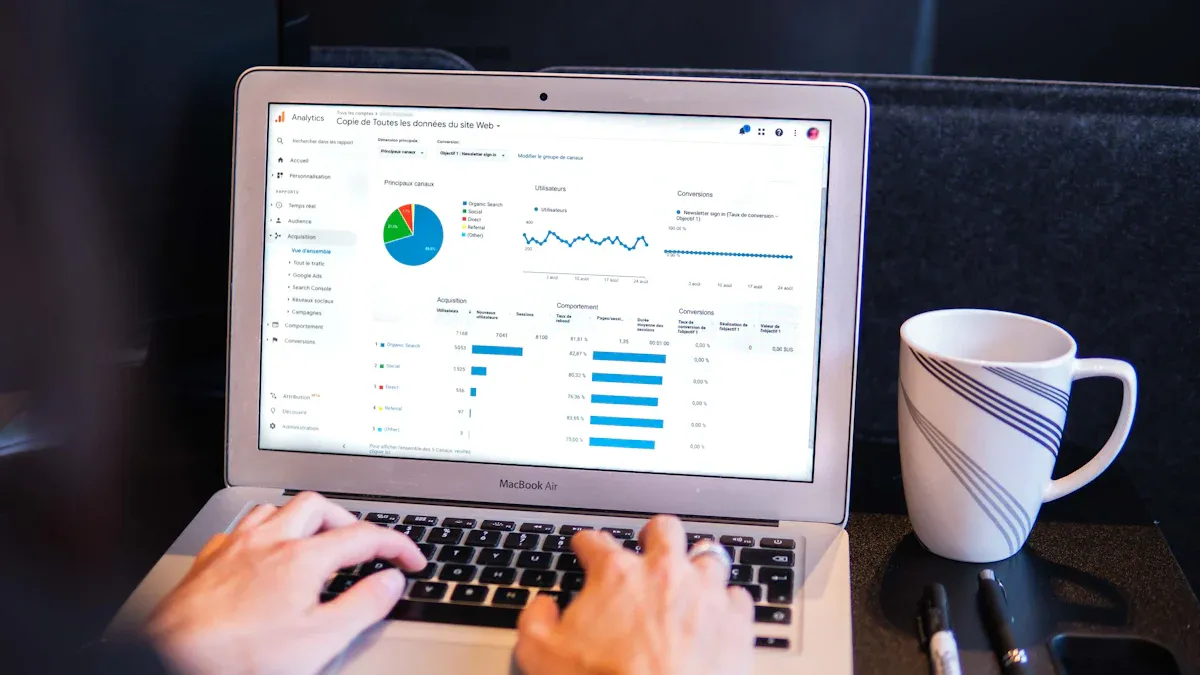
2.Google Analytics Dashboard

Wbesite: https://developers.google.com/analytics
Google Analytics dashboard templates help you monitor website traffic, user behavior, and conversion rates. You can track marketing performance dashboard metrics like bounce rate, session duration, and goal completions. The dashboard gives you a clear view of which channels drive traffic and conversions.
You can customize your marketing dashboard to show demographics, device usage, and referral sources. Google Analytics dashboards are perfect for tracking SEO and content marketing campaigns. You get instant access to website analytics and can spot trends quickly.
Best Use Case:
You want to analyze website performance and optimize your digital marketing dashboard strategy.
Notable Features:
- Real-time website tracking
- Customizable dashboard widgets
- Integration with Google Ads and Search Console
- Automated reporting
3.HubSpot Marketing Dashboard
Wbesite: https://www.hubspot.com/
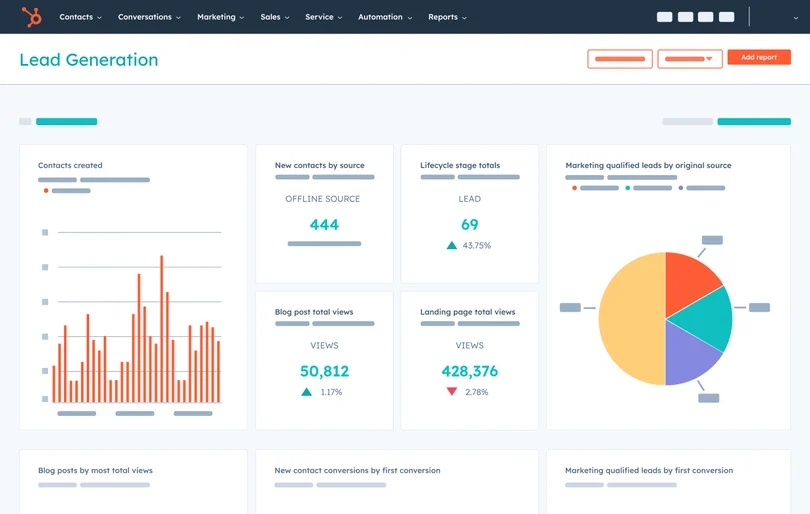
HubSpot marketing dashboard templates focus on inbound marketing, lead generation, and campaign tracking. You can monitor website analytics, email campaigns, social media performance, and executive marketing KPIs. The dashboard helps you see which marketing efforts bring in leads and drive engagement.
You get a clear overview of your marketing dashboard metrics, including conversion rates and delivery rates for email campaigns. HubSpot dashboards are easy to share with your team, making collaboration simple.
Best Use Case:
You want to track inbound marketing campaigns and measure lead generation effectiveness.
Notable Features:
- Lead generation tracking
- Email and social media analytics
- Executive marketing overview
- Customizable dashboard templates
Here are some must-have HubSpot marketing dashboard examples:
- Website analytics dashboards
- Lead generation dashboards
- Email campaign dashboards
- Social media performance dashboards
4.Power BI Marketing Dashboard
Wbesite: https://www.microsoft.com/en-us/power-platform/products/power-bi
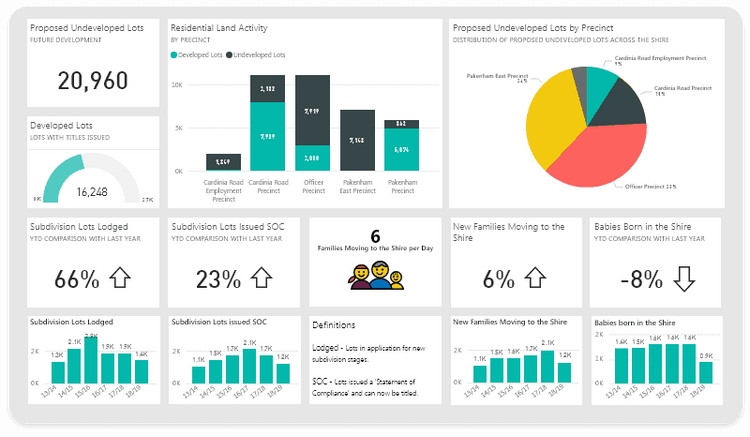
Power BI marketing dashboard templates offer advanced data integration and visualization. You can connect Power BI to CRM systems like Salesforce, HubSpot, and Microsoft Dynamics 365. The dashboard updates instantly when data changes in your CRM, so you always see the latest marketing performance dashboard metrics.
You can create dashboards that combine sales, marketing, and customer journey data. Power BI marketing dashboards help you eliminate blind spots by merging datasets into a unified view. You get interactive charts and reports that make analysis easy.
Best Use Case:
You want to integrate data from multiple platforms and visualize complex marketing analytics dashboard metrics.
Notable Features:
- Native CRM connectors
- Real-time dashboard updates
- Interactive visualizations
- Automated reporting
Power BI connects with various CRM systems for continuous data flow. Changes in CRM are reflected instantly in marketing dashboards.
5.Tableau Marketing Dashboard
Wbesite: https://www.tableau.com/
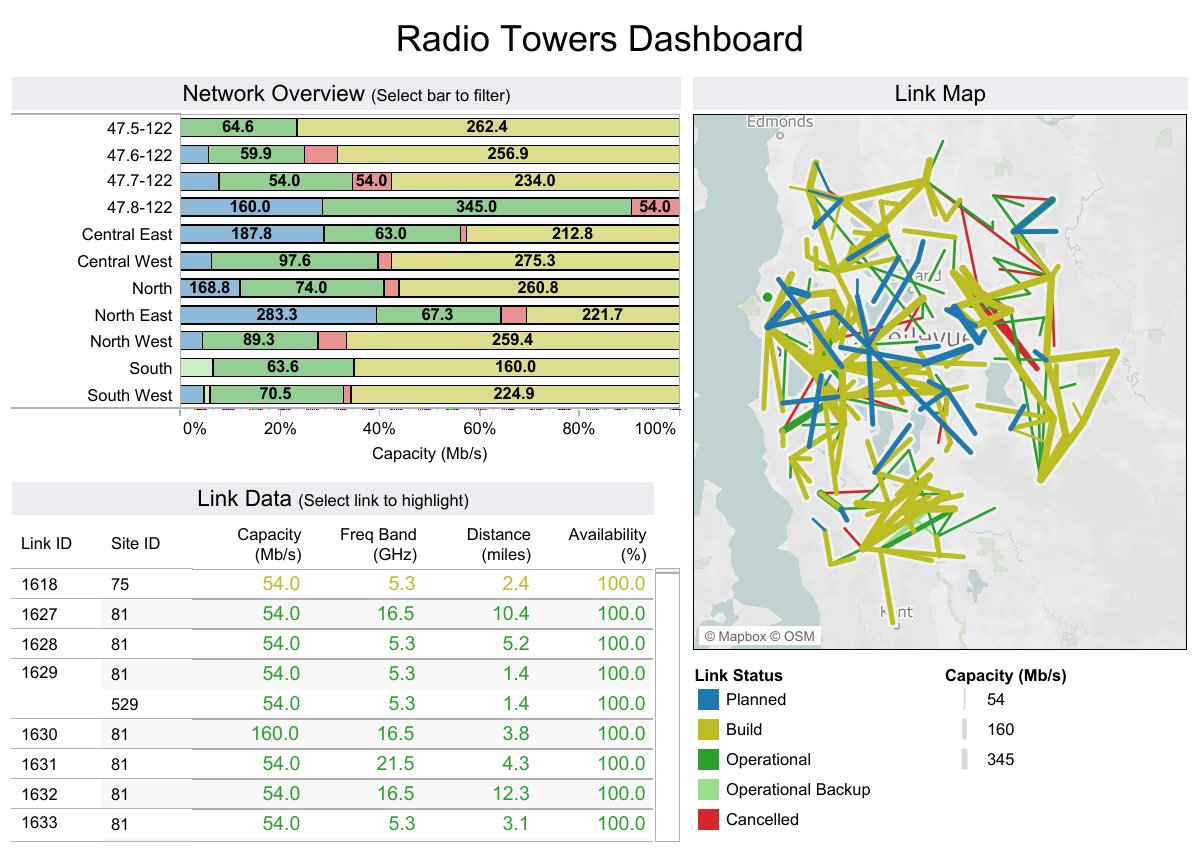
Tableau marketing dashboard templates give you advanced visualization options for campaign analysis. You can use bump charts to track performance changes, box plots to see data distribution, and bullet graphs for compact metric comparisons. Tableau dashboards help you spot trends and outliers quickly.
You can build dashboards for different marketing channels, like PPC, SEO, and social media. Tableau’s drag-and-drop interface makes it easy to customize your dashboard layout and add interactive elements.
Best Use Case:
You want to analyze complex marketing data and visualize campaign trends.
Notable Features:
- Bump charts, box plots, bullet graphs
- Tree maps and waterfall charts
- Motion and bubble charts
- Interactive dashboard design
| Visualization Type | Description |
|---|---|
| Bump Charts | Track performance changes and compare entities over time. |
| Box Plots | Summarize data distribution and identify trends. |
| Bullet Graphs | Compare primary measures in limited space. |
| Tree Maps | Visualize hierarchical data and spot over/under-performing categories. |
| Waterfall Charts | Show cumulative effects of sequential values. |
| Motion Charts | View data changes over time. |
| Bubble Charts | Visualize relationships and patterns in multivariate data. |
6.Klipfolio Digital Marketing Dashboard
Wbesite: https://www.klipfolio.com/
Klipfolio digital marketing dashboard templates centralize key social media KPIs. You can visualize the results of your marketing efforts and monitor campaign performance in real time. The dashboard connects directly to data sources, so you don’t need manual spreadsheets.
You can share insights instantly and make confident decisions based on up-to-date information. Klipfolio marketing dashboards are perfect for tracking social media campaigns and engagement.
Best Use Case:
You want to monitor social media marketing campaigns and share insights with your team.
Notable Features:
- Real-time social media monitoring
- Direct data source connections
- Instant sharing and collaboration
- Customizable dashboard widgets
Klipfolio enables real-time monitoring of social media campaign performance. Users can share insights instantly and make confident decisions.
7.Databox Campaign Performance Dashboard
Wbesite: https://databox.com/
Databox campaign performance dashboard templates help agencies and marketing teams track PPC analytics. You can monitor multiple PPC accounts from a single dashboard, simplifying internal reviews. The dashboard aligns teams on key metrics and provides context for ROI and ROAS.
You can access your marketing dashboard on mobile devices, making it easy to check data anytime. Databox automates dashboard creation, alerts, and scheduled reports, saving you time.
Best Use Case:
You want to track PPC campaigns and streamline reporting for clients.
Notable Features:
- Multi-account PPC monitoring
- Custom metrics and data calculations
- Mobile app access
- Automated reporting and alerts
- Scalable dashboard templates
| Advantage | Description |
|---|---|
| Client Performance Overview | Monitor multiple PPC accounts from a single view. |
| Metrics Screen | Align teams on key metrics for PPC reporting. |
| Mobile App | Access data anytime, improving client relationships. |
| Custom Metrics | Create tailored dashboards with relevant metrics. |
| Data Calculations | Context for PPC performance with calculated metrics. |
| Automate Reporting | Save time with automated dashboard creation and alerts. |
| Scalability | Streamline reporting and onboard new accounts efficiently. |
8.Domo Marketing Dashboard
Wbesite: https://www.domo.com/
Domo marketing dashboard templates enable collaboration among marketing teams. You can create shareable dashboards, so everyone has access to the same data. The dashboard consolidates marketing, sales, and finance data into a single view.
Domo’s productivity tools allow for real-time data updates and direct communication within the platform. You can assign tasks, discuss data, and interact seamlessly using the chat tool, Buzz.
Best Use Case:
You want to enhance team collaboration and track marketing performance dashboard metrics across departments.
Notable Features:
- Shareable dashboards
- Real-time data updates
- Integrated chat and task assignment
- Unified view of marketing, sales, and finance data
Domo consolidates marketing, sales, and finance data into a single view. Clear data sharing enables faster decision-making and enhances team collaboration.
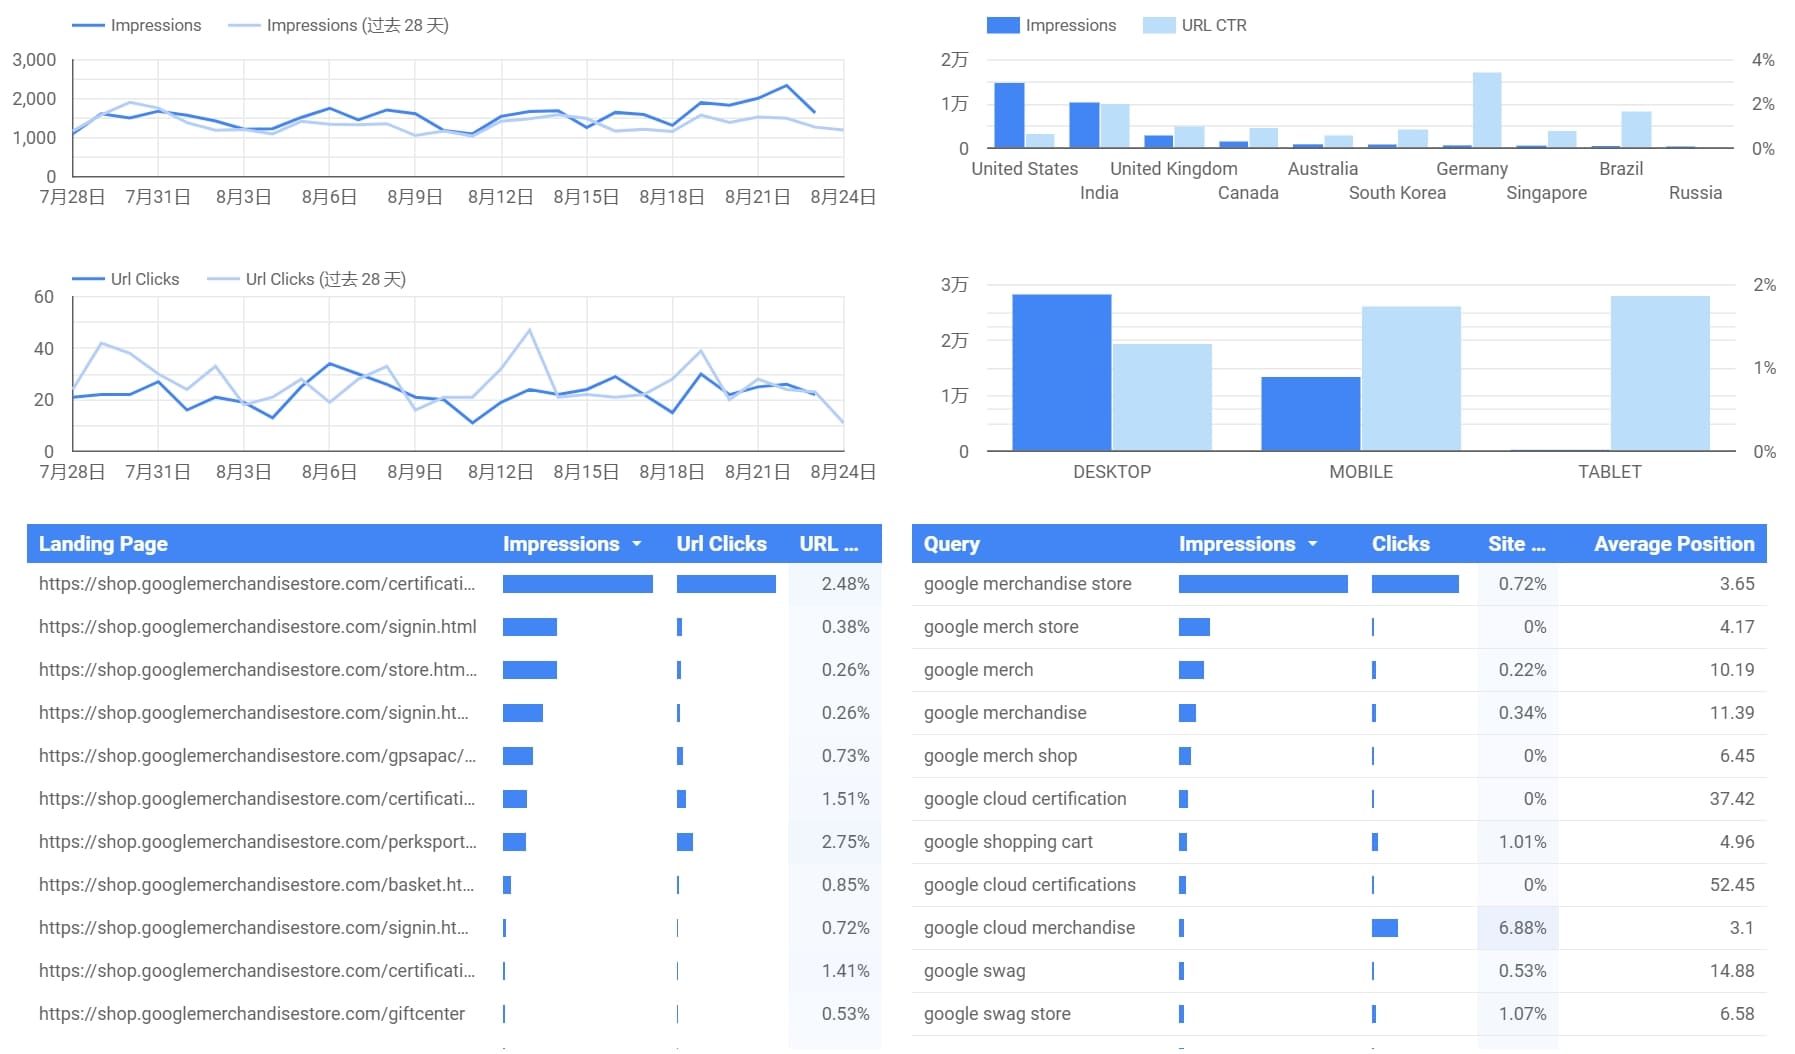
9.Looker Studio (Google Data Studio) Dashboard
Wbesite: https://lookerstudio.google.com/navigation/reporting
Looker Studio marketing dashboard templates offer powerful integration capabilities. You can connect to Google Ads, Google Analytics, BigQuery, and non-Google services like Facebook, Twitter, and Salesforce. The dashboard centralizes data from various marketing platforms and provides real-time insights.
You can use customizable templates for quick cross-channel analysis, focusing on strategy instead of data prep. Looker Studio marketing dashboards streamline analysis and help you make informed decisions.
Best Use Case:
You want to centralize marketing data and analyze cross-channel campaigns.
Notable Features:
- Native connectors for Google and non-Google platforms
- Real-time insights
- Customizable dashboard templates
- Streamlined cross-channel analysis
| Integration Source | Description |
|---|---|
| Google Products | Native connectors for Google Ads, Google Analytics, and BigQuery. |
| Non-Google Services | Connectors for Facebook, Twitter, Salesforce, and more. |
| Customizable Templates | Quick cross-channel analysis for marketing dashboards. |
10.Zoho Analytics Marketing Dashboard
Wbesite: https://www.zoho.com/
Zoho Analytics marketing dashboard templates help you track key marketing metrics like CTR, CVR, CPC, CPA, CPL, ROAS, CAC, and LTV. You can visualize funnel conversions, pipeline contribution, and cohort retention. The dashboard supports multi-channel integration, so you can analyze data from SEO, email, and social media.
You get interactive charts and automated reporting features. Zoho Analytics marketing dashboards are ideal for tracking campaign effectiveness and optimizing marketing spend.
Best Use Case:
You want to monitor detailed marketing metrics and optimize campaign performance.
Notable Features:
- Multi-channel integration
- Interactive charts and reports
- Automated reporting
- Customizable dashboard templates
Zoho Analytics marketing dashboards visualize metrics like CTR, CVR, CPC, CPA, CPL, ROAS, CAC, LTV, funnel conversions, pipeline contribution, and cohort retention.
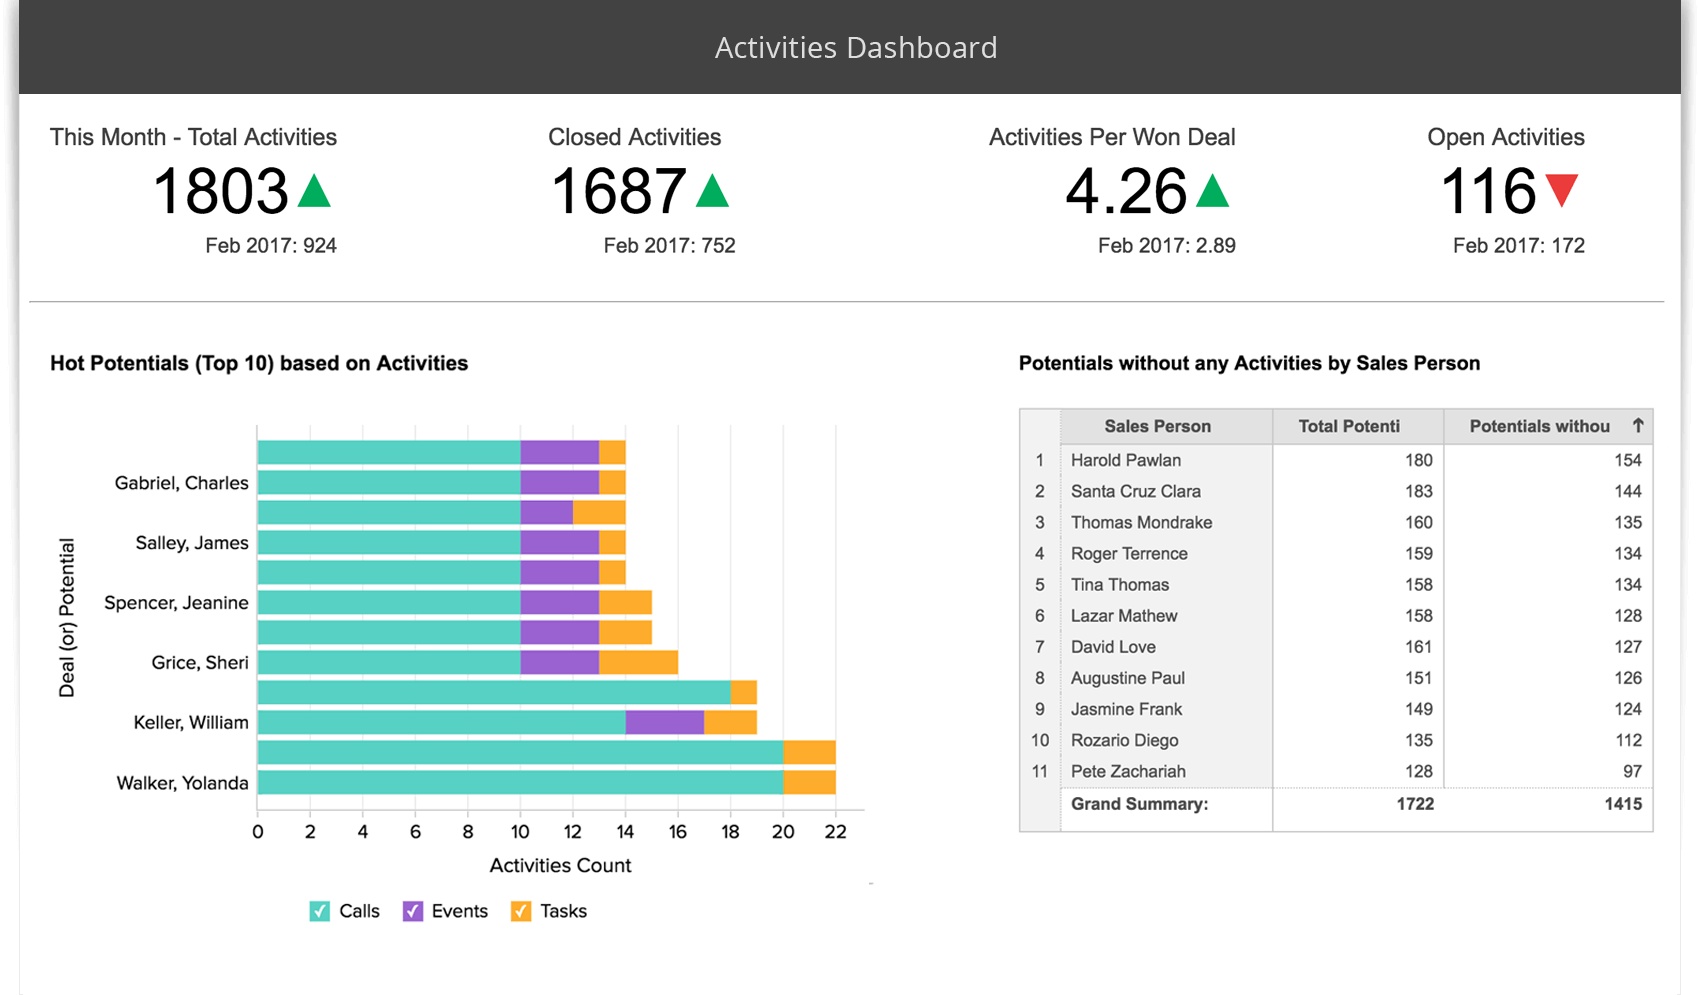
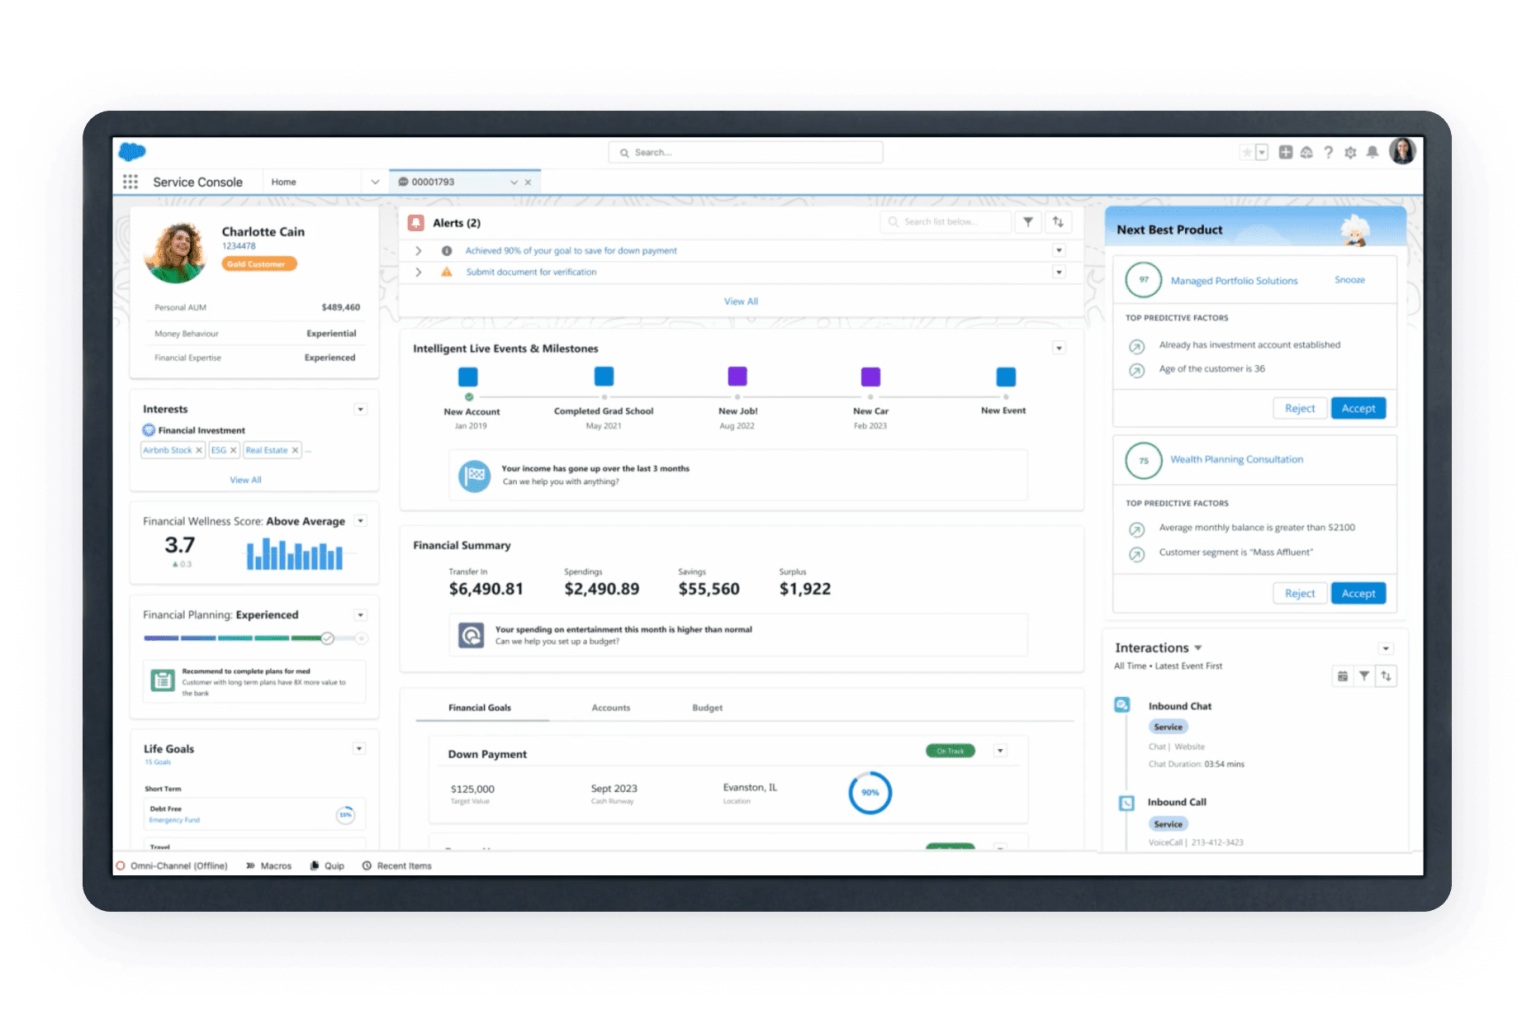
11.Salesforce Marketing Analytics Dashboard
Wbesite: https://www.salesforce.com/ap/
Salesforce marketing analytics dashboard templates support lead tracking and campaign ROI measurement. You can organize and monitor marketing initiatives using Campaign Hierarchies. The dashboard tracks budgets, actual spending, and calculates ROI directly within campaigns.
Salesforce marketing dashboards use multi-touch attribution models to clarify the contribution of different touchpoints. You get custom reports and dashboards that break down performance by various metrics.
Best Use Case:
You want to track leads, measure campaign ROI, and connect sales and marketing data.
Notable Features:
- Lead tracking and campaign organization
- Budget and cost tracking
- Multi-touch attribution models
- Custom reports and dashboards
Salesforce Campaigns help organize and monitor marketing initiatives, allowing for a consolidated view of ROI through Campaign Hierarchies.
12.Supermetrics Dashboard for Marketing

Wbesite: https://supermetrics.com/
Supermetrics dashboard templates connect to a wide range of marketing platforms, spreadsheets, and data visualization tools. You can pull data from Facebook Ads, LinkedIn Ads, Google Analytics, and more. The dashboard centralizes campaign analysis and helps you make data-driven decisions.
You can use Supermetrics marketing dashboards with Looker Studio, Power BI, or Tableau for advanced visualization. The dashboard supports automated data transfers and reporting, saving you time.
Best Use Case:
You want to aggregate data from multiple marketing platforms and enhance campaign analysis.
Notable Features:
- Connects to marketing platforms, spreadsheets, and data warehouses
- Automated data transfers and reporting
- Integration with visualization tools
- Customizable dashboard templates
Supermetrics dashboard templates connect to marketing platforms, spreadsheets, data visualization platforms, and cloud storage for enhanced campaign analysis.
Here’s a quick table showing the most widely adopted marketing analytics dashboard templates and their key features:
| Dashboard Type | Key Features | Must-Have KPIs |
|---|---|---|
| Sales Performance Dashboards | Revenue drivers, customer cohorts, true profitability | CAC, ROAS, AOV, LTV, churn rate |
| Channel Dashboards | Optimize campaign spend and ROI across platforms like Google Ads, Facebook | Engagement metrics |
| Customer Segmentation and Retention | Highlight loyalty, churn, and lifetime value opportunities | N/A |
| Product and Marketplace Dashboards | Ensure SKU-level profitability and smart growth strategies | N/A |
| Subscription Dashboards | Track churn, recurring revenue, and payback periods | N/A |
| Saras Pulse | Pre-built, no-code dashboards for eCommerce and DTC brands | N/A |
You can also use marketing dashboard templates that track multi-channel campaigns. These dashboards measure marketing performance dashboard metrics across all channels, provide real-time insights, and combine data from SEO, email, and social media for a holistic view.
When you choose a marketing dashboard, think about your business goals, data integration needs, and the channels you want to track. The right dashboard template will help you visualize marketing analytics dashboard metrics, optimize campaigns, and make smarter decisions.
What Is a Marketing Analytics Dashboard?
Definition and Core Purpose
You might wonder what a marketing analytics dashboard actually does. Think of it as your control center for all things marketing. This dashboard pulls together your most important marketing data and shows it in one easy-to-read place. You can see how your campaigns perform, track your goals, and spot trends as they happen.
A Digital Marketing Dashboard is a tool that is used to track and display KPIs to analyze Marketing and business efforts over time and across multiple channels. It’s also a Marketing agency’s way of communicating the value of their work to their clients.
You don’t have to dig through spreadsheets or wait for reports. The dashboard gives you a real-time view of your marketing analytics. It helps you answer questions like, “Which channel brings in the most leads?” or “How did last week’s campaign perform?” With a dashboard, you get a visual summary of your marketing analytics, so you can make smarter decisions fast.
A marketing dashboard is a visual representation of key performance indicators (KPIs) and relevant data about or connected to your company’s marketing efforts.
Why Dashboards Matter for Campaigns
Dashboards play a huge role in modern marketing analytics. You want to know what’s working and what needs to change. A dashboard makes this easy. It brings all your analytics together, so you can see the big picture and the small details.
Here’s how a dashboard helps you run better campaigns:
- Automates data collection, saving you hours on manual reporting.
- Simplifies visualization, so you can spot trends and outliers quickly.
- Provides a centralized view of performance metrics, making decisions easier.
- Makes it simple to share campaign results with your team or clients.
- Reduces human error, so your reports stay accurate.
You can use a marketing analytics dashboard to track everything from website visits to ad spend. It helps you stay on top of your marketing analytics and react quickly to changes. With the right dashboard, you turn raw data into insights that drive your marketing forward.
Essential Features of Marketing Analytics Dashboards
You want your marketing dashboard to work hard for you. In 2025, the best marketing dashboards give you instant access to marketing data, real-time performance, and actionable insight. Let’s break down the must-have features that make a marketing analytics dashboard truly effective.
Real-Time Data and Integration
You need your dashboard to show what’s happening now. Real-time data integration means you see marketing performance as it unfolds. FineReport excels here, connecting to over 100 sources and syncing marketing data in milliseconds. This lets you adjust campaigns fast and spot trends before your competitors. Take a look at how real-time integration powers your marketing dashboard:
| Aspect | Explanation |
|---|---|
| Data-Driven Decision Making | Real-time insights empower you to make smart choices about your marketing strategies. |
| Timely Adjustments | Immediate data lets you change tactics if a campaign isn’t working. |
Multi-source integration is key. Your dashboard should pull marketing data from ecommerce platforms, social media, and ad networks. Automated syncing keeps your analytics fresh and reliable.
Customizable Dashboard Layouts
You want your marketing dashboard design to fit your needs. Customizable layouts let you organize marketing data, ecommerce metrics, and segmentation results in ways that make sense for your team. FineReport’s drag-and-drop designer makes this easy. Here’s why customization matters:
- Time Efficiency: Automation frees up time for strategy and analysis.
- Consistency and Accuracy: Automated reports reduce human error, giving you reliable insight.
- Proactive Campaign Management: Real-time alerts help you optimize marketing performance.

Interactive elements, like filters and drill-downs, help you explore ecommerce data and performance insights quickly.
Key Marketing KPIs and Metrics
Tracking the right kpis is essential. Your dashboard should highlight marketing roi, conversion rate, engagement metrics, and ecommerce sales. You want to see cost per lead, website traffic, follower growth, and segmentation results. These kpis show how your marketing dashboard drives performance and insight.
Marketing KPIs are specific, measurable metrics that show how well your campaigns meet goals. You should track:
- Cost per lead
- Conversion rate
- Website traffic
- Unique visitors
- Page views
- Time on site
- Organic search rankings
- Keyword performance
- Backlink profile
- Follower growth rate
- Engagement rate
- Conversion rate from social channels
- Click-Through Rate (CTR)
- Cost Per Click (CPC)
- Return on Ad Spend (ROAS)
- Product Adoption Rate
- Churn Rate
- Product Sentiment
- Customer Acquisition Cost (CAC)
These metrics help you measure marketing roi and optimize your ecommerce brand’s strategy.
Mobile and Cross-Device Access
You want to check your marketing dashboard anywhere. Mobile and cross-device access means you can view marketing data, analytics, and performance insights on your phone, tablet, or laptop. FineReport’s mobile BI lets you track ecommerce campaigns and segmentation on the go.

Mobile access improves usability. You can capture user behavior across devices, unify customer journeys, and optimize user experience. Session replays and funnel analysis reveal friction points, helping you boost engagement metrics and marketing roi.
A great marketing analytics dashboard brings together real-time data, customizable layouts, key kpis, and mobile access. You get the insight you need to grow your ecommerce brand and improve marketing performance.
Dashboard Examples for Different Marketing Channels
SEO Analytics Dashboard Examples
You want to know how your website performs in search engines. An SEO dashboard helps you track organic traffic, keyword rankings, backlinks, and conversions in real time. You can pull data from Google Analytics, Google Search Console, and Semrush. This dashboard shows your progress toward marketing goals and helps you spot trends fast.
- Track keyword rankings and see which terms drive traffic.
- Monitor organic visits and conversions to measure success.
- Analyze backlinks to understand your site’s authority.
- Use Google Analytics to check user engagement and goal completions.
- Review Google Search Console for insights into website performance.
These marketing dashboard examples give you a clear view of your SEO efforts.
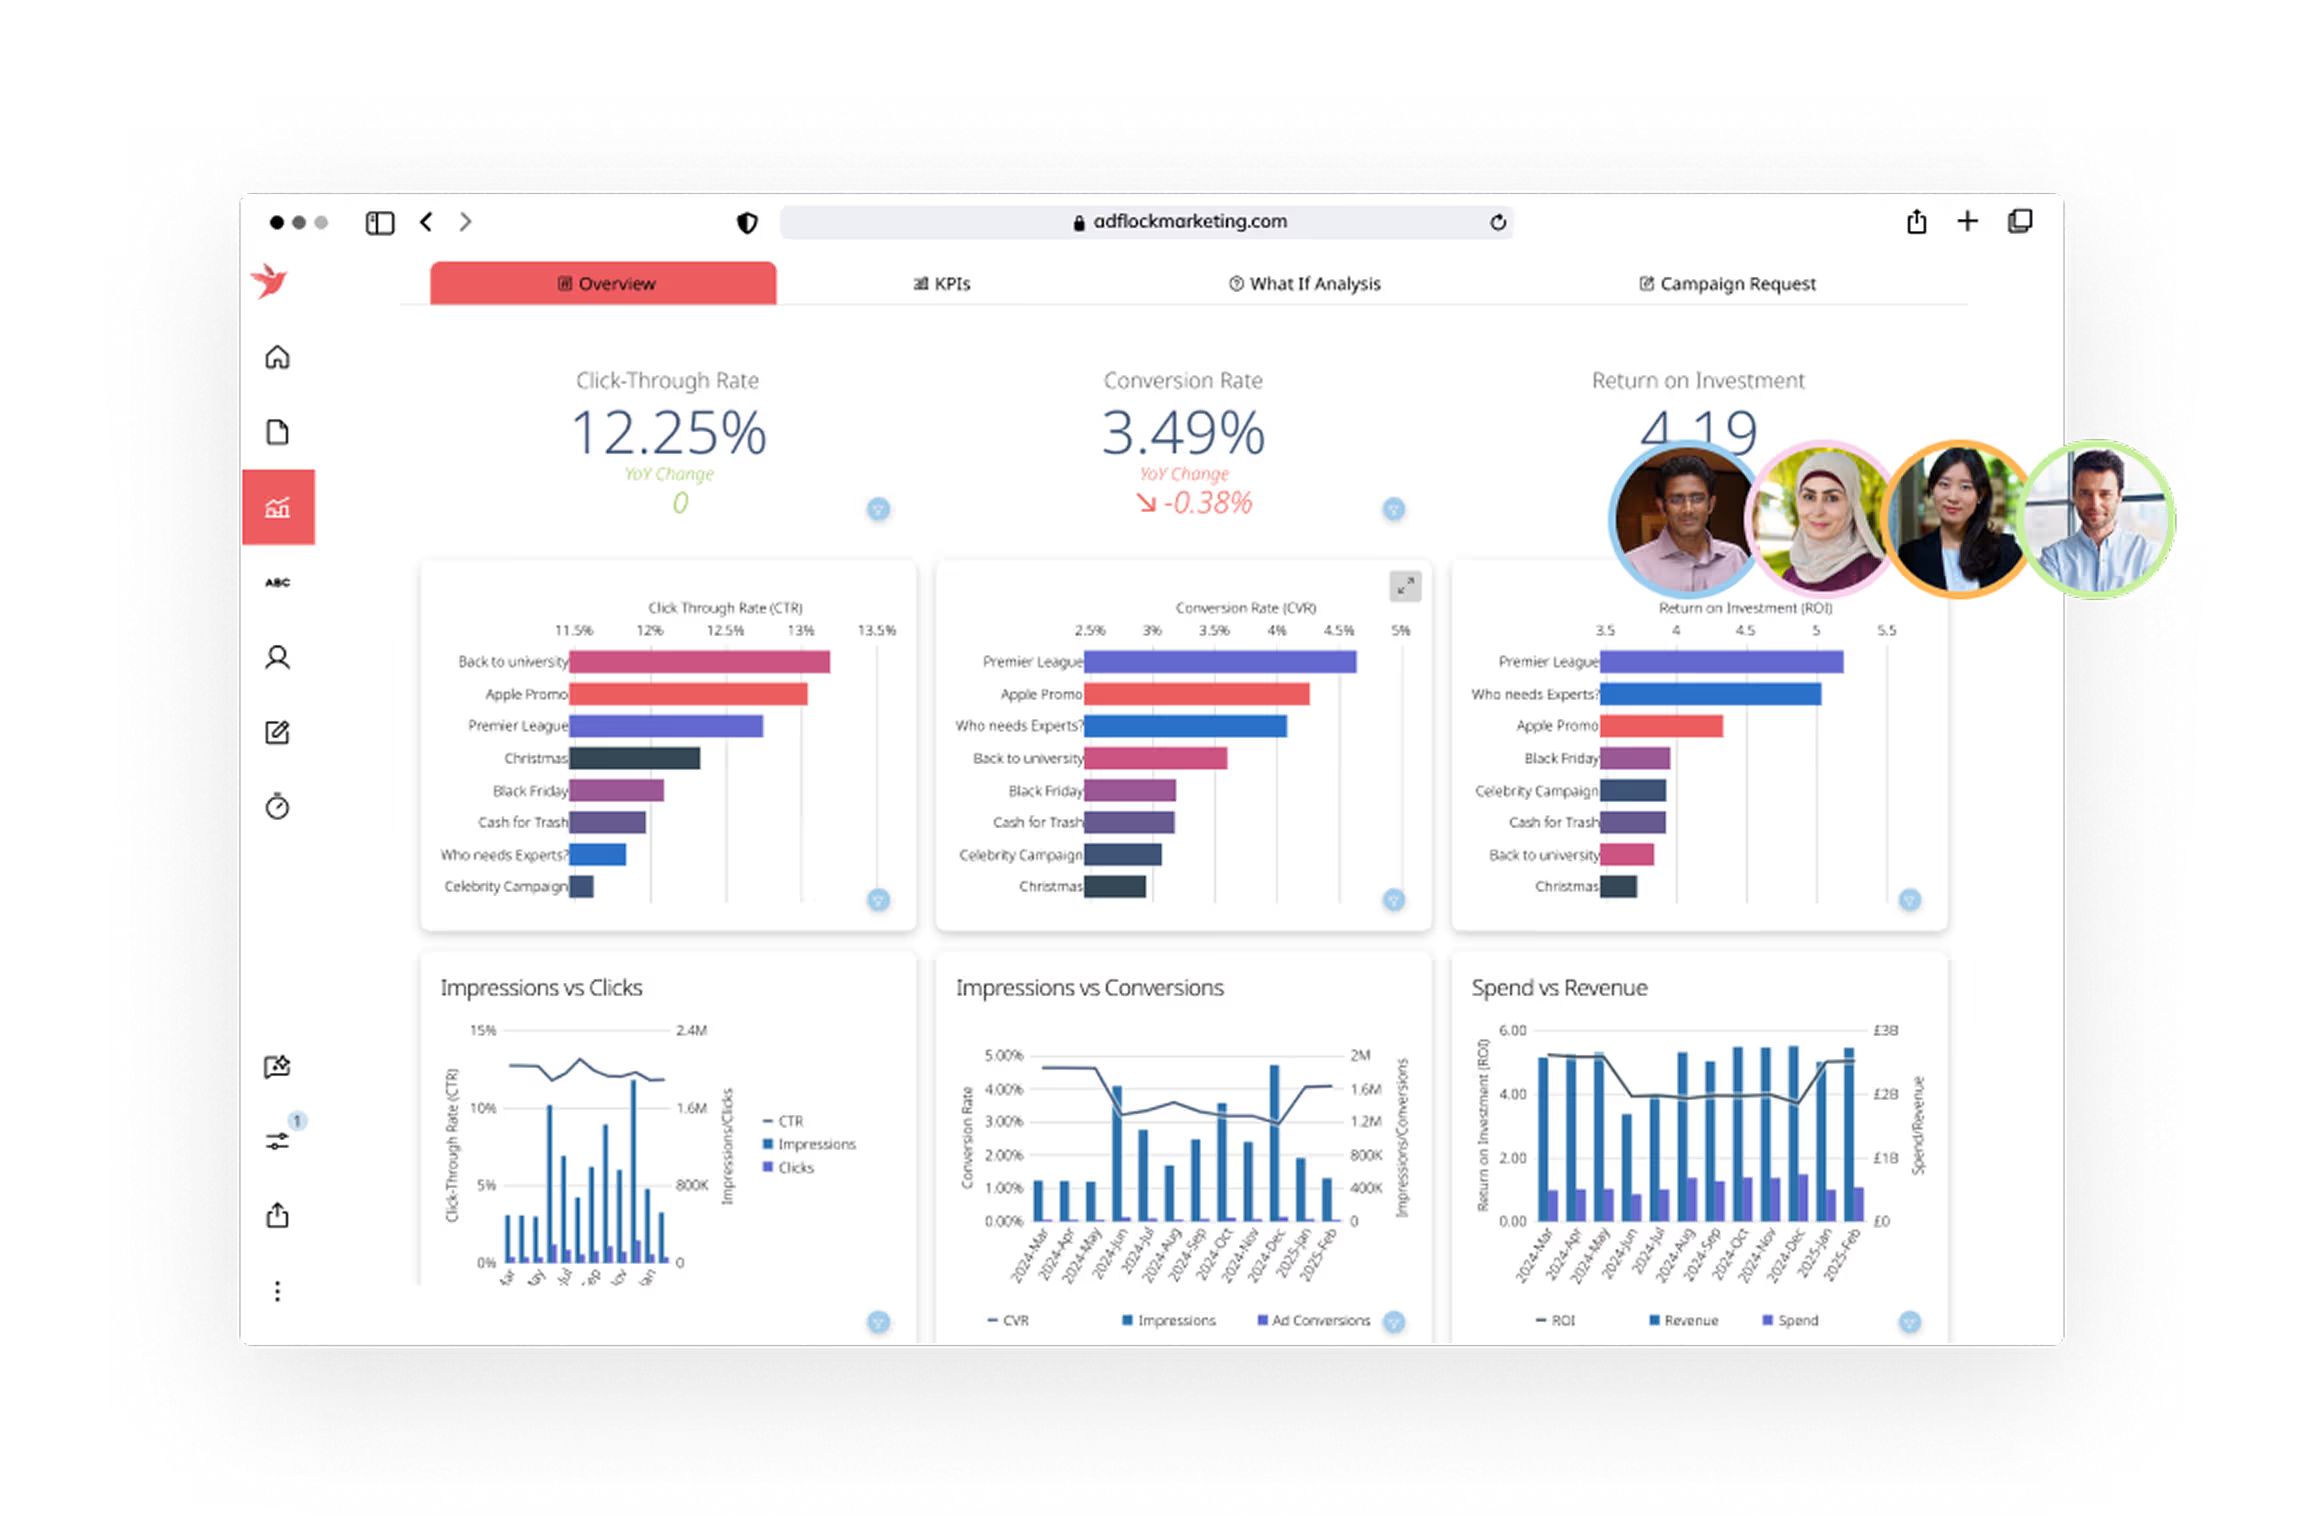
PPC and Advertising Dashboard Examples
If you run paid campaigns, you need a dashboard that brings all your advertising data together. You can compare results across Google Ads, Meta Ads, and LinkedIn Ads. Here’s a quick look at some dashboard templates:
| Dashboard Template | Key Features |
|---|---|
| PPC Dashboard | Centralizes key advertising metrics and KPIs from multiple platforms. |
| Campaign Performance Report | Shows impressions, clicks, CTR, and cost metrics for each campaign. |
| Multi-Channel Campaign Report | Identifies top-performing and underperforming campaigns for smarter budget allocation. |
A marketing analytics dashboard like this helps you see which ads work best and where to invest your budget.
Social Media Marketing Dashboard Examples
You want to track engagement and reach across all your social channels. A social media dashboard puts everything in one place. You can share results with your team and customize the dashboard for your audience.
| Key Feature | Description |
|---|---|
| Single-view display of metrics | See all your key metrics in one view. |
| Easy sharing with team members | Collaborate and share performance insights. |
| Customizable visualizations | Tailor the dashboard to your needs. |
| Metrics to track | Followers, engagement, reach, impressions, likes, comments, shares, and more. |
| Real-time view | Get up-to-date insights for data-driven decisions. |
- Monitor Facebook page likes to measure brand awareness.
- Track follower growth to see engagement.
- Identify which channels drive the most website traffic.
These marketing dashboard examples help you focus your social media strategy.
Email and Content Marketing Dashboard Examples
You want to know how your emails and content perform. An email dashboard tracks opens, clicks, unsubscribes, and bounces for each campaign. You can compare different messaging types and see what works.
- Email engagement analysis report
- Email-to-revenue funnel report
- Unsubscribe trend monitoring report
- Campaign performance comparison report
The email engagement analysis report gives you a detailed breakdown of key interaction metrics. You can see how each campaign performs and compare effectiveness across different messages.
By using these dashboard examples, you get a complete view of your email and content marketing. You can spot trends, improve your strategy, and boost ROI.
How to Choose the Right Marketing Dashboard Template
Aligning with Business Goals
You want your marketing dashboard to match your business goals. Start by thinking about what you want to achieve. Do you need to boost sales, improve customer engagement, or track campaign performance? Your dashboard should show how your marketing investments connect to results. It helps you compare targets with actual outcomes and reveals the relationships between different marketing channels.
Here’s a quick table to help you focus on the right criteria:
| Criteria | Description |
|---|---|
| Unified View | Shows how marketing investments link to business results. |
| Connected to Marketing Plan | Aligns dashboard metrics with your marketing plan. |
| Compares Targets Versus Results | Lets you see if you hit your goals. |
| Connect Investment and Value | Highlights how marketing drives ROI. |
| Reveal Relationships | Shows how channels work together. |
| Improve Decision Making | Helps you make smart choices for strategy and investments. |
| Provide Actionable Insights | Gives you information you can use right away. |
You want your dashboard to support decision-making and give you actionable insights. Make sure the dashboard uses accurate and relevant data. Customization and flexibility matter too. Your dashboard should reflect your priorities and adapt to different users.
Data Integration and Source Compatibility
Your marketing dashboard needs to pull data from many sources. You might use Google Ads, Facebook, email platforms, or CRM systems. If your dashboard can’t connect to these, you miss out on key analytics. Integration platforms like FineDataLink make this easy. They let you sync data in real time, so your dashboard always shows the latest performance.
Check out this table to see why integration matters:
| Benefit | What It Means for You |
|---|---|
| Centralized Source of Truth | All your marketing data in one place for better decisions. |
| Enhanced Collaboration | Teams use the same metrics, so everyone stays aligned. |
| Increased Productivity | Automated data collection saves time and boosts strategy. |
| Informed Decision-Making | Clear data leads to better insights and campaign effectiveness. |
Choose a dashboard that supports your data sources and keeps your analytics fresh. Real-time integration helps you react fast and stay ahead.
Usability and Customization
You want a marketing dashboard that’s easy to use. If your dashboard is confusing, you won’t get the most out of your analytics. Look for a dashboard with a simple interface and clear visuals. Drag-and-drop features make it easy to build and change your dashboard. Customization lets you focus on the metrics that matter most.
Here’s a quick checklist for usability:
- Is the dashboard user-friendly?
- Can you customize layouts and metrics?
- Does it present data clearly?
- Is it accessible on mobile devices?
- Can you scale it as your business grows?
A good marketing dashboard should grow with you. It needs to handle more data and users as your business expands. Scalability, customization, and ease of use help you get the most value from your dashboard.
Tip: Try out different dashboard templates before you decide. Make sure they fit your goals, connect to your data, and are easy for your team to use.
Getting Started with Your Marketing Analytics Dashboard
Quick Setup Tips
Ready to launch your marketing analytics dashboard? You can get started fast with a few simple steps. First, pick a dashboard template that matches your goals. FineReport makes this easy with drag-and-drop design and instant data connectors. Connect your main data sources, like Google Ads, Facebook, or your CRM. Make sure your dashboard pulls in real-time data so you always see the latest results.
Here’s a quick checklist to help you set up:
- Choose a dashboard template that fits your marketing needs.
- Connect all your key data sources for a unified view.
- Set up real-time data syncing for instant updates.
- Customize your dashboard layout to highlight important KPIs.
- Test your dashboard on mobile devices to check usability.
Tip: Use FineReport’s integration with FineDataLink for fast, reliable data syncing. You can connect over 100 sources in just a few clicks.
Best Practices for Ongoing Optimization
Once your dashboard is live, you want to keep it working at its best. Review your dashboard regularly to make sure it tracks the right metrics. Update your KPIs as your marketing goals change. Share insights with your team and ask for feedback. You can use scheduled reports to keep everyone informed.
Here are some best practices for ongoing optimization:
| Practice | Why It Matters |
|---|---|
| Regular KPI review | Keeps your dashboard aligned with goals |
| Team feedback | Improves usability and relevance |
| Scheduled reporting | Ensures timely insights |
| Mobile access checks | Supports decision-making on the go |
| Data source updates | Maintains accuracy and reliability |
Note: Keep your dashboard simple and focused. Too many metrics can make it hard to spot what matters most.
You can optimize your dashboard by making small changes over time. Stay flexible and adjust your dashboard as your business grows. This way, you always get the insights you need for smarter marketing decisions.
You want smarter campaigns and better results. A marketing dashboard helps you track performance, spot trends, and make quick decisions. When you use top marketing dashboards, you get real-time data and clear insights. FineReport gives you powerful integration, flexible visualization, and instant access to your marketing analytics dashboard. You can connect all your marketing data, customize your dashboard, and monitor performance across every channel. Try a dashboard template that fits your goals. Keep optimizing your marketing dashboards and use data integration tools for long-term success.

Ready to take your marketing dashboard to the next level? Start exploring templates and see how your data can drive performance.
Continue Reading About dashboard
Top 10 Tableau Dashboard Examples for Business Insights
Production Management Benefits for Manufacturers
What is a Digital Marketing Dashboard and Why Does it Matter
What is a Call Center Metrics Dashboard and How Does It Work


FAQ

The Author
Lewis
Senior Data Analyst at FanRuan
Related Articles

How to Build an Investment Portfolio Reporting Dashboard for Executives: KPIs, Benchmarks, and Drill-Down Views
Investment portfolio reporting for executives is not about showing every holding, transaction, and chart your investment team can produce. It is about giving CEOs, CFOs, CIOs, boards, and investment committees a fast, re
Yida YIn
Jun 25, 2026

12 KPI Reporting Examples for Executive Dashboards: What to Show in Weekly, Monthly, and Quarterly Reviews
Executive leaders do not need more data. They need decision ready $1 examples that match how often they review the business and what actions they are expected to take. A weekly $1 should surface fast moving risks and per
Yida YIn
Jun 25, 2026

How to Build a Digital Marketing Reports Dashboard: Executive Examples, KPIs, and Templates
A $1 is the control layer that helps executives and marketing leaders turn scattered channel data into fast, confident decisions. If you are a CEO, CMO, operations director, or marketing analytics lead, the real problem
Yida Yin
May 07, 2026