An ecommerce dashboard is a digital tool that brings together your store’s sales, customer, and inventory data into one visual platform, helping you monitor and analyze business performance in real time. You need an ecommerce dashboard because it gives you clear, actionable insights that drive smarter decisions. With real-time analytics, you can act on the most current information, quickly detect trends, and adjust your strategies to optimize results.
Real-time data empowers you to:
- React immediately to changes in customer behavior.
- Make agile decisions that boost performance and profitability.
- Gain unified insights from multiple sources for a complete business view.
FineReport supports your need for fast, unified insights by integrating data from various sources and delivering easy-to-understand dashboards.
An ecommerce dashboard is a digital platform that displays your store’s most important sales, customer, and inventory metrics in one place, helping you track and improve business performance.
You use an e-commerce dashboard to see real-time data from your online store, marketing channels, and customer interactions. This tool gives you a clear view of your business health and helps you make smart decisions quickly. Unlike traditional business intelligence dashboards, an e-commerce dashboard integrates data from multiple sources like Shopify and Google Analytics, providing dynamic alerts and actionable insights for immediate action.
An e-commerce dashboard pulls together data from your online store, marketing channels, marketplaces, customer behavior, and operations, showing you the key metrics you need to run and grow your business.
Here is a comparison between e-commerce dashboards and traditional business intelligence dashboards:
| Feature/Characteristic | Ecommerce Dashboards | Traditional Business Intelligence Dashboards |
|---|---|---|
| Data Integration | Integrates data from multiple sources like Shopify, GA, etc. | Often relies on static data sources and may not integrate as seamlessly. |
| Real-time Monitoring | Provides real-time metrics and dynamic alerts. | Typically focuses on historical data analysis. |
| User Focus | Designed for marketing teams to track specific ecommerce metrics. | Generally aimed at broader business intelligence needs. |
| Complexity of Data Handling | Requires significant effort to unify data across platforms. | May have more established processes for data handling. |
| Actionable Insights | Offers smart alerts and insights for immediate action. | Insights may be less immediate and more retrospective. |
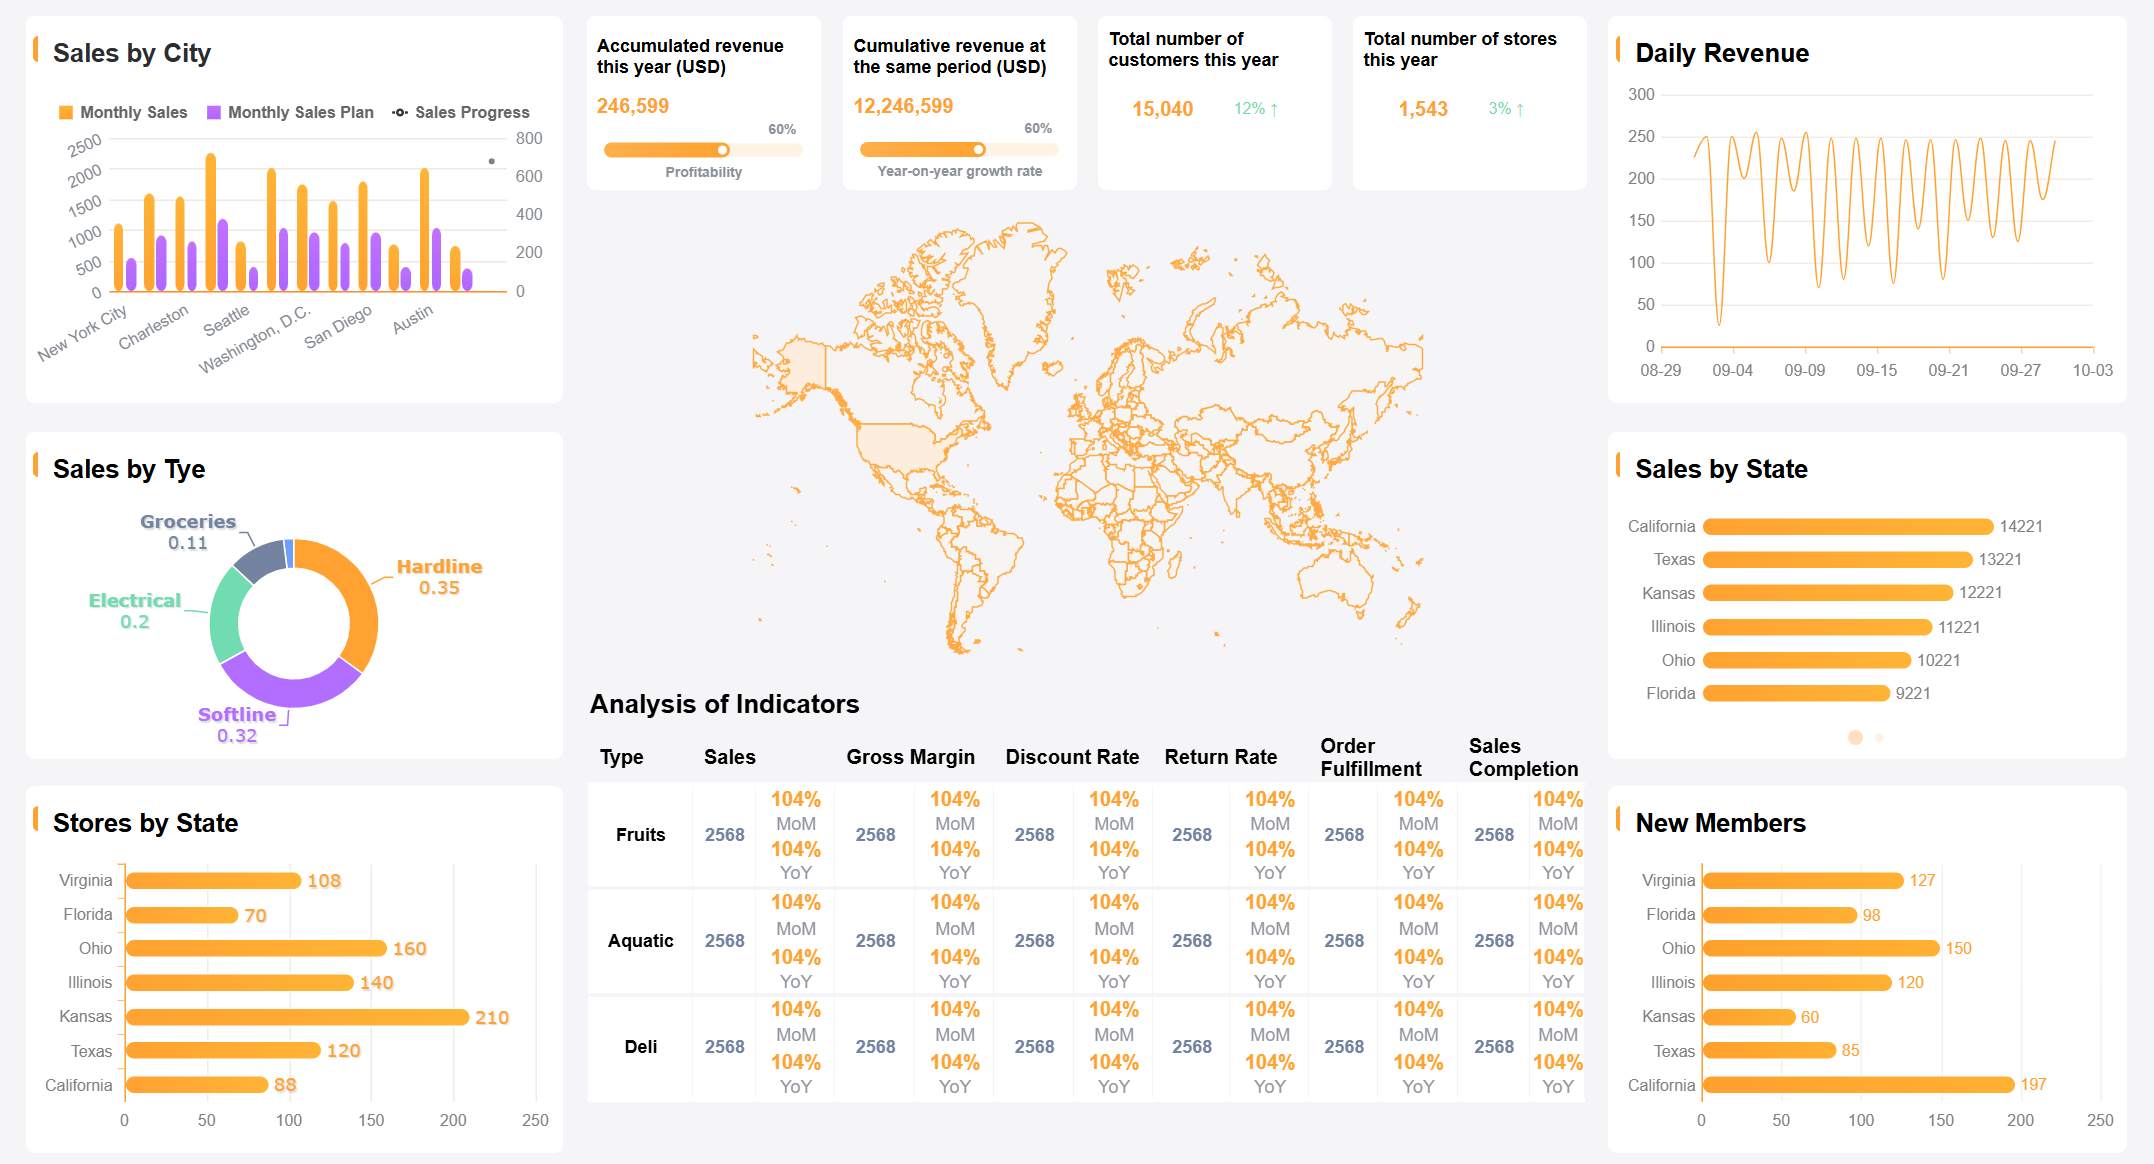
You rely on an e-commerce dashboard to simplify daily business operations. The dashboard aggregates data from various sources, giving you a single view of your store’s performance. You can monitor sales, customer behavior, and inventory levels, making it easier to spot trends and respond quickly.
Here are the most common features found in e-commerce dashboards:
| Feature | Description |
|---|---|
| Real-Time Data | Provides up-to-date information for informed decision-making. |
| Custom Reports | Allows users to tailor the dashboard to their specific KPIs and business goals. |
| Seamless Integration | Connects with various tools in the tech stack for a unified view of business performance. |
| Mobile-Friendly Design | Ensures access to data on-the-go, allowing for proactive management. |
| Clear Visuals | Transforms data into intuitive visuals for easy understanding and quick decision-making. |
The primary functions of an e-commerce dashboard include:
| Function | Description |
|---|---|
| Data Aggregation | Combines data from various sources into a single view, simplifying management of online business. |
| Performance Monitoring | Tracks key metrics like sales and customer behavior to assess business health. |
| Decision-Making | Provides insights that enable informed decisions based on comprehensive data analysis. |
| Improved Visibility | Offers clear insights into ordering trends and customer behavior for better understanding. |
| Accurate Forecasting | Uses real-time data to set precise KPIs and improve forecasting accuracy. |
| Enhanced Operations | Identifies operational issues promptly, allowing for quick resolutions. |
| Automation | Automates routine tasks, freeing up resources for other business areas. |
You gain better visibility into sales and customer behavior, improve searchability for urgent requests, increase security of customer data, and enhance operational efficiency. Accurate forecasting based on real-time data helps you set and achieve business goals.
You benefit from an e-commerce dashboard if you manage an online store, oversee marketing campaigns, or handle inventory. The dashboard supports data-driven decision-making by consolidating information and identifying trends. Teams across your organization collaborate more effectively because everyone shares access to the same data.
Here is how different roles benefit from using an e-commerce dashboard:
| Benefit | Description |
|---|---|
| Data-driven decision-making | Consolidates data for identifying trends and anomalies, supporting fact-based decisions. |
| Stronger collaboration | Provides shared access to information, enhancing cross-team workflows and reducing miscommunication. |
| Increased inventory control | Combines stock levels and sales data for accurate demand forecasting and prevents stockouts. |
| Improved performance insights | Offers up-to-date metrics for monitoring campaign performance and adjusting strategies accordingly. |
| Centralized data and analytics | Aggregates data from various functions, reducing manual reporting and errors. |
| Time savings | Automates data collection, allowing teams to focus on strategy development rather than manual tasks. |
| Higher customer satisfaction | Enables quick access to metrics for addressing issues and personalizing shopping experiences. |
You see improved business outcomes after implementing an e-commerce dashboard. User engagement increases by up to 40%. Conversion rates rise by as much as 30%. Customer satisfaction scores improve, and your team makes faster decisions. You also find more opportunities for upselling and cross-selling, and continuous optimization becomes possible through ongoing feedback.
An ecommerce dashboard is a digital platform that brings together your sales, customer, and inventory data, giving you a unified view of your business so you can make faster, smarter decisions and improve performance.
You need real-time insights to stay competitive in ecommerce. When you use a dashboard that updates instantly, you see what is happening in your store as it unfolds. This helps you react quickly to changes in customer behavior, sales trends, and inventory levels. FineReport supports this by integrating data from multiple sources and displaying it in one place, so you never miss important updates.

Real-time insights have a direct impact on inventory management. You can automate processes, reduce manual counting, and cut labor costs. You also minimize stock shrinkage and keep inventory at optimal levels. Dashboards help you spot slow-moving products and avoid overstocking or stockouts. The table below shows how real-time insights improve inventory management:
| Metric | Impact on Inventory Management |
|---|---|
| Cost Reduction | Up to 20% |
| Improved Delivery Speeds | 30% increase |
| Demand Forecasting Accuracy | Enhanced |
Inventory often makes up a large part of your costs. Excess stock increases carrying costs, while stockouts can lead to lost sales. Real-time insights from your ecommerce dashboard help you manage these risks and keep your business running smoothly.
Many companies have seen growth by using real-time reporting. For example, a multinational consumer goods company used a centralized dashboard to track sales, inventory, and financial data. This allowed them to respond quickly to market changes, leading to higher revenue and better efficiency. When you have instant access to your data, you can spot issues early and take action before they become bigger problems.
A dashboard streamlines your decision-making by putting all your key metrics in one place. You do not need to search through spreadsheets or wait for manual reports. FineReport’s automated scheduling ensures you always have the latest data, delivered directly to your dashboard or inbox.

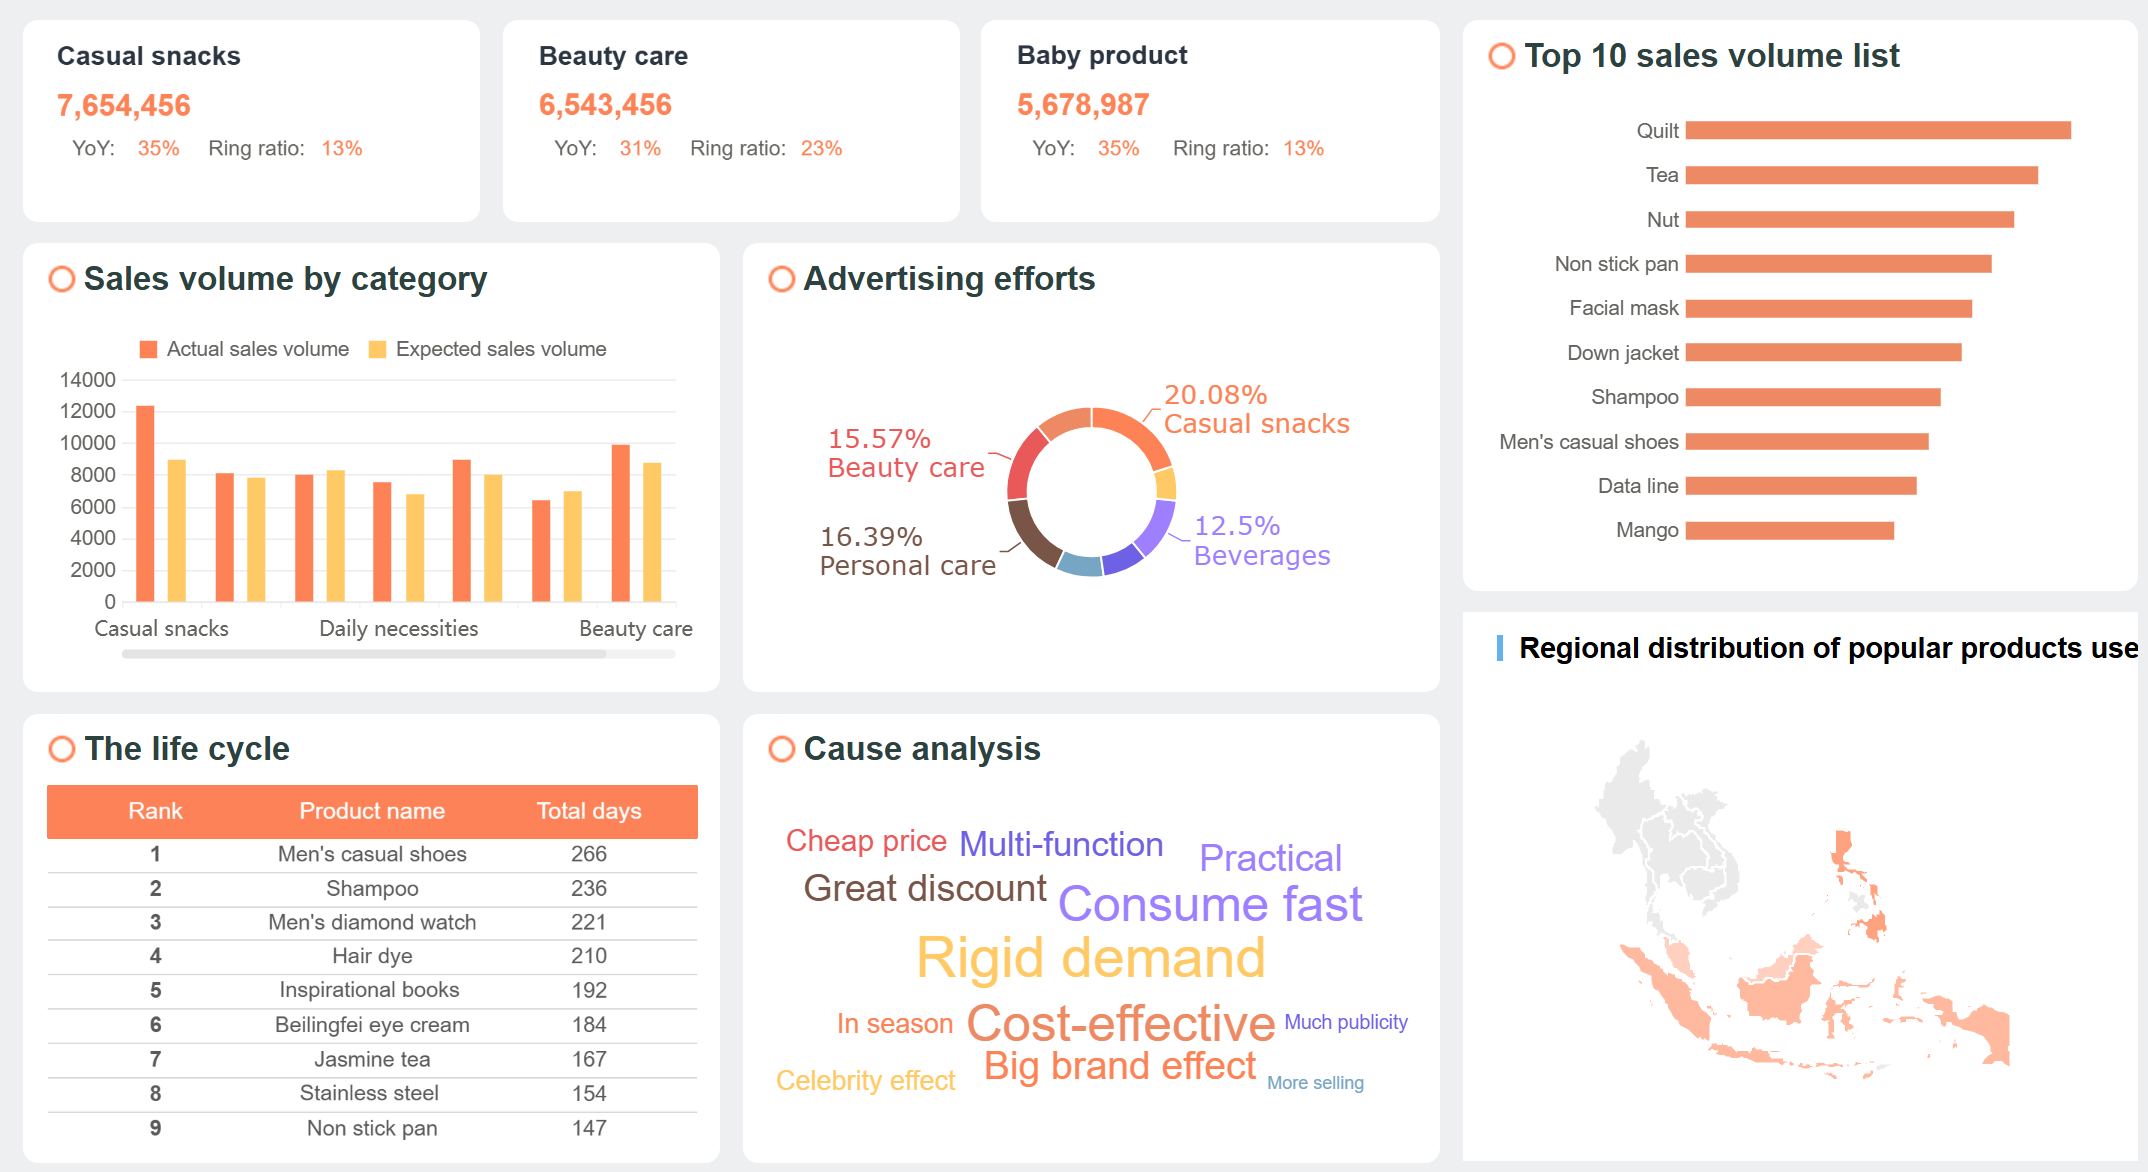
You can track important ecommerce metrics like revenue, average order value, cart abandonment, and customer lifetime value. The table below highlights some of the most useful metrics for marketing campaigns:
| Metric/Feature | Description |
|---|---|
| Revenue, AOV, units per transaction | Assess overall financial performance. |
| Cart abandonment and checkout rates | Identify where you lose potential sales. |
| Customer Lifetime Value (CLV) | Evaluate long-term customer value. |
| Revenue by traffic source | See which marketing channels work best. |
| Product performance | Find top-selling products and manage inventory. |
| Funnel metrics | Track the customer journey from product view to purchase. |
With all this information at your fingertips, you can make quick, informed decisions. You can adjust marketing campaigns, optimize product listings, and improve customer experiences without delay. FineReport’s unified data view helps you see the big picture and drill down into details when needed.
Dashboards also promote collaboration. When your team shares the same data, everyone works toward the same goals. You reduce miscommunication and make sure every department has the insights they need to succeed.

Performance tracking is essential in ecommerce. Your dashboard lets you monitor sales, customer satisfaction, and operational efficiency in real time. FineReport’s dashboards provide clear visuals and customizable layouts, making it easy to focus on the metrics that matter most to you.

You can track metrics like customer retention rate, net promoter score, conversion rate, and sell-through rate. These metrics help you understand how well your business is performing and where you can improve. Here are some of the most commonly tracked metrics:
| Metric | Description |
|---|---|
| Customer Retention Rate | Measures repeat purchases over time. |
| Net Promoter Score (NPS) | Gauges customer loyalty and likelihood to recommend your store. |
| Customer Satisfaction Score | Evaluates satisfaction with purchases or interactions. |
| Return on Ad Spend (ROAS) | Shows revenue generated for each dollar spent on ads. |
| Conversion Rate | Indicates how well you turn visitors into buyers. |
| Refund Rate | Tracks the percentage of returned products. |
| Units Sold | Shows which products are in demand. |
| Sell-Through Rate | Compares sold items to available inventory for stock management. |
Dashboards help you save time by automating data collection and reporting. You reduce errors and free up your team to focus on strategy and growth. In the retail and consumer goods industry, dashboards have led to measurable improvements in operational efficiency. Companies report lower labor costs, faster reporting, and higher employee productivity after adopting dashboards.
FineReport’s automated scheduling and real-time reporting ensure you always have up-to-date information. You can set up alerts for key metrics, so you never miss important changes. This level of performance tracking helps you stay ahead of the competition and grow your ecommerce business with confidence.

An ecommerce dashboard is a visual tool that brings together your store’s sales, customer, and inventory data, helping you track performance and make informed decisions with real-time ecommerce analytics.
You need to focus on the right key performance indicators to get the most out of ecommerce analytics. Tracking these KPIs helps you understand your business health and spot areas for improvement. Here are the top five KPIs you should monitor on your dashboard:

Establishing a measurement strategy makes dashboard creation easier. When you prioritize metrics that impact your goals, you ensure your ecommerce analytics are relevant and actionable.
Ecommerce analytics give you a clear view of your sales, customer, and inventory performance. You can track important metrics that drive success. The table below highlights some of the most critical metrics for ecommerce:
| Metric | Description |
|---|---|
| Customer Acquisition Cost (CAC) | Analyzes the total cost of acquiring a paying customer, including broader marketing expenses. |
| Conversion Rate | Percentage of visitors who make a purchase, indicating the effectiveness of marketing efforts. |
| Average Order Value (AOV) | Measures the average amount spent per transaction, helping to assess revenue generation. |
| Inventory Turnover Rate | Indicates how often stock is sold and replaced, essential for managing inventory efficiently. |
| Stockout Rate | Tracks instances when products are unavailable for purchase, impacting potential sales. |
| Shopping Cart Abandonment Rate | Shows the percentage of shoppers who leave without completing their purchase. |
| Carrying Costs | Costs associated with holding inventory, crucial for financial management in ecommerce. |
| Stock-to-Sales Ratio | Compares stock levels to sales, helping to optimize inventory management and cash flow. |
You can also monitor metrics like repeat customers, lifetime value, conversion rate, cost per acquisition, total engagement, clicks, and bounce rate. These metrics help you make better decisions and improve your ecommerce dashboard.
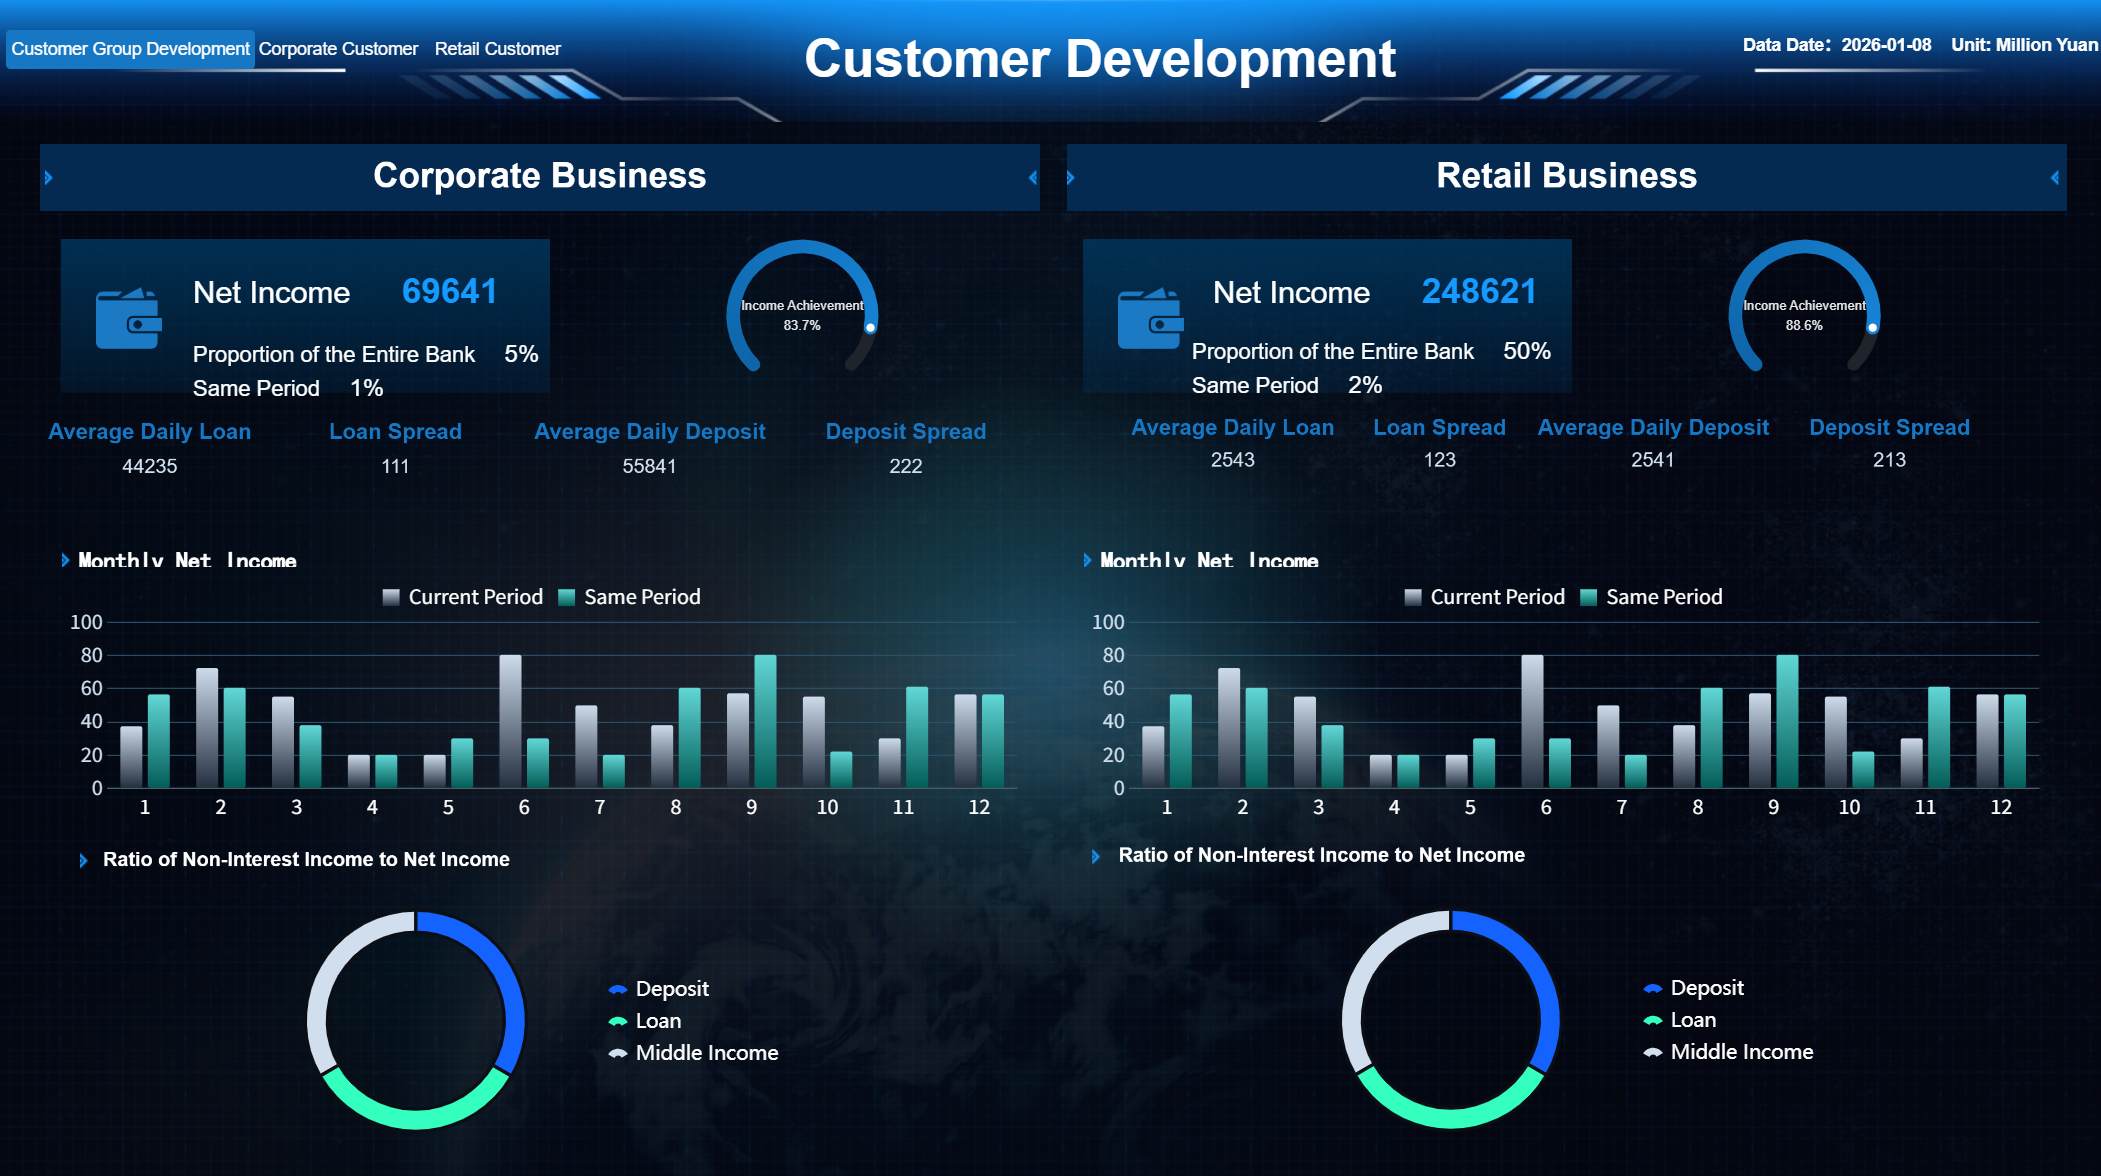
FineReport makes ecommerce analytics simple and flexible. You can customize your dashboard to fit your role and business needs. Executives can focus on high-level metrics like revenue and average order value. Directors can see marketing spend across channels. Analysts can dive into detailed ad performance and social engagement.
Tip: FineReport connects data from different sources, breaks down silos, and delivers consolidated dashboards. You get rich visualizations, automated reporting, and mobile-friendly access to your ecommerce analytics.
The table below shows how FineReport supports your ecommerce dashboard:
| Feature | Description |
|---|---|
| Data Integration | Connects disparate data sources for consolidated dashboards. |
| Visualizations | Offers rich visuals and custom reports for real-time tracking. |
| Automated Reporting | Supports scheduled, automated reporting for up-to-date operational views. |
| Mobile Accessibility | Provides mobile-friendly reporting for leaders to review outputs on the go. |
You can tailor your ecommerce dashboard to show the metrics that matter most to you. FineReport helps you track sales, customer engagement, inventory, and marketing KPIs, making your ecommerce analytics more powerful and actionable.
An ecommerce dashboard is a visual platform that displays key metrics from your e-commerce business, helping you monitor sales, customer activity, and inventory in real time for smarter decisions.
When you set up a dashboard for your e-commerce business, you often face several challenges. You may not have a clear purpose for your dashboard. Overcrowded dashboards can make it hard to focus on important data. Many teams forget to consider the mobile experience, which limits access for users on the go. Getting buy-in from stakeholders and identifying what is needed can slow down progress. Insufficient user training can lead to mistakes and poor adoption.
You also encounter integration issues. Connecting your dashboard to legacy systems can cause delays and performance bottlenecks. Data security concerns arise when sharing sensitive information. Integration costs may strain your budget. Managing multichannel sales requires real-time synchronization to avoid overselling and stockouts. Poor understanding of system requirements can lead to mismatched expectations. Compatibility issues between different integrations can result in system errors and data loss.
FineReport helps you overcome these challenges with its drag-and-drop design, multi-source integration, and mobile accessibility. You can create and customize dashboards easily, even without technical skills. The adaptability of FineReport lets you adjust dashboards quickly as your e-commerce business evolves. Stunning HTML5 charts provide clear visualizations that work on any device.
| Feature | Benefit |
|---|---|
| Drag-and-drop design | Allows easy creation and customization of dashboards without technical skills |
| Adaptability | Enables quick adjustments to dashboards based on changing business needs |
| Visualization effects | Provides stunning HTML5 charts that adapt to any screen size |
You can see real-world impact in customer stories like BOE. BOE improved operational efficiency and reduced inventory costs by using FineReport dashboards to unify data and standardize metrics. Retailers also use FineReport to integrate data from POS, CRM, and e-commerce platforms, gaining a unified view and optimizing operations.

When you select a dashboard for your e-commerce business, you should look for ease of use, customization options, integration capabilities, and pricing. You want a solution that fits your team’s skills and business needs. FineReport offers flexible customization, seamless integration with multiple data sources, and mobile access, making it a strong choice for any e-commerce business.
Tip: Choose a dashboard that grows with your e-commerce business and supports your goals for data-driven decision-making.
An ecommerce dashboard is a visual tool that displays your store’s key metrics in one place. You drive growth and efficiency by tracking sales, customer retention, and inventory. FineReport helps you turn data into actionable insights. To get started, follow these steps:
| Dashboard Type | Key Focus Areas |
|---|---|
| Executive Performance | Profitability, revenue, repeat rate |
| Acquisition | Paid marketing, ad efficiency |
| Retention & LTV | Repeat rate, churn, LTV |
| Inventory | Sell-through, stockout risk |
Tip: Use real-time insights and collaboration features to optimize your ecommerce strategy.
Perform Market Basket Analysis to Upgrade Your Business
10 Must-Have Marketing Dashboard Tools for Agencies
10 Best Market Intelligence Tools to Stay Ahead This Year
Business Intelligence Marketplace Growth and Emerging Trends for 2026

The Author
Lewis
Senior Data Analyst at FanRuan
Related Articles

Payment Analytics Dashboard: 12 KPIs Every Operations Leader Should Track to Cut Revenue Leakage
Losing revenue to declines? Discover 12 essential KPIs to track in your payment analytics dashboard to stop leakage and manage disputes.
Lewis Chou
May 05, 2026

SOC Dashboard Explained: 12 Essential KPIs, Views, and Workflows Security Teams Use
Learn about SOC dashboards, the 12 essential KPIs for security teams, and how they centralize alerts and workflows for faster threat detection and response.
Lewis Chou
May 05, 2026

EMR Dashboard Guide: 12 Metrics to Track for Faster Clinical and Operational Decisions
Learn the 12 essential EMR dashboard metrics to track for faster clinical and operational decisions, improving patient flow and revenue cycle management.
Lewis Chou
May 05, 2026


