A call center dashboard gives you a centralized way to monitor and analyze your team’s activity and results. This tool helps you track agent performance, customer satisfaction, and operational efficiency in real time. When you use real-time analytics and clear visualizations, you can respond to issues quickly and improve outcomes. Studies show that:
- High-performing call centers are four times more likely to use real-time monitoring.
- Customer satisfaction scores can increase by up to 30% with analytics software.
- Operational costs may drop by 20% when you use these tools.
FineBI stands out as a leading solution for building and using a dashboard that drives business impact. Understanding key features and best practices will help you maximize results.
Call Center Dashboard Overview

What Is a Call Center Dashboard
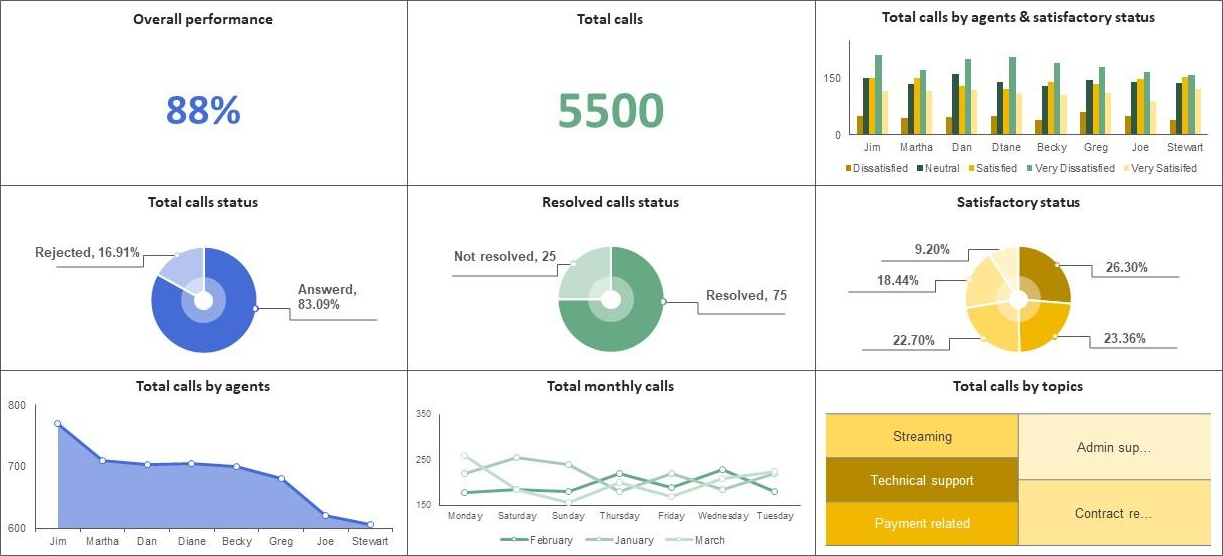
A call center dashboard is a vital tool in the customer service industry. You use it to visualize different types of data, such as sales numbers and call resolution rates. The dashboard presents this information through charts and graphs, making it easier for you to analyze key metrics and monitor your team's performance. When you have a call center dashboard, you can see important trends and patterns at a glance. This helps you make informed decisions quickly.
The main functions of a call center dashboard support your daily operations. The table below shows how you benefit from these features:
| Function | Description |
|---|---|
| Monitoring | Provides real-time updates on key metrics and activities within the call center. |
| Analyzing | Offers insights into call volume, trends, and agent performance for better decision-making. |
| Improving | Helps in optimizing processes and enhancing customer satisfaction through actionable data. |
You can rely on a call center dashboard to keep your team focused and your operations running smoothly.
Why Call Center Dashboards Matter
You need a call center dashboard because it gives you the power to improve both efficiency and customer experience. With a dashboard, you can track agent performance metrics like call handling time, first call resolution rates, and agent availability. This information helps you optimize how your team works. You also get real-time monitoring of queue abandonment rates and service level adherence, which lets you manage call flow more effectively.
- Agent performance metrics help you see where your team excels and where they need support.
- Queue management tools allow you to respond quickly to spikes in call volume.
- Efficiency metrics give you insight into trends and customer satisfaction scores, so you can allocate resources wisely.
A call center dashboard reveals bottlenecks, such as frequent repeat calls or long wait times. You can identify these inefficiencies and take action to improve customer service. The dashboard also highlights areas for improvement by providing metrics on agent productivity and customer experiences. This information guides your training and resource allocation decisions.
| Benefit | Description |
|---|---|
| Reveals bottlenecks | Identifies inefficiencies like frequent repeat calls or long wait times, crucial for improving customer service. |
| Highlights areas of improvement | Provides metrics on agent productivity and customer experiences to inform training and resource allocation. |
| Tracks performance | Visualizes real-time performance for agents and managers, aiding in goal setting and decision-making. |
| Improves customer experiences | Analytical insights help enhance customer satisfaction and retention by addressing common complaints. |
You gain better visibility of your customer service data. The dashboard helps you make crucial business decisions by giving you a unified view of your operations. You also get flexibility in your operations, so you can adjust quickly when needed.
Dashboards enhance customer experience by allowing you and your supervisors to quickly spot and address areas that need improvement. For example, if you notice customers are waiting too long, you can adjust staffing levels or introduce self-service options right away.
Here are three ways a call center dashboard benefits your business:
- It improves visibility of customer service data.
- It helps you make better decisions across departments.
- It provides flexibility, allowing for quick adjustments in your operations.
FineBI for Call Centers
FineBI offers a powerful solution for building and managing your call center dashboard. You can organize your data using a folder-based approach, which makes it easy to classify information by business subject. FineBI allows you to model data based on relationships in your data warehouse, including support for composite primary keys. This means you can create accurate and reliable dashboards for your team.
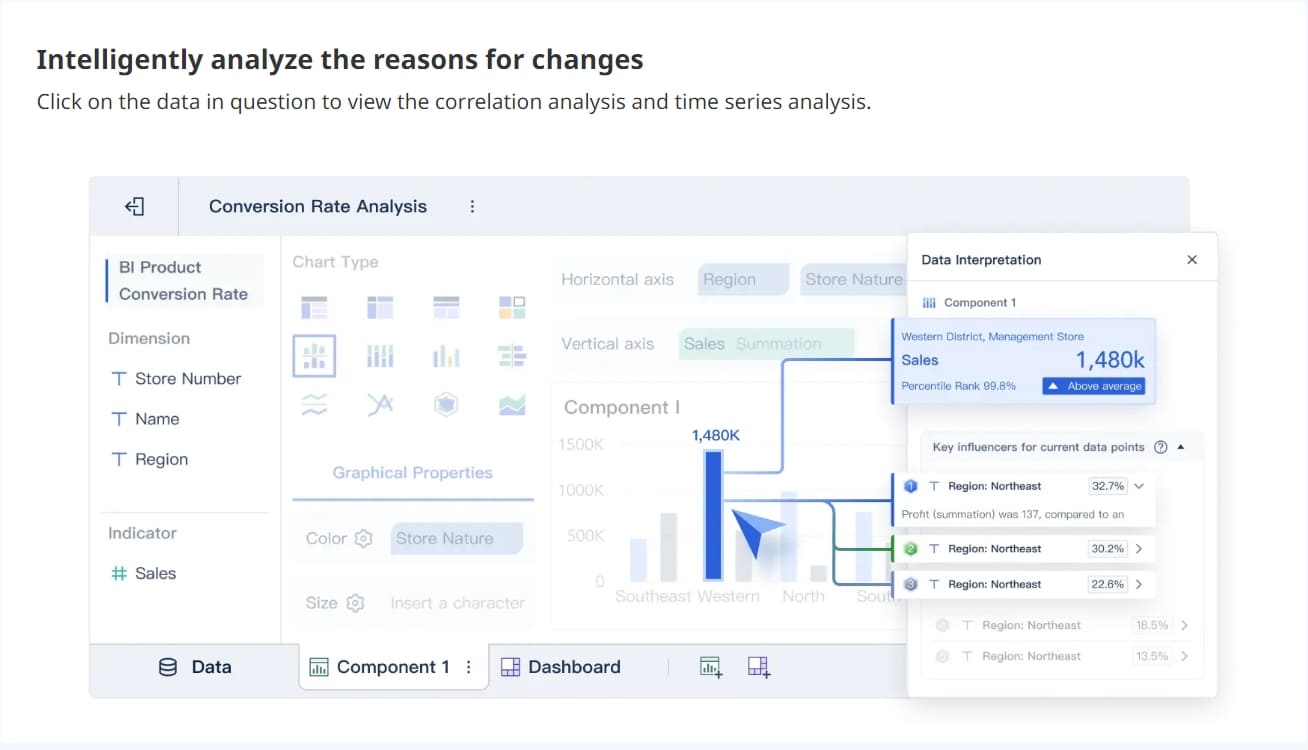
With FineBI, you get user-centric visual data analysis. The system recommends visualization effects based on the data you select, helping you identify issues faster. FineBI automatically recognizes dimensions and indicators, so you can perform calculations and explore your data in depth. You can merge analytic data into unified reports, making it simple to monitor key indicators on your call center dashboard.
Collaboration is another strength of FineBI. You can choose from three modes for data collaboration and sharing: Collaboration, Data Sharing, and Dashboard Sharing. This flexibility ensures that your team can work together efficiently, whether you need to share insights with managers or collaborate on new strategies.
FineBI stands out by supporting real-time updates and analysis. You always have the latest information at your fingertips, which helps you respond to changes in your call center environment without delay. If you manage a contact center dashboard as well, FineBI provides the tools you need to integrate and analyze data from multiple sources, giving you a complete view of your operations.
Key Features of Call Center Dashboard
Real-Time Data and Analytics in a Call Center Dashboard
You need real-time dashboards in your call center to keep up with fast-changing customer demands. A call center dashboard with real-time data and analytics gives you immediate access to performance metrics and call analytics. You can monitor real-time performance and spot issues as they happen, not after the fact. This approach helps you make quick decisions that improve both agent productivity and customer satisfaction.
AI-driven dashboards add another layer of value. They provide contextual analysis of key metrics such as Average Handling Time (AHT) and Customer Satisfaction (CSAT). These metrics often fluctuate due to many factors, so having a dashboard that interprets these changes in real time is crucial for effective management.
Real-time dashboards eliminate the need for manual analysis. You save time and can act on real-time insights without delay.
Here is how real-time dashboards impact your decision-making speed:
| Evidence Description | Impact on Decision-Making Speed |
|---|---|
| Real-time dashboards provide immediate insights into performance metrics. | Enables quick identification of issues, leading to faster decision-making. |
| Visualization of data eliminates manual analysis. | Saves valuable time, allowing for quicker data-driven decisions. |
| Monitoring performance indicators in real time. | Allows decision-makers to promptly identify problems or opportunities and take immediate action. |
You benefit from several core capabilities in a real-time call center dashboard:
- Unified view of data from various sources for accurate insights.
- AI-driven dashboards that provide contextual analysis of metrics.
- 24/7 monitoring of calls and digital interactions with custom alerts for emerging issues.
- Personalized dashboards to visualize KPIs like service level, abandon rate, and wait time.
- Constant visibility into real-time results against targets to motivate and engage staff.
When you use a real-time dashboard, you empower your team to respond quickly to customer needs and operational challenges.
Essential Metrics for Call Centers in a Call Center Dashboard
A call center dashboard must track the right call center metrics to give you a clear picture of your team's performance. Monitoring real-time performance through these metrics helps you identify strengths and weaknesses in your operations. The most essential KPIs for any call center dashboard include:
- Average Handle Time (AHT)
- First Call Resolution (FCR)
- Customer Satisfaction Score (CSAT)
- Call Abandonment Rate
These KPIs form the backbone of effective call analytics. You can use them to measure how well your agents resolve customer issues and how satisfied your customers feel after each interaction.
Industry benchmarks help you understand where your call center stands. For example, the average AHT varies by industry:
| Industry | Average AHT |
|---|---|
| Retail | 3-5 minutes |
| Technology | 8-10 minutes |
| Financial Services | 6-8 minutes |
| Healthcare | 5-7 minutes |
SQM Group’s 2024 research shows that the average FCR benchmark across all industries is 69%. Industries with lower call complexity, such as retail, tend to have higher FCR rates, while those with higher complexity, like tech support, have lower rates.
You should also pay attention to these definitions:
- First call resolution rate: The percentage of customer issues resolved in a single interaction.
- Average handle time: The average time taken to resolve a customer concern, including talk, hold, and transfer times.
Tracking these call center metrics in your dashboard helps you set realistic goals and measure progress. You can quickly identify trends, such as rising call abandonment rates or declining customer satisfaction, and take action before they affect your business.
Integration with FineBI in a Call Center Dashboard
You can unlock the full potential of your call center dashboard by integrating it with FineBI. FineBI connects to over 60 data sources, including databases, cloud warehouses, and APIs. This integration gives you a unified view of all your call center data, making your dashboard more powerful and accurate.
FineBI’s workflow supports every stage of dashboard creation:
- Data Integration: Connect to multiple sources and schedule updates, so your dashboard always reflects the latest information.
- Data Processing: Build datasets with joins, formulas, and hierarchies. You can clean and refine your data before it appears on your dashboard.
- Visual Exploration: Use drag-and-drop tools to create charts and tables. FineBI recommends the best visualization for your data, helping you highlight key KPIs and trends.
- Publishing & Governance: Share dashboards securely with your team. FineBI supports role-based access, so only authorized users see sensitive information.
You can monitor real-time performance and call resolution rates with FineBI’s real-time dashboards. The platform supports self-service dashboard creation, so you do not need advanced technical skills to build or customize your call center dashboard. FineBI’s real-time insights help you spot issues as they arise, such as sudden spikes in call abandonment or drops in customer satisfaction.
FineBI also supports collaboration. You can share dashboards, datasets, and reports with your team, making it easy to align on goals and strategies. With FineBI, your call center dashboard becomes a central hub for performance metrics, call analytics, and actionable insights.
Contact Center Dashboard vs. Call Center Dashboard
Differences and Similarities in a Call Center Dashboard
You may wonder how a contact center dashboard compares to a call center dashboard. Both tools help you monitor and improve customer service operations, but they serve different purposes. A call center dashboard focuses on real-time metrics and agent performance. You use it to track average handle time, first call resolution rate, and agent productivity. These metrics help you manage phone-based support and optimize team efficiency.
A contact center dashboard covers a broader range of customer interactions. You can track service levels and customer experience across multiple channels, such as email, chat, and social media. This dashboard gives you a complete view of customer engagement, not just phone calls.
Here are the main differences and similarities:
- Call center dashboards emphasize real-time metrics and agent performance.
- Contact center dashboards include broader metrics related to customer experience across multiple channels.
- Both dashboards help you visualize key metrics and trends.
- You use both dashboards to identify areas for improvement and make data-driven decisions.
| Feature | Call Center Dashboard | Contact Center Dashboard |
|---|---|---|
| Focus | Phone support metrics | Multi-channel customer experience |
| Metrics Tracked | AHT, FCR, agent performance | Service levels, interaction volume |
| Channels Supported | Voice only | Voice, email, chat, social media |
| Use Case | Optimize call handling | Enhance overall customer journey |
Choosing the Right Dashboard Solution for Your Call Center Dashboard
You need to consider several factors when choosing between a contact center dashboard and a call center dashboard. Ease of use matters because you want your team to access insights quickly. Customization lets you tailor the dashboard to your business needs. Comprehensive business insights help you understand performance across all channels.
Seamless integrations allow you to connect the dashboard with your existing systems. Real-time and historical metrics give you a complete picture of your operations. Employee and team leader feedback ensures the dashboard supports your workflow.
Consider these points:
- Choose a dashboard that is easy for your team to use.
- Look for customization options to match your business requirements.
- Make sure the dashboard provides both real-time and historical data.
- Check for integration capabilities with your current tools.
- Gather feedback from employees and team leaders before making a decision.
Tip: Select a dashboard that grows with your business and adapts to new channels or changing customer needs.
When you evaluate these factors, you can select a dashboard that improves efficiency, supports your goals, and enhances customer experience.
Utilizing Call Center Dashboard Effectively
Best Practices for Implementation in a Call Center Dashboard
When you start utilizing call center dashboards, you should follow proven best practices to maximize adoption and effectiveness. Begin by creating customized dashboards that align with your business requirements. Use role-based layouts so supervisors, agents, and managers see the most relevant information. Select the key performance indicators that matter most, such as first contact resolution and customer experience KPIs. Apply your company’s branding to the dashboard for a professional look. Connect the dashboard with other business systems, like CRM and ticketing platforms, to get a comprehensive view of customer experiences and operational efficiency.
| Best Practice | Description |
|---|---|
| Create customized call center dashboards | Align dashboards with unique business requirements, using role-based layouts for different users. |
| Use role-based dashboards | Tailor metrics and layouts for supervisors, agents, and managers to meet their specific needs. |
| Select the KPIs | Choose the most relevant KPIs from predefined metrics or create custom ones. |
| Apply branding | Match the dashboard's appearance with company identity using themes and colors. |
| Connect with other business systems | Integrate with CRM and ticketing systems for a comprehensive view of call metrics and business KPIs. |
| Real-time updates | Ensure immediate monitoring of call volume and agent status to act quickly when issues arise. |
| Streaming updates | Continuously refresh data for real-time insights into customer sentiment and agent performance. |
| Dashboard refresh intervals | Set custom refresh rates to optimize data accuracy and efficiency. |
| Live agent activity | Monitor individual agent performance in real time for effective coaching and support. |
Avoid common pitfalls such as overcrowded dashboards, vague KPIs, and insufficient user training. Make sure every dashboard has a clear purpose and aligns with your business strategy. Listen to customer feedback to improve dashboard usability and relevance.
Customization with FineBI in a Call Center Dashboard
FineBI gives you powerful customization options for your call center dashboard. You can combine components and set styles to make dashboards attractive and easy to use. Adjust padding, bar chart density, and gauge styles to highlight key metrics. FineBI lets you group crosstabs, set table backgrounds, and choose pie chart styles to match your reporting needs. You can also modify line chart mark points and radar chart styles to visualize trends in customer satisfaction and agent performance. FineBI supports map area color changes, so you can display customer experiences by region.
| Feature | Description |
|---|---|
| Component Combination | Combine components and set styles for enhanced dashboard attractiveness. |
| Padding Configuration | Resize padding for components like indicator cards. |
| Inter-bar Spacing | Adjust bar chart display density for multi-series charts. |
| Gauge Style | Modify size, style, tick mark thickness, and rounded corners. |
| Crosstab Grouping | Drag indicator names to dimensions for optimized display. |
| Table Style | Set background color and font style for summary rows. |
| Pie Chart Style | Choose between filled or hollow pie charts. |
| Line Chart Mark Points | Distinguish trends through colors and mark points. |
| Radar Chart Style | Set polar axis to polygon or round and customize mark points. |
| Map Area Color | Modify color of areas with empty data values. |
You can encapsulate dashboards for PC display and adjust partition lines for clarity. These features help you present customer experience KPIs and satisfaction metrics in a way that supports decision-making and team collaboration.
Improving Performance and Customer Experience with a Call Center Dashboard
Utilizing call center dashboards helps you drive measurable improvements in agent performance and customer experiences. Dashboards provide real-time visibility into metrics like average handle time, first contact resolution, and customer satisfaction. You can monitor agent adherence and ticket resolution times, which promotes accountability and motivates agents to meet their targets. Managers use dashboards to assess team progress and address individual performance issues promptly. Recognizing positive trends in customer experiences encourages agents and boosts satisfaction.
Dashboards ensure smooth operations and optimal efficiency by providing immediate access to key performance indicators. You can celebrate agent successes and make data-driven adjustments in real time. Many business leaders believe self-service dashboards give a competitive advantage. You see measurable improvements such as decreased average handle time, improved first contact resolution rates, increased agent productivity, and reduced abandonment rates. FineBI's collaborative features let you share dashboards and insights across teams, supporting continuous improvement in customer experiences and operational efficiency.
A call center dashboard gives you the tools to drive performance, improve customer satisfaction metrics, and boost operational efficiency. When you implement a dashboard, you see outcomes such as self-service empowerment, reduced wait times, and motivated agents. You also benefit from seamless omnichannel experiences and ongoing quality improvements.
| Consideration | Description |
|---|---|
| Training Strategies | Proper training helps agents use the dashboard effectively. |
| Implementation Roadmap | A clear plan ensures a smooth transition. |
| Contingency Planning | Preparation for challenges keeps disruptions minimal. |
| Change Management | Addressing resistance helps your team adapt to new tools. |
Future dashboards will use AI and advanced analytics to provide deeper insights and better visualizations. You should review your current approach and consider FineBI for scalable, real-time analytics and self-service decision-making.
Continue Reading About Call Center Dashboard
What is a Dashboard and How Does It Work
Store Performance Dashboard: Your Retail Command Center
How to Craft an Effective Analytics Dashboard
What is a Digital Dashboard and How Does It Work
What is a KPI Dashboard and Why Your Business Needs One


FAQ

The Author
Lewis
Senior Data Analyst at FanRuan
Related Articles

How to Build an Investment Portfolio Reporting Dashboard for Executives: KPIs, Benchmarks, and Drill-Down Views
Investment portfolio reporting for executives is not about showing every holding, transaction, and chart your investment team can produce. It is about giving CEOs, CFOs, CIOs, boards, and investment committees a fast, re
Yida YIn
Jun 25, 2026

12 KPI Reporting Examples for Executive Dashboards: What to Show in Weekly, Monthly, and Quarterly Reviews
Executive leaders do not need more data. They need decision ready $1 examples that match how often they review the business and what actions they are expected to take. A weekly $1 should surface fast moving risks and per
Yida YIn
Jun 25, 2026

How to Build a Digital Marketing Reports Dashboard: Executive Examples, KPIs, and Templates
A $1 is the control layer that helps executives and marketing leaders turn scattered channel data into fast, confident decisions. If you are a CEO, CMO, operations director, or marketing analytics lead, the real problem
Yida Yin
May 07, 2026