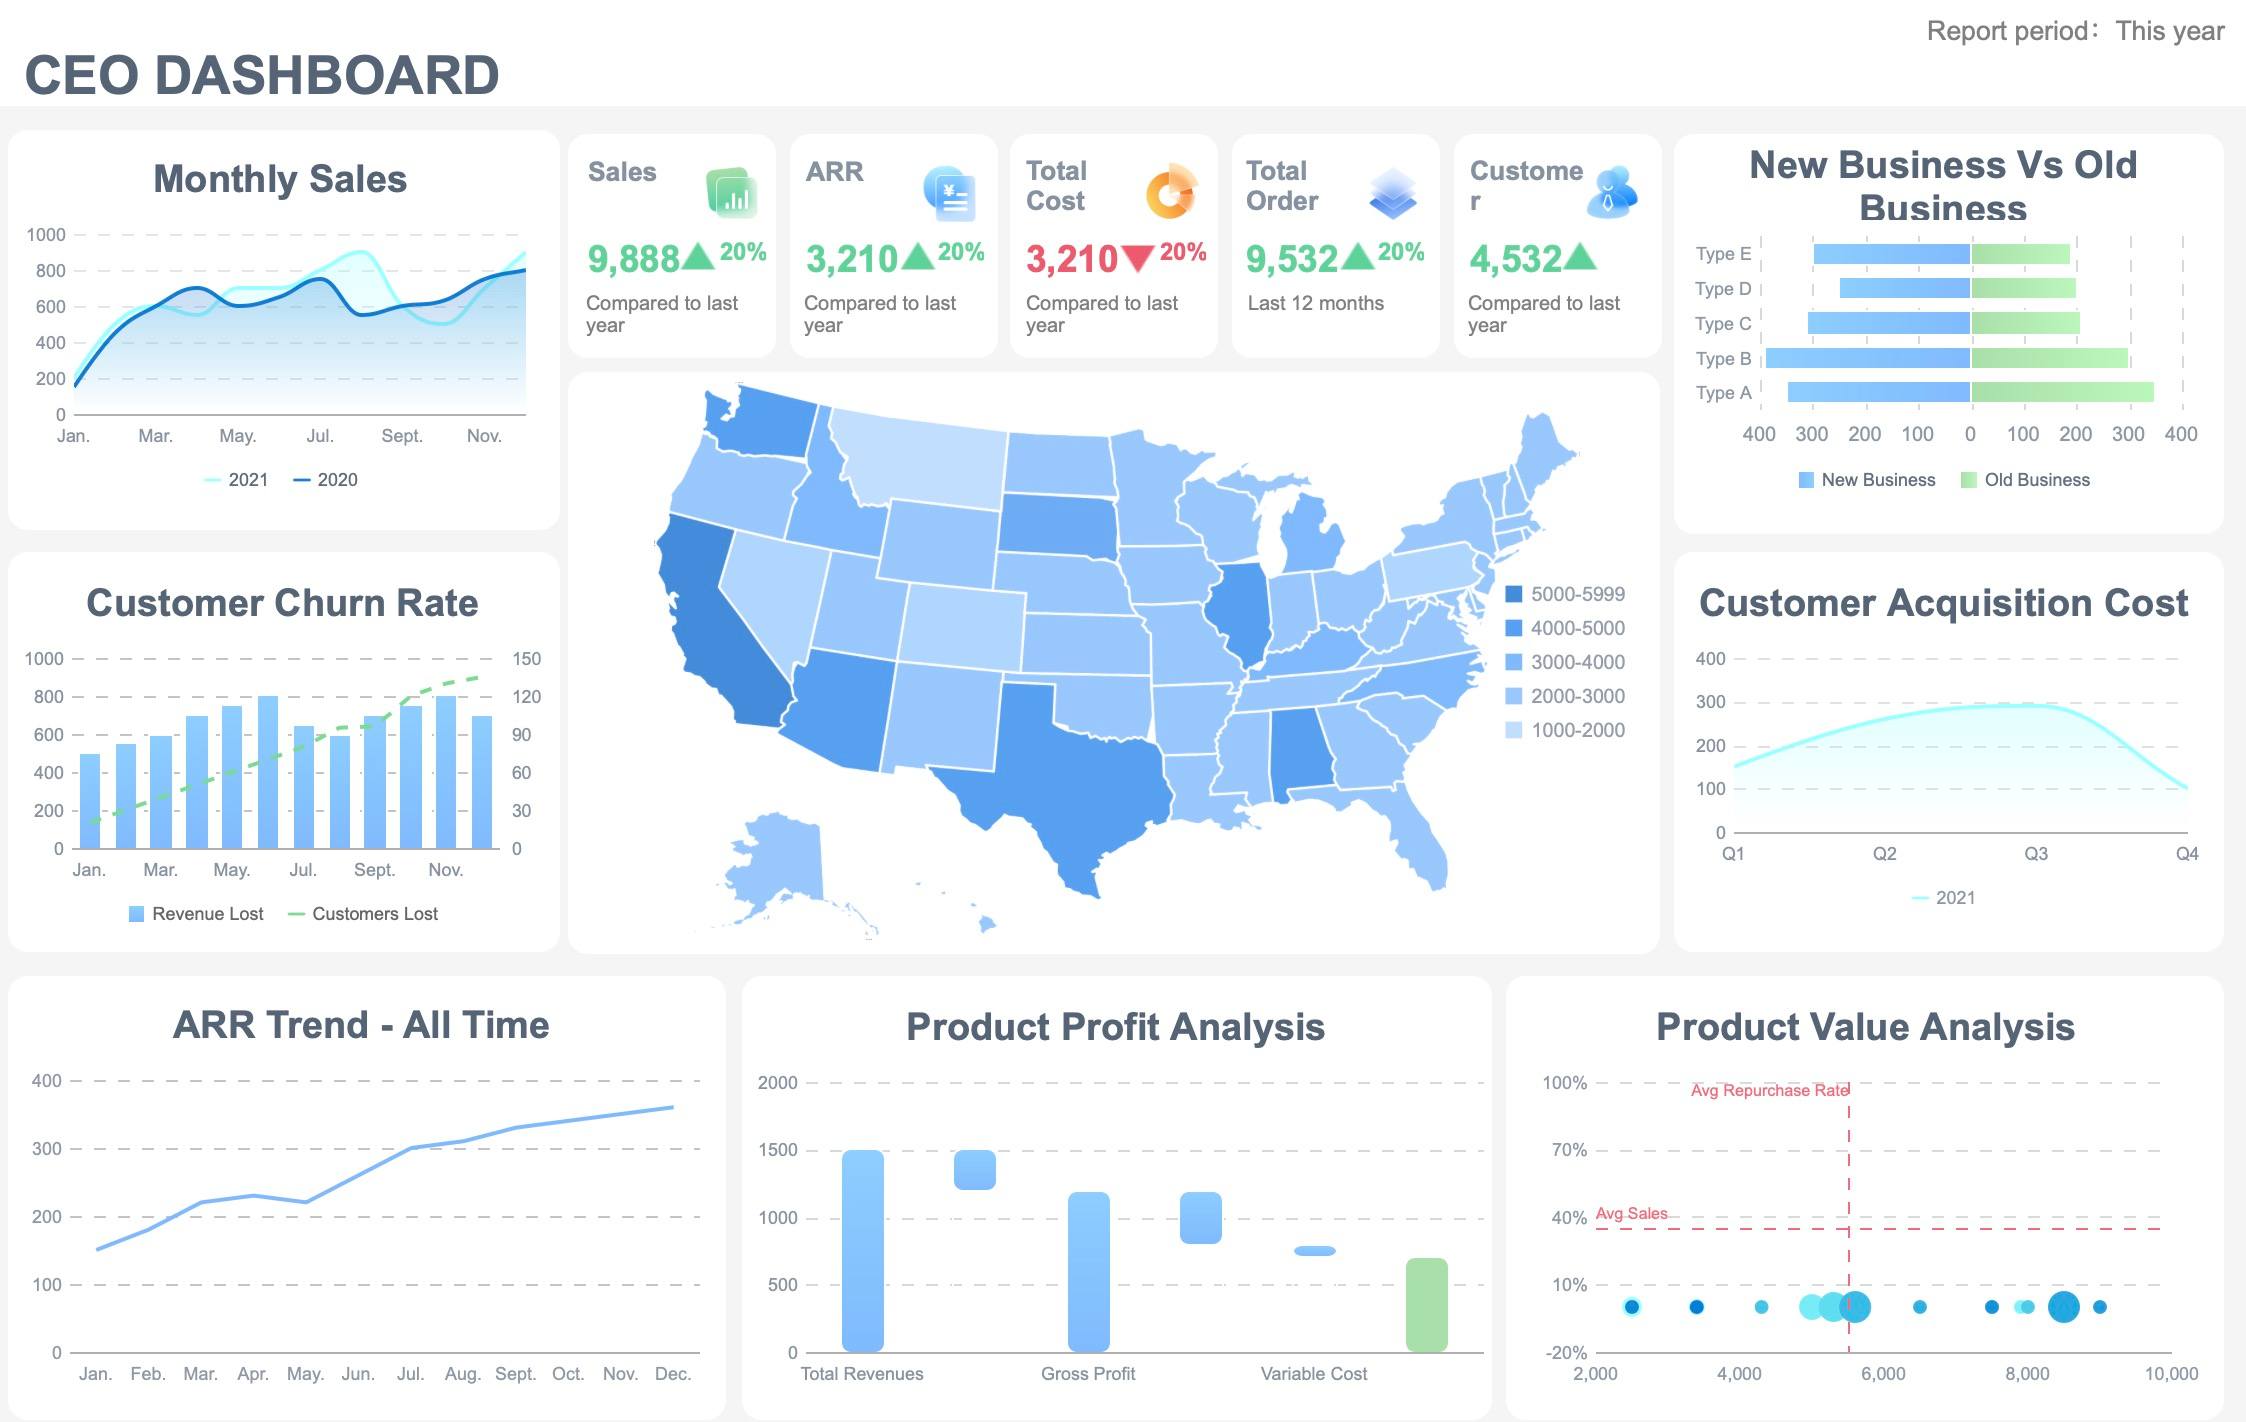
You use the ceph dashboard to manage and watch over your storage system. This tool gives you a web-based management experience that feels simple and friendly. You can check the health of your data, see reports, and control important settings. With just a few clicks, you make smart choices and solve problems quickly.
You use the ceph dashboard to help manage your ceph storage system. This dashboard is on the web and is simple to use. You can check how healthy your ceph cluster is. You can also see important numbers and change settings in one spot. The ceph dashboard lets you see everything fast, so you do not need to remember hard commands or use many tools. You get a clear view of your storage system, which makes your work easier each day.
The ceph dashboard has many features that help you do your job. Here is a table that shows some main functions:
| Feature | Description |
|---|---|
| Multi-user and role management | Lets you set up different users and roles for secure access. |
| Single Sign-On (SSO) | Allows you to log in using external identity providers. |
| Auditing | Tracks changes and actions for better security. |
| View cluster hierarchy | Shows where each storage device sits in the cluster. |
| Embedded Grafana Dashboards | Displays performance metrics in easy-to-read charts. |
| Manage OSD settings | Lets you control storage device operations. |
| Viewing Alerts | Shows current alerts so you can respond quickly. |
| Overall cluster health | Displays the status and storage use of your ceph cluster. |
| Device management | Lists all hosts and drives, showing health predictions. |
| Pools and OSDs | Lets you manage storage pools and devices. |
You use the ceph dashboard to make managing your ceph cluster easier. The dashboard is a part of the Ceph Manager Daemon. This means you can connect to all ceph parts using inside APIs. You can watch your cluster in real time and change settings right away. The dashboard also gives you a RESTful API for programs and works with Prometheus and Grafana. These things help you finish tasks faster and better.
You do not have to worry about hard steps. The ceph dashboard puts everything in one place. You can see alerts, manage devices, and check logs. Organizations like the dashboard because it saves time and helps stop mistakes. You get a tool that helps your ceph cluster work well.
The ceph dashboard helps you manage your ceph storage system. You can see your data clearly and use tools to keep things working well. Here are the main features that make this dashboard useful.
When you log in, you see a simple interface. The ceph dashboard uses a guided setup, so you do not need to be an expert. You get a fast look at your cluster’s health and how it is working. There are three main parts: a menu, a management area, and a main window. This makes it easy to find what you want.
You will see health signs, like a heart icon that changes color. There are tiles you can click for more details. Alerts stay on the screen, so you always know if something is wrong. You can change settings right in the dashboard. The dashboard tells you what each setting does. If you work with others, you can let junior admins do simple jobs.
Here is a table that shows why the user interface is easy:
| Aspect | Description |
|---|---|
| Guided Installation UI | Helps you set up the system step by step, even if you are new to ceph. |
| At-a-glance Cluster Overview | Shows a summary of health and performance as soon as you log in. |
| Intuitive UI Layout | Menu, management area, and main window make navigation simple. |
| Visual Health Indicators | Heart icon and colors show cluster health right away. |
| Interactive Tiles | Clickable tiles lead to more details and management pages. |
| Persistent Alerts | Alerts stay visible so you never miss important updates. |
| In-UI Configuration | Change settings and see what each option does, all in one place. |
| Role-Based Access Control | Assign tasks to different users based on their skills. |
FanRuan also likes dashboards that are easy to use. Like the ceph dashboard, FanRuan’s products help people see and manage data easily.
You use the ceph dashboard to watch your cluster. The monitoring screen shows how your system is doing all the time. You can see cluster health, performance, and how much space you have. You can look at Grafana dashboards for more charts. The dashboard lists all hosts, their services, and ceph versions. You can check logs, filter events, and see how each service is working.
You also get tools to handle alerts and messages. You can change settings and see details for pools and OSDs. Device management lets you check the health of drives and hosts. You can manage iSCSI targets, RBD images, CephFS clients, object gateways, and NFS exports. You can also control ceph manager modules from the dashboard.
Here are some main monitoring tools you get:
You see many types of charts in the ceph dashboard. These show cluster summaries, OSD status, pool use, growth, IOPS, speed, disk stats, and heat maps. You can also check latency, workload, and resource use for gateways.
| Category | Metrics/Visualizations |
|---|---|
| Cluster Summary | OSD config, disk size, pool counts, device class summary |
| Cluster Details | OSD status, pool usage, growth tracking, PG distribution |
| OSD Performance | IOPS, throughput, disk stats, read/write ratio, heat map |
| Object Gateway | Latency, throughput, HTTP operation breakdown |
| iSCSI Gateway | Performance, resource use, client load |
The ceph dashboard lets you do more than just watch your cluster. You can manage users and roles, set up single sign-on, and track all changes with auditing. You can see the cluster hierarchy to find where each OSD is. You can also set up ceph manager modules and add Grafana dashboards for better tracking.
Here is a table that explains the main management functions:
| Management Function | Description |
|---|---|
| Multi-user and role management | Set up different users and roles for secure access. |
| Single Sign-On (SSO) | Log in with external identity providers using SAML 2.0. |
| Auditing | Track all changes and actions for better security. |
| Viewing cluster hierarchy | See the CRUSH map to find OSD locations and solve issues. |
| Configuring manager modules | View and change settings for ceph manager modules. |
| Embedded Grafana dashboards | Add Grafana dashboards for advanced performance metrics. |
You can do all these jobs from the web dashboard. This saves you time and helps you make fewer mistakes.
You always know what is happening in your ceph system because alerts and notifications stay on the dashboard. If something goes wrong, you see it right away. The dashboard lets you set alert rules and pick how you get messages. You can fix problems fast and keep your data safe.
You can also look at old alerts and see what was done. This helps you learn from problems and make your system better.
You control who can do what in your ceph dashboard. You set up users and give them roles for their jobs. For example, junior admins can do easy tasks while you handle important settings. The dashboard works with single sign-on, so you can use your company login. Auditing keeps track of every change, so you always know who did what.
This focus on security and roles helps your team work safely and well. FanRuan also believes in strong security and clear roles, so only the right people can see important data.
You can change the ceph dashboard to fit your needs. You can make your own Grafana dashboards to show the numbers you care about. You set up alerts and health checks for your cluster and services. You can manage NFS exports, OSDs, and user access all in one place.
The dashboard lets many users work at the same time. You can change how things look and add new features as your group grows. This helps you get the most from your ceph system.
Here is a table of customization options:
| Customization Feature | Description |
|---|---|
| Custom Grafana Dashboards | Build dashboards for your own needs. |
| Alerts and Health Status | Set up alerts for the whole cluster and key services. |
| Performance Metrics | Choose which performance numbers to track. |
| NFS Module | Create NFS exports from the dashboard. |
| OSD Management Screen | Manage hard drives in one place. |
| Multi-User Support | Let many users work together at the same time. |
Both the ceph dashboard and FanRuan’s solutions make dashboards easy and strong for data work. This helps you manage your data with confidence and clarity.
You use the ceph dashboard to manage your cluster easily. The dashboard shows everything in one place. You do not need to remember hard commands. You do not switch between different tools. You see hardware details and alerts right away. You can make changes from the dashboard. You create NFS exports and manage settings without the command line. This saves time and helps you make fewer mistakes. You feel confident as you finish ceph cluster tasks fast.
You get updates about your ceph cluster’s health and performance in real time. The dashboard shows live numbers and alerts, so you always know what is happening. Automated health checks run in the background and keep you updated. You track important numbers visually, so it is easy to understand your cluster’s status.
| Feature | Description |
|---|---|
| Real-time Monitoring | The dashboard gives live updates on cluster health and performance. |
| Built-in Health Checks | It has automated checks to see how healthy the cluster is. |
| Visual Monitoring | You can track numbers and alerts with the web interface. |
You use these updates to make smart choices. You find problems quickly and fix them before they hurt your business. You check performance and find the best settings for your system. You look at old data to plan for growth. This helps you use resources well and keep your ceph cluster working smoothly.
You improve quality control in manufacturing with dashboards like ceph. You watch production lines in real time and spot defects early. You use data to make decisions and keep quality high. FanRuan’s tools, like FineReport, help you track qualification rates, defect rates, and scrap rates. You look at trends and find the causes of problems. You change dashboards to fit your needs and share results with your team.
You use ceph’s data management with FanRuan’s quality control tools. This gives you a strong base for efficient work and real-time monitoring. You make better choices, improve product quality, and make customers happier.
Big companies can have trouble managing lots of data. BOE is a tech leader and had these problems too. They wanted to use data for decisions, but trusting their numbers was hard.
You might see these problems at your job:
BOE also had different rules for data. This made records confusing and hard to compare. Sometimes, important papers went missing. Not knowing enough made it hard to see the whole picture. These things slowed them down and made it tough to get better.
The right tools can fix these problems. BOE used dashboards to put all their data in one place. This made it simple to understand. They built a system to see everything together. Here are some ways BOE solved their problems:
| Solution Name | Description | Purpose |
|---|---|---|
| I3Plat | A platform that uses AI for standardizing detection and boosting efficiency | Centralizes data and improves production quality |
| Resource Sharing Center | Shares resources across factories | Helps teams work together and use resources better |
| On-site Training | Training at factory sites | Builds skills and makes work smoother |
| Edge-side Inference Platforms | Processes data in real time at the edge | Makes response times faster and improves efficiency |
Dashboards help you watch important numbers, find problems, and share results with your team. The ceph dashboard works like this too. It helps you manage your ceph system, check health, and fix issues fast.
Dashboards can give you big results. BOE lowered inventory costs by 5% and worked 50% faster. They used dashboards to watch numbers, compare factories, and spot risks early. This helped them make smart choices and get better every day.
You can use the ceph dashboard to do the same things. You see your ceph cluster clearly. You find and fix problems before they get big. You help your team work together and keep data safe. Dashboards like ceph and FanRuan help you make good choices and grow your business.
You can make ceph cluster management easier with a simple dashboard. The web tools show you what is happening right now. This helps you make good choices. You see all your object storage information in one spot. You can improve how you manage data by using Ceph Dashboard with FanRuan solutions.


The Author
Lewis Chou
Senior Data Analyst at FanRuan
Related Articles
Executive Summary Dashboard for Enterprise Leaders: 9 Steps to Design KPIs, Layout, and Governance
Learn 9 steps to design an executive summary dashboard for enterprise leaders. Define KPIs, layout, and governance for better strategic decision-making.
Lewis Chou
May 04, 2026

Executive Dashboard Template: What Enterprise Leaders Should Include Before They Build
Learn what to include in an executive dashboard template for better decision-making. Focus on KPIs, risk signals, and strategic alignment for leadership teams.
Lewis Chou
May 04, 2026
How to Build a Teams Call Queue Dashboard: Turn Raw Queue Data Into Actionable Insights
Learn how to transform raw Teams call queue data into a dashboard for real-time monitoring, trend analysis, and proactive service level management.
Lewis Chou
May 04, 2026


