You want to make a dashboard courier solution. It helps you see things better and makes logistics management simple. A logistics dashboard gives you real-time information. This helps you find problems fast and work better. FineReport give you tools to build dashboards. These dashboards can grow and change with your needs. When you use supply chain analytics and logistics KPIs, you make better choices. You can also react faster when things change. Surveys say almost nine out of ten shippers use KPIs every week. This shows that data-driven dashboards are very important for logistics.

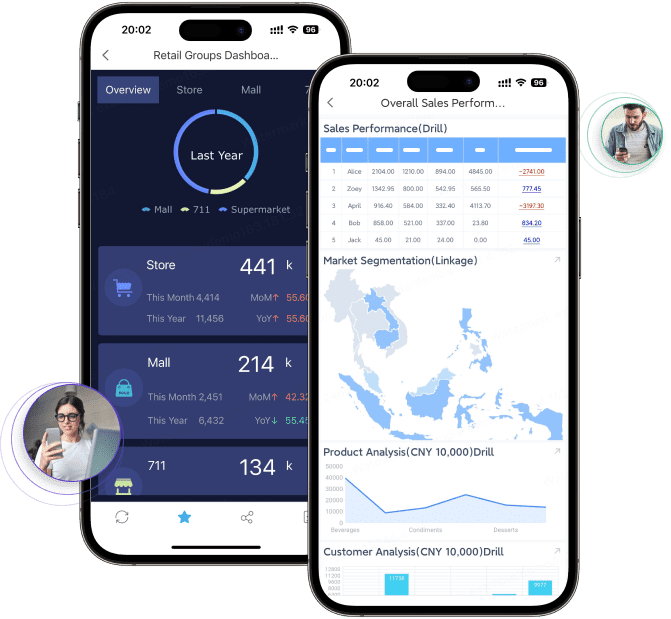
A logistics dashboard is a tool that shows important supply chain information. It gives you real-time pictures of how things work. You can see shipments, orders, and inventory in one spot. FanRuan is a leader and offers dashboards like Order to Delivery Analysis and Inventory Optimization. These dashboards help you check key numbers, find problems, and make smart choices. You can use a logistics kpi dashboard to watch your most important numbers and make your business better every day.
You need a logistics dashboard to keep your business running well. It lets you see your logistics kpi dashboard clearly and helps you act fast when things change. The table below lists the main benefits:
| Benefit | Description |
|---|---|
| Real-time visibility | Shows live logistics KPIs and gives instant information about operations. |
| Decision support | Puts important data in one place to help you make good choices for your business. |
| Improving response times | Helps you react faster to changes and makes logistics more flexible. |
Dashboards help you make better choices. Some companies use predictive dashboards to change shipment routes before delays happen. This leads to faster deliveries and happier customers. Sharing real-time updates builds trust and keeps customers coming back. A logistics dashboard helps you gather and use data for better analytics. You can track every kpi and see how your team is doing. With the right dashboard, you use data to take action and keep your logistics strong.
You need the right parts to make your dashboard courier work well. Each part helps you see how your logistics work. The table below lists the main parts you should have in your logistics dashboard:
| Component | Description |
|---|---|
| Maps | Show where routes and warehouses are. You can make logistics better with geospatial data. |
| Stacked Bar Charts | Help you compare shipping amounts and delivery rates. You can find problems fast. |
| Tables | Let you look at order history and shipping plans. You can find trends in your logistics data. |
| KPIs | Use scorecards or gauges to check how logistics are doing. You get a quick look at performance. |
| Cards | Show total shipments and average delivery time. You can quickly see how logistics are doing overall. |
| Filters/Slicers | Let you focus on certain data. You can learn more about your logistics operations. |
You need to track the right kpi metrics to keep your logistics kpi dashboard helpful. These KPIs help you measure how things are going and find ways to get better. Here are the most important KPIs for your logistics dashboard:
Watching these KPIs on your logistics kpi dashboard helps you make delivery times better and lower costs. You can find problems and change routes or steps. Many companies use dashboards to watch planning time and help drivers do more. This makes customers happier and means fewer complaints.
FineReport gives you strong tools for your logistics kpi dashboard. You can see real-time data and get updates right away. FineReport works on phones and tablets, so you can check your dashboard courier anywhere. The table below shows how FineReport helps your logistics analysis:
| Feature | Description |
|---|---|
| Mobile Compatibility | Lets you see reports and dashboards anywhere. You always stay connected to your logistics data. |
| HTML5 Rendering | Gives you real-time updates. You always see the newest data on your logistics dashboard. |
| Visualization Options | Lets you use charts, maps, and tables for better analysis and choices. |
FineReport helps you check rules and cut down on mistakes. You can use predictive analytics to find risks early and change shipments. Many companies save time and money by using dashboards to watch performance in real time. You get more control over your logistics data and make better choices with your logistics kpi dashboard.
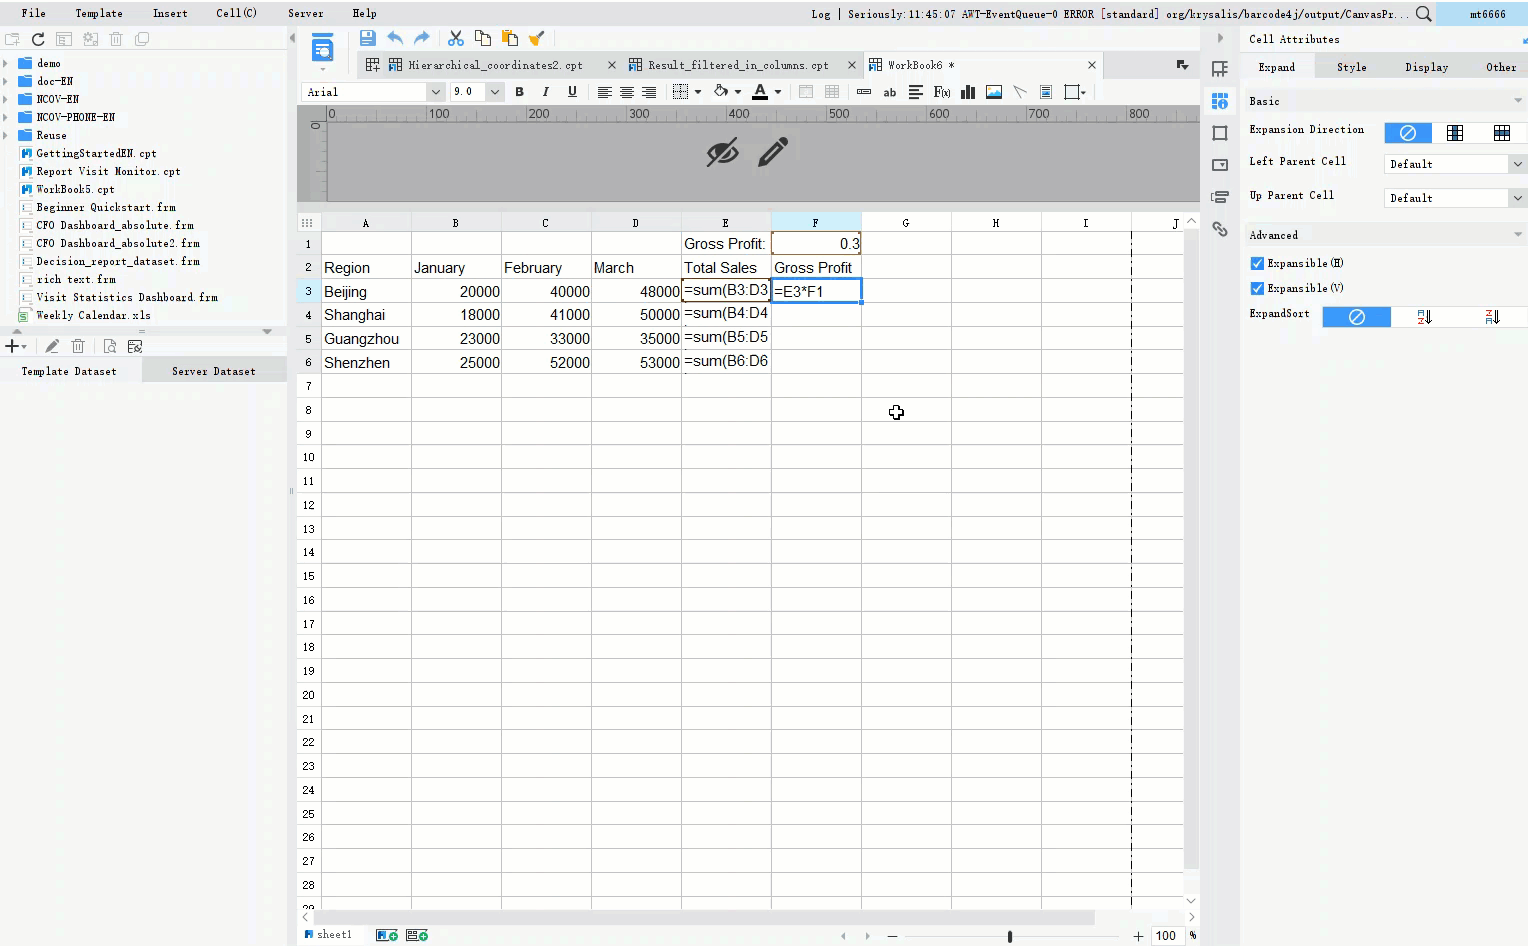
First, you connect your data sources. FineDataLink helps you bring together information from warehouse systems, transportation management, and sales platforms. You use ETL to move and clean your data. This makes your logistics dashboard correct and trustworthy.
Here are some best ways to use ETL for your logistics dashboard:
FineDataLink lets you do these steps automatically. You can match data across tables right away. This gives you a strong base for your logistics kpi dashboard. You can track on-time delivery and other kpi metrics without waiting.
You make your dashboard courier easy for managers to use. FineReport gives you tools you can drag and drop. You can build reports and dashboards without writing code. You add charts, maps, and tables to show real-time numbers and kpi data.
The table below shows features that make dashboards better for users:
| Feature | Benefit |
|---|---|
| Easy Drag-and-Drop Reporting | You make reports fast. You do not need special skills. |
| Real-Time Calculation & Analysis | You use the newest data to decide things. This helps you act quickly in logistics. |
| Advanced Data Visualization | You can change dashboards to fit your business. |
| Enterprise-Level Collaboration | You and your team can work together at the same time. This makes work faster. |
| Robust Security & Scalability | You keep your data safe and grow your dashboard as your business gets bigger. |
You use trackmaps to show where delivery trucks and staff go. Trackmaps show points on a map that move with animation. You can see how fast things move, their color, and the order they go. This helps you watch deliveries and check on workers in the field.
FineReport lets you show reports and dashboards in many ways. You can see data in different styles. You use management analysis to make accounting and sales easier. IoT visualization helps you stop using paper and start using digital tools. Data entry features help you fill out forms and make fewer mistakes. You move from Excel and Access to a strong logistics dashboard.
You use automation to save time on data tasks. FineReport lets you set up reports and update data by itself. You make rules to check data and send alerts when things change. You use automation to watch kpi metrics like on-time delivery and fill rate.
Keeping data safe is important. You lock sensitive data and use strong security steps. You follow rules like GDPR and CCPA. You check your dashboard courier for dangers. Multi-factor authentication and end-to-end encryption keep your data safe when it moves. You use zero-trust frameworks so no one is trusted right away.
You build your logistics kpi dashboard to grow with your business. FineReport can handle lots of data and many users. You can add new data sources and make your dashboard bigger. You keep your logistics dashboard working well and fast.
You can see real results with FineReport. Kintetsu World Express (China) made the Kintetsu Business Reporting system with FineReport. They joined many data sources, like Electronic Data Interchange. Sales teams could see customer information, such as past visits and cargo amounts. Each customer got a real-time dashboard. This made information easier to manage and helped operations run better.
You use supply chain analytics to study logistics data. You watch deliveries, inventory, and sales. You check real-time numbers and kpi data. You make choices using good analysis. Your logistics dashboard helps you make delivery times better and keep customers happy.
You can use supply chain analytics with your dashboard courier to make smarter choices in logistics. Real-time data shows what is happening right now. You see shipments, inventory, and deliveries as they happen. This helps you find problems early and fix them fast.
Here are ways supply chain analytics and dashboards help you:
When you use real-time data in your logistics dashboard, you get clear benefits. The table below shows how real-time dashboards help logistics:
| Benefit | Measurement/Impact |
|---|---|
| Productivity and Profitability | Companies say they are 5 to 6 percent more productive and profitable. |
| Delay Reduction | Real-time shipment tracking can cut delays by up to 58%. |
| Response Time Improvement | Warehouses using real-time data respond to disruptions 50% faster. |
You also get early alerts for delivery issues. Teams can act quickly and keep shipments moving. You control costs better because you see expenses right away. This stops budget problems and keeps logistics running smoothly.
FanRuan’s manufacturing supply chain management solution gives you strong tools for analysis. You connect data from procurement, inventory, and sales. You use dashboards to see all your logistics information in one place. This helps you track on-time delivery and other kpi metrics.
You can use supply chain analytics to study trends and improve performance. FanRuan’s solution lets you manage inventory, make deliveries better, and decide things using real-time data. You lower risks and keep your logistics strong. With dashboards, you see every step of the supply chain and act fast when things change.


The Author
Lewis Chou
Senior Data Analyst at FanRuan
Related Articles
SOC Dashboard Explained: 12 Essential KPIs, Views, and Workflows Security Teams Use
A soc dashboard is the operational layer that turns security data into decisions. For SOC managers, analysts, and incident responders, its business value is simple: faster detection, smarter prioritization, cleaner hando
Eric
Jan 01, 1970

EMR Dashboard Guide: 12 Metrics to Track for Faster Clinical and Operational Decisions
Learn the 12 essential EMR dashboard metrics to track for faster clinical and operational decisions, improving patient flow and revenue cycle management.
Lewis Chou
May 05, 2026
Talent Acquisition Dashboard: A Scenario-Based Guide to Faster, Better Hiring Decisions
Learn how a talent acquisition dashboard provides a decision-ready view to identify hiring bottlenecks, improve candidate quality, and accelerate recruitment.
Lewis Chou
May 05, 2026


