A digital marketing dashboard gives you a centralized view of your key marketing metrics. You use a dashboard to aggregate and visualize data from multiple channels, making it easier to measure campaign performance. Many marketers struggle with fragmented data, missing touchpoints, and attribution issues. You often see gaps in customer journey tracking and difficulty connecting marketing activities to business outcomes. A dashboard helps solve these problems by bringing all your data together, allowing you to track ROI and optimize campaigns more effectively.
Digital Marketing Dashboard Basics
Definition
A digital marketing dashboard gives you a single place to view and track your most important marketing metrics. You use this dashboard to collect, organize, and display data from all your digital marketing channels. This helps you see how your campaigns perform in real time. Most industry experts agree that a digital marketing dashboard includes several key components. The table below shows the main elements you will find in most definitions:
| Key Components | Description |
|---|---|
| Digital Marketing/Social Metrics | Metrics such as Facebook CTA Clicks, Impressions, and Google Customer Actions. |
| Search Engine Marketing Metrics | Includes Impressions, Clicks, Keyword Ranking, and Organic Traffic. |
| Calculated Metrics | Metrics like ROI, CPA, and Customer Lifetime Value. |
| High-Level Marketing/Sales Metrics | Metrics such as Marketing Qualified Leads, Revenue by Source/Channel, and Funnel Conversion Rates. |
You can use a digital marketing dashboard to bring together all these metrics. This makes it easier to compare results across different platforms and campaigns.
Purpose
The main function of a marketing dashboard is to help you understand your marketing performance at a glance. You can use it to:
- See a visual representation of your key performance indicators (KPIs) and marketing metrics.
- Analyze and summarize your digital marketing campaigns and channels in real time.
- Integrate data from multiple sources, so you can spot trends and make better decisions.
A marketing dashboard gives you a clear overview of your data. You can quickly identify what works and what needs improvement. For example, you might notice that your social media campaigns drive more clicks than your email campaigns. You can then adjust your strategy based on these insights.
FineBI provides a strong example of how a dashboard can aggregate data from many sources. You can use FineBI to connect to databases, cloud platforms, and even APIs. The table below shows how FineBI supports different types of dashboards by bringing together data from various systems:
| Dashboard Type | Description |
|---|---|
| Supply Chain Dashboard | Enables real-time monitoring and analysis of supply-chain activities, combining order, inventory, and logistics data. |
| Sales Dashboard | Monitors key KPIs like revenue and conversion rates, integrating data from various sales sources. |
| Financial Position Analysis Dashboard | Evaluates a company's financial health, consolidating data from multiple financial sources. |
| Project Management Dashboard | Consolidates task management, scheduling, and resource allocation data for effective project monitoring. |
With FineBI, you can create a digital marketing dashboard that pulls in data from all your marketing tools. This unified view helps you track metrics, measure ROI, and optimize your campaigns more effectively.
Why a Digital Marketing Dashboard Matters
Key Benefits
A digital marketing dashboard gives you a powerful tool for making smarter decisions. You see all your marketing metrics in one place, which helps you understand what works and what needs improvement. When you use a marketing dashboard, you align your goals with your data. This alignment makes your strategy more effective and helps you reach your targets faster.
Marketing data plays a crucial role in enabling you to make informed decisions at both tactical and strategic levels. This leads to improved performance and greater flexibility in your strategy.
You can customize your dashboard to fit your needs. You track the performance of your marketing efforts and keep your team on the same page. With a marketing dashboard, you spend less time on manual reporting and more time focusing on your campaigns. This shift allows you to deliver better results and increase revenue.
Here are some of the most significant benefits you gain from using a marketing dashboard:
- Customize your dashboard to your business goals.
- Track the performance of your marketing efforts with clear metrics.
- Keep your team informed and aligned.
- Improve data integration across all your channels.
- Monitor performance in real time.
- Enhance decision-making with actionable insights.
- Increase efficiency in reporting and analysis.
A good marketing dashboard transforms complex data into simple, actionable stories. You can monitor your metrics in real time and make confident, data-driven decisions. This approach empowers you to respond quickly to changes and optimize your strategy for better results.
Real-Time Insights
Real-time insights set a digital marketing dashboard apart from traditional reporting tools. You get immediate access to your data, which means you can adjust your campaigns as soon as you spot trends or issues. Marketing dashboards integrate various data sources and visualize key performance indicators in a unified interface. This integration enables you to monitor campaign performance without delay.
- Immediate access to data allows you to make quick adjustments to your strategy.
- Real-time analytics help you respond to market changes and improve resource allocation.
- Dashboards turn large-scale data into clear visuals, making it easier to identify opportunities and monitor performance.
FineBI enhances these capabilities with advanced real-time analysis and visualization features. You engage directly with your data using self-service BI tools. The drag-and-drop interface lets you create interactive dashboards, even if you have limited technical skills. FineBI’s dashboards bridge the gap between data analytics and business strategy. You translate complex metrics into understandable formats for your team and stakeholders. This accessibility enables you to make faster, more informed decisions and stay ahead in a competitive market.
When you use FineBI, you benefit from:
- A user-friendly drag-and-drop interface for building dashboards.
- Interactive dashboards that make your data easy to explore.
- Self-service features that let you analyze metrics without technical barriers.
- Visualization tools that help you quickly identify trends and opportunities.
A digital marketing dashboard powered by FineBI gives you the flexibility and speed you need to optimize your campaigns. You can track metrics, analyze data, and make data-driven decisions with confidence.
Digital Marketing Dashboard Features
Essential Metrics
When you use a marketing performance dashboard, you gain a clear view of your most important metrics. These metrics help you measure the success of your campaigns and guide your data-driven decisions. A digital marketing dashboard brings all your key metrics together, so you can track progress and spot trends quickly. The most commonly tracked metrics in a marketing dashboard include:
- Customer Acquisition Cost (CAC)
- Customer Lifetime Value (CLTV)
- Return on Investment (ROI)
- Return on Ad Spend (ROAS)
- Website Traffic
- Conversion Rate
- Cost Per Click (CPC)
- Click-Through Rate (CTR)
- Engagement Rate
- Average Engagement Time
- Organic Search Traffic
You should select metrics that align with your business goals. By focusing on these metrics, your marketing performance dashboard will help you understand what drives results and where you can improve.
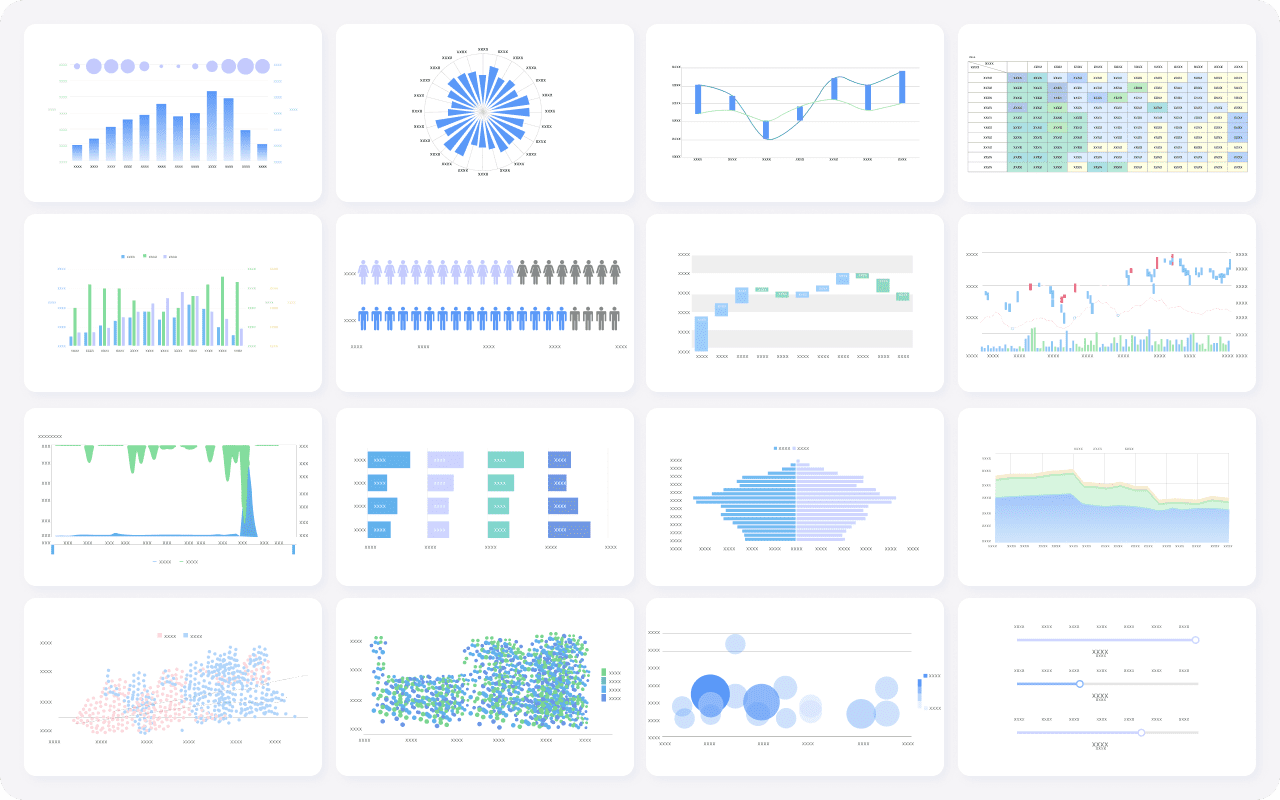
Visualization Tools
A marketing dashboard uses visualization tools to turn complex data into easy-to-understand visuals. These tools help you see patterns and compare metrics across different campaigns. The table below shows some of the most effective visualization tools for a digital marketing dashboard:
| Visualization Tool | Description |
|---|---|
| Bar Charts | Great for comparisons, such as month over month. |
| Line Charts | Ideal for long-term trend analysis. |
| Scorecards | Quick look at the most important KPIs. |
| Pie Charts | Useful for showing distribution among a few categories. |
| Filters | Allow switching between views or date ranges. |
| Area Charts | Effective for seeing distributions over time. |
You can use these tools to highlight your most important metrics. Visualization makes it easier to share insights with your team and take action based on your data.
FineBI Highlights
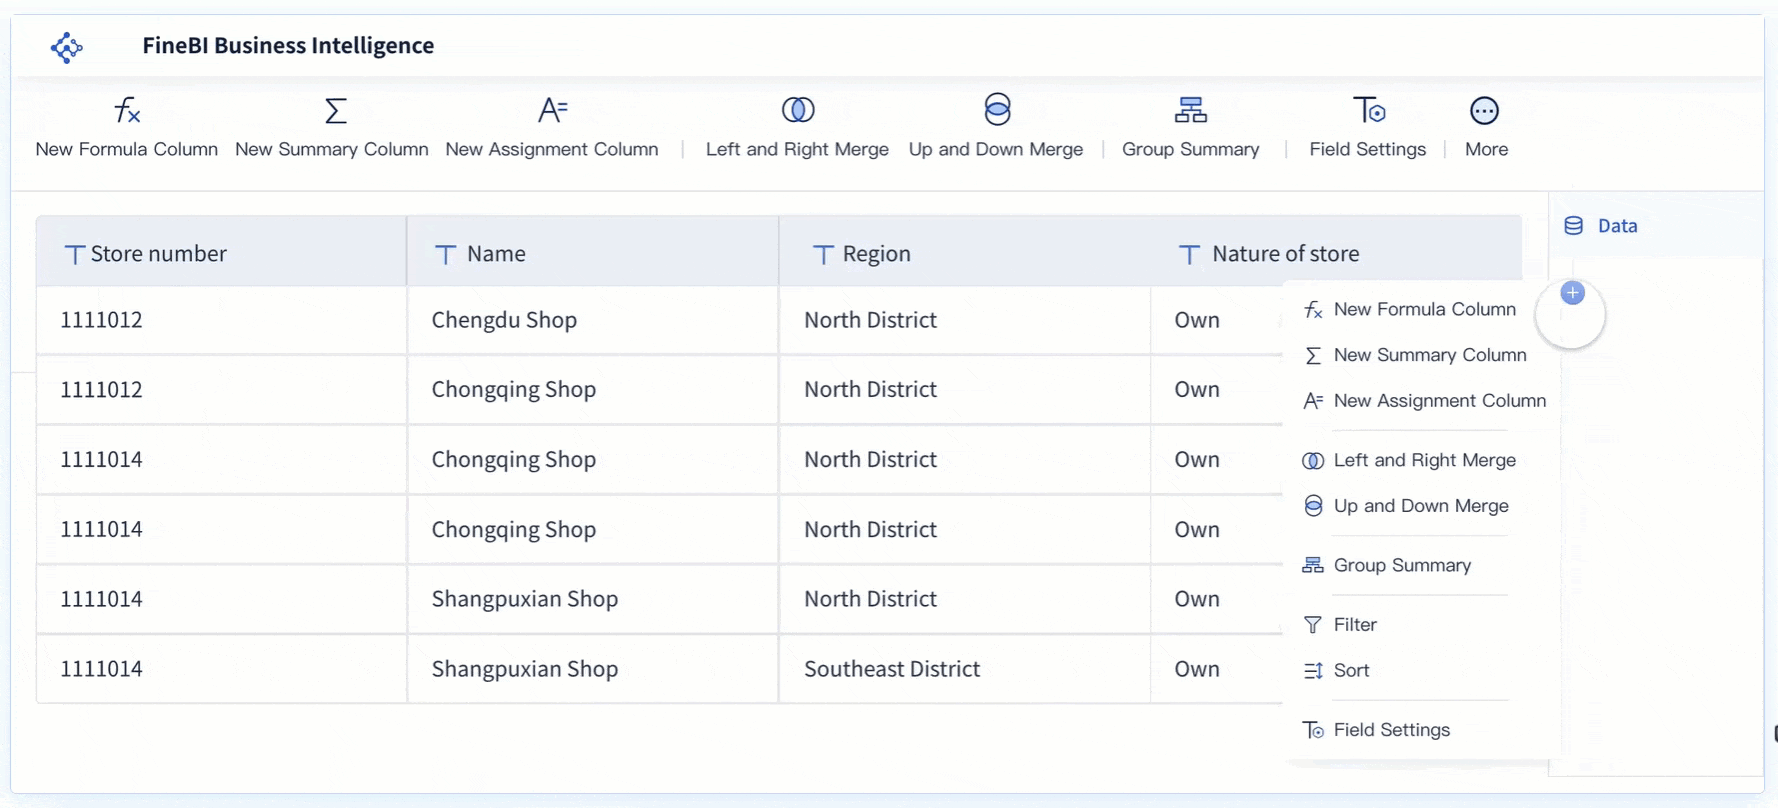
FineBI stands out as a powerful solution for building a marketing performance dashboard. You can integrate data from databases, spreadsheets, and cloud platforms, giving you a complete view of your marketing activities. FineBI’s self-service tools let you process and clean data without technical skills. You can add new columns, group users, and filter data to focus on the metrics that matter most.
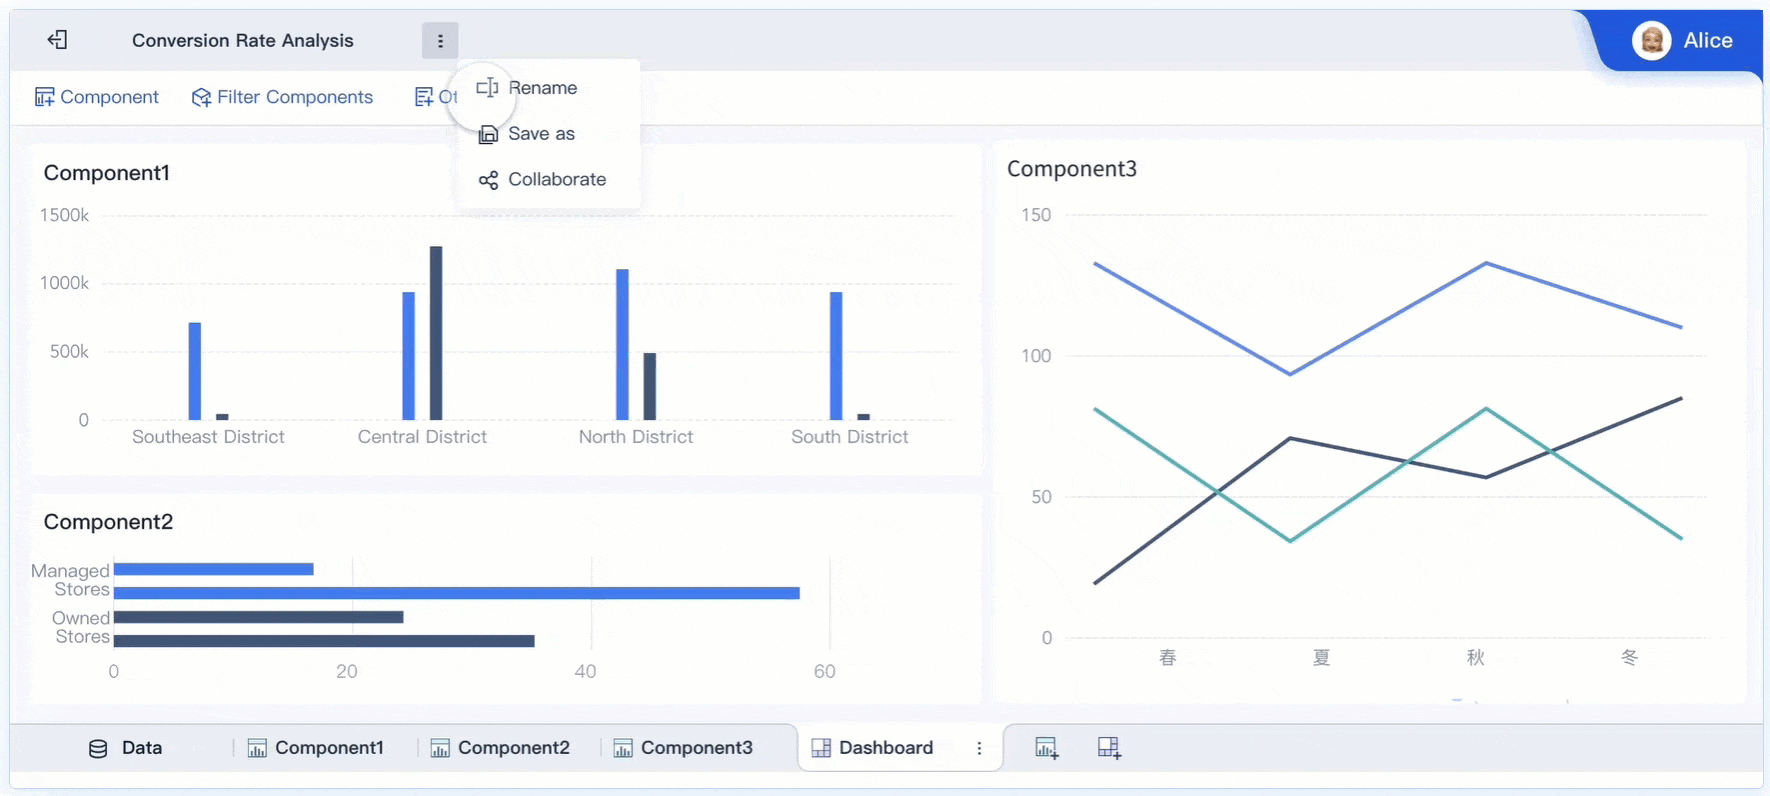
With FineBI, you create interactive dashboards to monitor key metrics like user engagement and retention rates. You can build line charts to track trends, use cohort heatmaps to compare user groups, and design funnel charts to see where users drop off. FineBI also supports collaboration by allowing you to control data visibility, set expiration dates for shared dashboards, and manage permissions. Security features ensure that only authorized users can access sensitive data. These capabilities make FineBI an excellent choice for teams that want to make data-driven decisions with their marketing dashboard.
Who Uses Digital Marketing Dashboard
Teams and Roles
You will find that many teams and roles rely on a marketing dashboard to guide their daily work and long-term planning. Each group uses the dashboard to meet specific needs and objectives. The table below shows how different teams and roles use dashboards and what they aim to achieve:
| Team/Role | Dashboard Type | Primary Objectives |
|---|---|---|
| Operational Teams | Status Dashboards | Monitor activities, track metrics, address anomalies |
| Marketing Departments | Area-specific Dashboards | Focus on specific marketing activities, filter metrics |
| Leadership Roles | Role-specific Dashboards | High-level insights, strategic decision-making |
| Content Marketing Teams | Performance Analysis Dashboards | Track long-term KPIs, evaluate impact over time |
You, as a marketer, often use a marketing dashboard to track ROI and optimize campaigns. Analysts depend on dashboards for in-depth data analysis and reporting. Executives look for high-level performance metrics and strategic insights. Here is a summary of how each role uses a dashboard:
- Marketers track ROI, monitor performance metrics, and adjust campaigns.
- Analysts analyze data, create detailed reports, and study trends.
- Executives review high-level metrics and make strategic decisions.
A digital marketing dashboard helps each team focus on the metrics that matter most to them. You can see real-time data, compare results, and make data-driven decisions that improve your marketing outcomes.
Industry Solutions
Many industries benefit from using a marketing dashboard, but retail stands out as a strong example. In retail, you need to manage large amounts of customer data and track many marketing activities. FineBI’s retail membership management solution shows how a digital marketing dashboard can transform your approach.
With FineBI, you can segment customers, analyze purchase behavior, and personalize marketing efforts. The dashboard lets you visualize key metrics like repurchase rates and customer activity. You can quickly identify which promotions work best and which customer groups respond to specific offers. This approach helps you optimize campaigns and increase customer loyalty.
A digital marketing dashboard in retail gives you a clear view of your data. You can monitor sales, track engagement, and adjust your strategy based on real-time insights. This level of visibility supports better decision-making and drives business growth.
Implementing a Digital Marketing Dashboard
Getting Started
You can build a digital marketing dashboard by following a clear process. Start by identifying the key performance indicators (KPIs) that align with your marketing goals. Focus on metrics that truly matter, such as conversion rates and customer acquisition cost. Avoid vanity metrics that do not impact your business decisions. Next, use marketing mix modeling to analyze how different channels affect your sales. Multi-touch attribution helps you understand which campaigns drive conversions. Effective visualization is essential, so choose tools that present your data in a clear and engaging way. Address any data silos early to ensure you get a complete view of your marketing activities.
Steps to build and deploy a digital marketing dashboard:
- Define your business objectives and select relevant KPIs.
- Integrate all marketing data sources to eliminate blind spots.
- Choose visualization tools that make your data easy to understand.
- Set up real-time data updates for timely insights.
- Test your dashboard with users and refine it based on feedback.
Best Practices
To ensure your marketing analytics dashboard delivers long-term value, you should follow several best practices. Prioritize KPIs that reflect both short-term and long-term growth. Exclude metrics that do not influence profitability or decision-making. Organize your dashboard by separating visualizations and KPI trackers into different pages to reduce clutter. Add interactive elements to help users explore the data. Automate data collection to keep your dashboard accurate and up to date. Use consistent color schemes and optimize white space for clarity.
Tip: Simplify your dashboard by reducing unnecessary text and focusing on the most important metrics.
Using FineBI
FineBI makes it easy for you to create and manage a digital marketing dashboard. You can connect to multiple data sources, including databases, spreadsheets, and APIs, for a comprehensive analysis. FineBI allows you to manipulate data without writing SQL, making it accessible for all team members. The platform offers over 50 built-in charts and intuitive filtering options, so you can visualize your metrics in many ways. You can also collaborate with your team by editing dashboards together and customizing data stories for different audiences. FineBI supports interactive components, advanced chart interactions, and OLAP functions, giving you deep insights into your marketing performance. Publishing and sharing dashboards is simple, and you can tailor each dashboard to specific business needs.
A digital marketing dashboard helps you drive business growth by turning complex data into actionable insights. You gain real-time tracking, efficiency, and autonomy that traditional reports cannot match.
| Feature/Benefit | Digital Marketing Dashboards | Traditional Marketing Reports |
|---|---|---|
| Data Tracking | Real-time | Historical |
| Efficiency | High | Moderate |
| Insights | Immediate | Delayed |
To get started, integrate your dashboard with all marketing channels, encourage collaboration, and provide training for your team. This approach ensures you maximize the value of your data and support continuous improvement.
Continue Reading About Digital Marketing Dashboard
What is a Dashboard and How Does It Work
Store Performance Dashboard: Your Retail Command Center
How to Craft an Effective Analytics Dashboard
What is a Digital Dashboard and How Does It Work
What is a KPI Dashboard and Why Your Business Needs One


FAQ

The Author
Lewis
Senior Data Analyst at FanRuan
Related Articles

How to Build an Investment Portfolio Reporting Dashboard for Executives: KPIs, Benchmarks, and Drill-Down Views
Investment portfolio reporting for executives is not about showing every holding, transaction, and chart your investment team can produce. It is about giving CEOs, CFOs, CIOs, boards, and investment committees a fast, re
Yida YIn
Jun 25, 2026

12 KPI Reporting Examples for Executive Dashboards: What to Show in Weekly, Monthly, and Quarterly Reviews
Executive leaders do not need more data. They need decision ready $1 examples that match how often they review the business and what actions they are expected to take. A weekly $1 should surface fast moving risks and per
Yida YIn
Jun 25, 2026

How to Build a Digital Marketing Reports Dashboard: Executive Examples, KPIs, and Templates
A $1 is the control layer that helps executives and marketing leaders turn scattered channel data into fast, confident decisions. If you are a CEO, CMO, operations director, or marketing analytics lead, the real problem
Yida Yin
May 07, 2026