A KPI dashboard is a tool that helps you track and visualize key performance indicators in one centralized platform. It provides a clear snapshot of your business's health by presenting data in an easy-to-understand format. With these dashboards, you can monitor performance metrics, identify trends, and make informed decisions in Malaysia. By aligning your strategies with measurable goals, you ensure that every action contributes to the success of your business.
Every dashboard here was built with FineBI—your gateway to smarter, faster analytics. Start your free trial and see what self-service BI can do for you.
A KPI dashboardis a tool that helps you track and visualize key performance indicators (KPIs) in one place. It simplifies complex data by presenting it in a clear, visual format, making it easier for you to understand and act on. These dashboards provide a snapshot of your business's health, allowing you to monitor progress toward goals and identify areas for improvement.
KPI dashboards serve multiple purposes. They help you assess the success of campaigns, focus on immediate issues, and align your team with strategic objectives. For example:
They provide a quick overview of essential information, helping you evaluate performance.
They allow you to address problems or priorities without delay.
They motivate employees by clearly showing progress toward specific goals.
They enhance transparency by communicating objectives and tracking progress.
By using a KPI dashboard, you can ensure that your business in Malaysia stays on track and remains competitive.
How a KPI Dashboard Works
KPI dashboards operate by collecting data from various sources and presenting it in a centralized, visual format. This process involves real-time data integration, which ensures that the information you see is always up-to-date. The dashboard's design focuses on consistency, making it easy for you and your team in Malaysia to interpret the data quickly.
For example, a KPI dashboard might display metrics like sales figures, customer satisfaction scores, or website traffic. These metrics are often categorized as lagging indicators (past performance) or leading indicators (future predictions). By analyzing these, you can identify trends, detect problems early, and make informed decisions in Malaysia.
Key Benefits of Using a KPI Dashboard
Real-Time Monitoring and Insights
A KPI dashboard provides you withreal-time monitoring capabilities, ensuring you stay updated on your business's performance at all times. By integrating data from multiple sources, these dashboards offer a centralized view of your key performance indicators in Malaysia. This allows you to track changes as they happen, enabling quick responses to emerging trends or issues.
Real-time dashboards have proven their value in various scenarios. For instance, during the COVID-19 pandemic, they were used to monitor the impact on industries and economies. Similarly, operational dashboards effectively tracked disruptions in the real estate market. These examples highlight how real-time monitoring can provide actionable insights during critical events.
With a KPI dashboard, you can visualize performance metrics like sales figures, customer satisfaction scores, or website traffic in real time. This immediate access to data empowers you to make timely adjustments, ensuring your business in Malaysia remains agile and competitive. Whether you're managing a sales KPI dashboard or an operational KPI dashboard, real-time insights are essential for maintaining efficiency and achieving your goals.
Data-Driven Decision-Making
KPI dashboards simplify complex data, presenting it in clear graphs and charts. This visual clarity helps you identify patterns and trends quickly, making it easier to base your decisions on accurate information. By focusing on key performance indicators, you can align your strategies with measurable objectives, ensuring every decision contributes to your business's success in Malaysia.
For example, a financial services firm might use an executive KPI dashboard to track metrics like revenue growth and customer retention. By analyzing trends over time, executives can make informed decisions about investments and budget adjustments. This approach ensures that your decisions are not just reactive but also strategic, driving long-term growth in Malaysia.
KPI dashboards play a crucial role in improving operational efficiency. By centralizing data and highlighting inefficiencies, they enable you to target specific areas for improvement. These dashboards also align your team with business objectives in Malaysia, ensuring everyone focuses on what matters most.
Dashboards simplify performance tracking by consolidating data into one platform. This reduces the time spent on manual data analysis and allows you to focus on optimizing operations. For instance, a centralized dashboard can reveal bottlenecks in your processes, helping you address them promptly.
Additionally, KPI dashboards provide real-time access to critical performance metrics, ensuring you can monitor progress and make adjustments as needed. With tools like FineBIandFineReport, you can create impactful KPI dashboards tailored to your organization's needs. These tools offer advanced data visualizations, making it easier to interpret data and drive operational improvements.
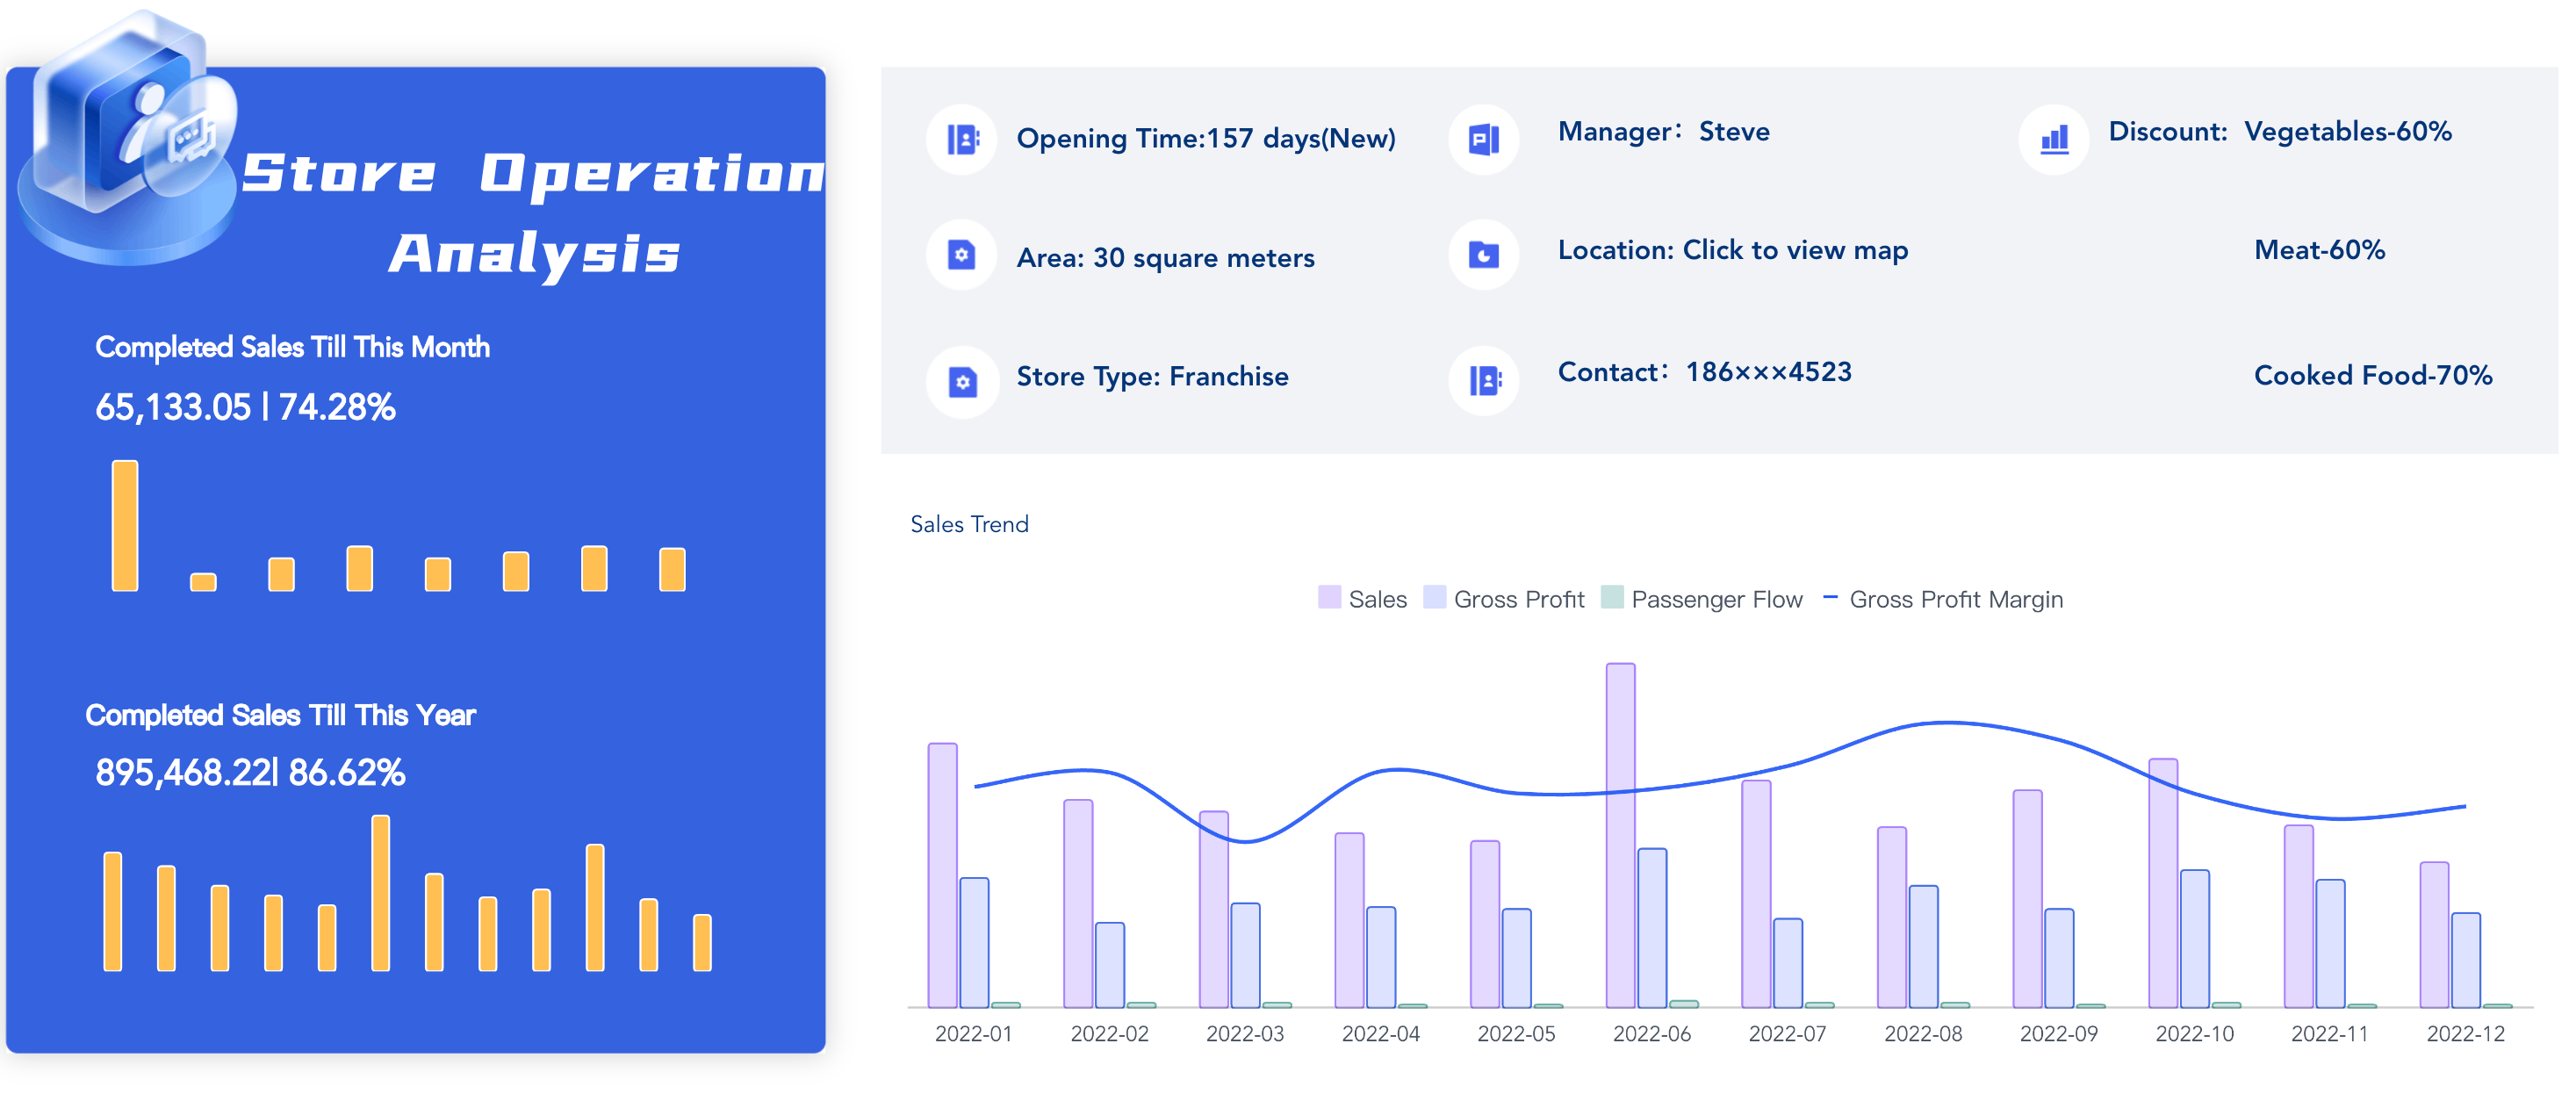
Store operation dashboard created by FineBI (click to engage)
By leveraging the power of KPI dashboards, you can streamline your operations, reduce inefficiencies, and achieve your business goals in Malaysia more effectively.
Asales KPI dashboardhelps you monitor and improve your sales performance by providing real-time insights into critical metrics. These dashboards simplify sales data, enabling you to track trends, identify opportunities, and make data-driven decisions. For example, you can monitor metrics like revenue growth, lead conversion rates, and sales targets.
Tip: Customizing your sales KPI dashboard ensures it aligns with your business goals in Malaysia and focuses on the most relevant KPIs.
Benefit
Description
Real-time insights
Provides updates on important metrics for quick responses and strategic adjustments.
Improved decision-making
Helps identify trends and opportunities, leading to data-driven decisions.
Enhanced collaboration
Facilitates sharing and transparency across teams, improving teamwork and communication.
A marketing KPI dashboard enables you to measure the effectiveness of your campaigns and optimize your marketing efforts in Malaysia. These dashboards provide a clear view of metrics like conversion rates, lead generation, and customer churn. By analyzing these KPIs, you can refine your strategies and maximize your return on investment (ROI).
Indicates the success of a website in convincing visitors to complete desired actions.
Lead Conversion Rate
Measures the percentage of leads that convert into customers, reflecting the effectiveness of lead generation.
Customer Churn Rate
Reflects customer satisfaction and perceived value by measuring the percentage of customers who stop using a service.
Return on Investment (ROI)
Assesses the profitability of marketing investments, indicating whether marketing efforts generate more revenue than costs.
Financial KPI Dashboard
A financial KPI dashboard provides a comprehensive view of your organization’s financial health. It allows you to track key indicators like revenue growth, gross profit margin, and debt-to-equity ratio. These dashboards enable you to make informed decisions that enhance profitability and ensure long-term stability.
Measures the percentage of revenue exceeding the cost of goods sold.
EBITDA Margin
Reflects earnings before interest, taxes, depreciation, and amortization as a percentage of revenue.
Current Ratio
Assesses the company's ability to pay short-term obligations.
Debt to Asset Ratio
Evaluates the proportion of a company's assets that are financed by debt.
Debt to Equity Ratio
Compares total liabilities to shareholders' equity.
With a financial KPI dashboard, you can monitor trends, optimize resource allocation, and ensure your business in Malaysia remains financially sound. Here is an interactive demo of the Financial KPI Dashboard created by FineBI. Click to experience it!
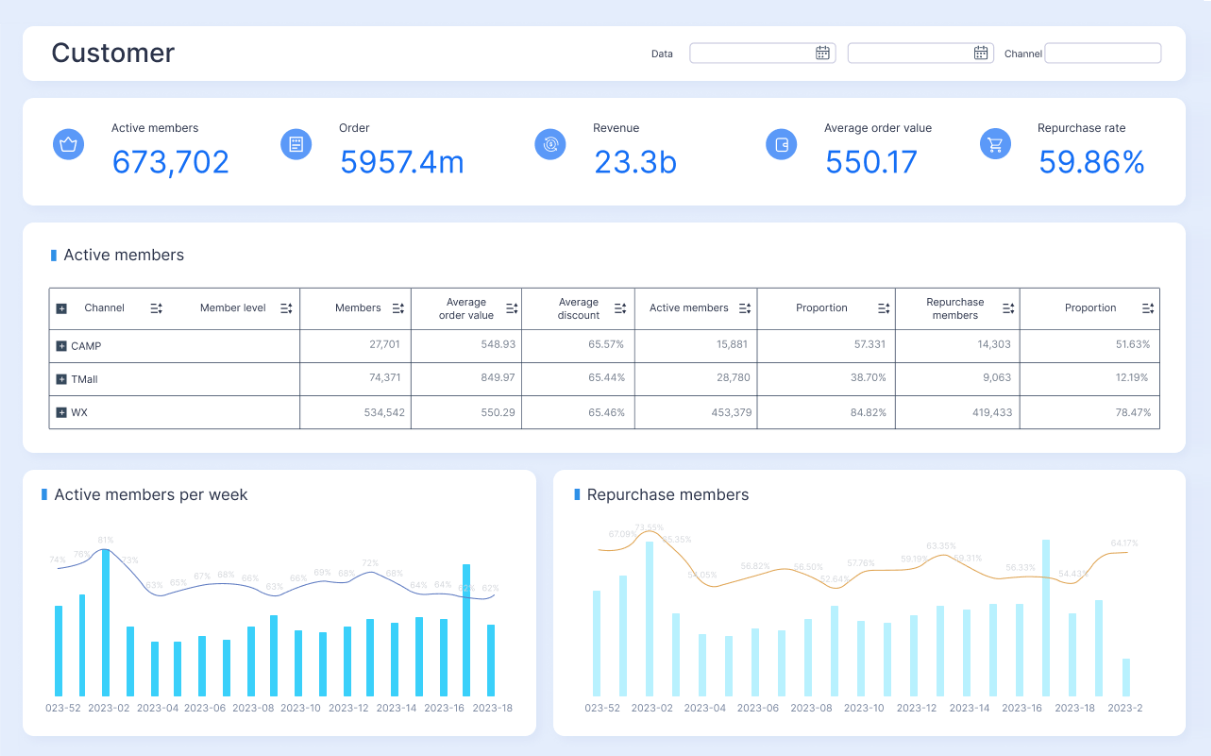
Customer Service KPI Dashboard
A customer service KPI dashboard helps you monitor and improve the quality of your customer interactions in Malaysia. By tracking key metrics, you can identify areas for improvement and ensure your team delivers exceptional service. These dashboards provide real-time insights into customer satisfaction, enabling you to make informed decisions that enhance the overall experience. Key metricscommonly tracked in a customer service KPI dashboard include:
Metric
Description
Resolution Time
Measures how quickly customer issues are resolved, impacting customer satisfaction and loyalty.
Customer Satisfaction Score
Assesses customer satisfaction with specific interactions, providing insights into service quality.
Net Promoter Score
Evaluates customer loyalty and likelihood to recommend, indicating overall satisfaction and advocacy.
Customer Effort Score
Gauges the ease of customer interactions, affecting their overall experience and satisfaction levels.
For example, tracking resolution time allows you to identify bottlenecks in your support process. A shorter resolution time often leads to higher customer satisfaction. Similarly, monitoring the Net Promoter Score helps you understand how likely customers are to recommend your business in Malaysia, which reflects their overall experience. By leveraging these insights, you can refine your strategies and build stronger customer relationships. Here is an interactive demo of the Customer Service KPI Dashboard. Click to experience the magic!
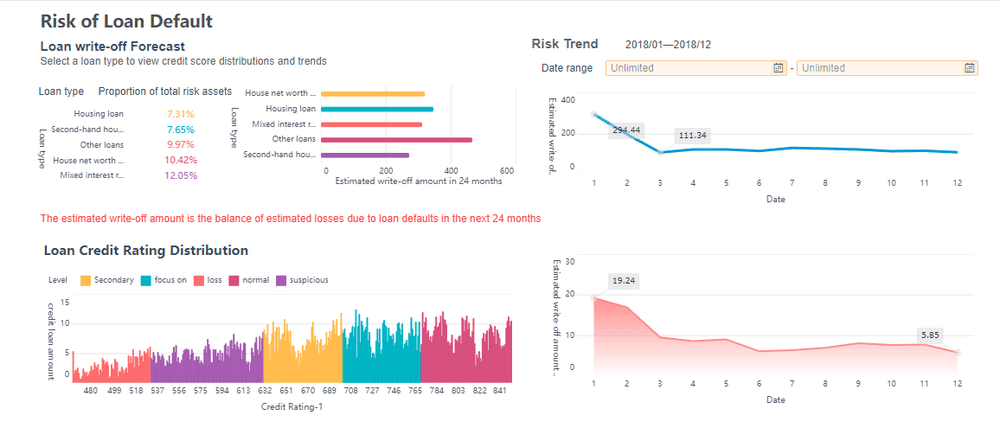
A banking KPI dashboard provides a comprehensive view of a bank’s financial health and operational efficiency. It enables you to track critical metrics, ensuring your institution remains competitive and profitable. These dashboards simplify complex financial data, making it easier to identify trends and make data-driven decisions. Common KPIs tracked in a banking dashboard include:
KPI
Description
Net Interest Margin (NIM)
Measures the difference between the interest income generated and the amount of interest paid out to lenders.
Loan-to-Deposit Ratio
Indicates a bank's liquidity by comparing its total loans to its total deposits.
Non-Performing Loan (NPL) Ratio
Tracks the percentage of loans that are in default or close to being in default.
Cost-to-Income Ratio
Measures the bank’s efficiency by comparing its operating costs to its operating income.
Return on Assets (ROA)
Indicates how profitable a bank is relative to its total assets.
For instance, monitoring the Loan-to-Deposit Ratio helps you assess liquidity and ensure your bank can meet withdrawal demands. Similarly, tracking the Cost-to-Income Ratio highlights operational efficiency, allowing you to identify areas where costs can be reduced. By using a banking KPI dashboard, you can maintain financial stability and improve overall performance.
Project KPI Dashboard
A project KPI dashboard helps you track the progress and success of your projects in Malaysia. It provides a centralized view of key metrics, ensuring your team stays aligned with project goals. These dashboards enable you to monitor timelines, budgets, and resource allocation, helping you deliver projects on time and within scope. Key metrics in a project KPI dashboard often include:
Project Completion Rate: Tracks the percentage of tasks completed, indicating overall progress.
Budget Variance: Measures the difference between planned and actual spending, ensuring financial control.
Resource Utilization: Monitors how effectively resources are being used, helping you optimize allocation.
Task Overdue Rate: Highlights tasks that are behind schedule, enabling timely interventions.
For example, tracking budget variance allows you to identify overspending early and adjust your plans accordingly. Monitoring resource utilization ensures that team members are neither overburdened nor underutilized. By leveraging a project KPI dashboard, you can enhance project management and achieve better outcomes.
Tip: Regularly update your project dashboard to reflect the latest data. This ensures you always have an accurate view of your project’s status.
Below is an interactive demo of FineBI's Project KPI Dashboard. Click to explore and experience the dynamic options firsthand.
FanRuan has established a localized team in Malaysia to provide comprehensive project implementation and technical support services. This local presence ensures faster response times, better alignment with regional business needs, and smoother deployment of products like FineReport and FineBI. Clients in Malaysia benefit from personalized assistance throughout the project lifecycle, from initial setup to post-deployment optimization.
How to Implement a KPI Dashboard Effectively
Choosing the Right Tools
Selecting the right tools is essential for creating impactful KPI dashboards. Tools likeFineBIoffer advanced features that simplifydata visualization and analysis, making them ideal for businesses in Malaysia aiming to track performance effectively. These tools provide user-friendly interfaces, enabling you to design dashboards tailored to your organization's needs without requiring extensive technical expertise.
FineBI excels in self-serviceanalytics, empowering employees to independently explore data and modify dashboards. For example, Macao Water transitioned from Excel to FineBI, allowing employees to make 88 modifications to dashboards over three years. This demonstrates how FineBI fosters active engagement and enhances operational efficiency.
Tip: Evaluate your organization's specific requirements before selecting tools. Consider factors like ease of use, scalability, and integration capabilities to ensure the tools meet your needs.
Ensuring Data Accuracy and Integration with FanRuan Solutions
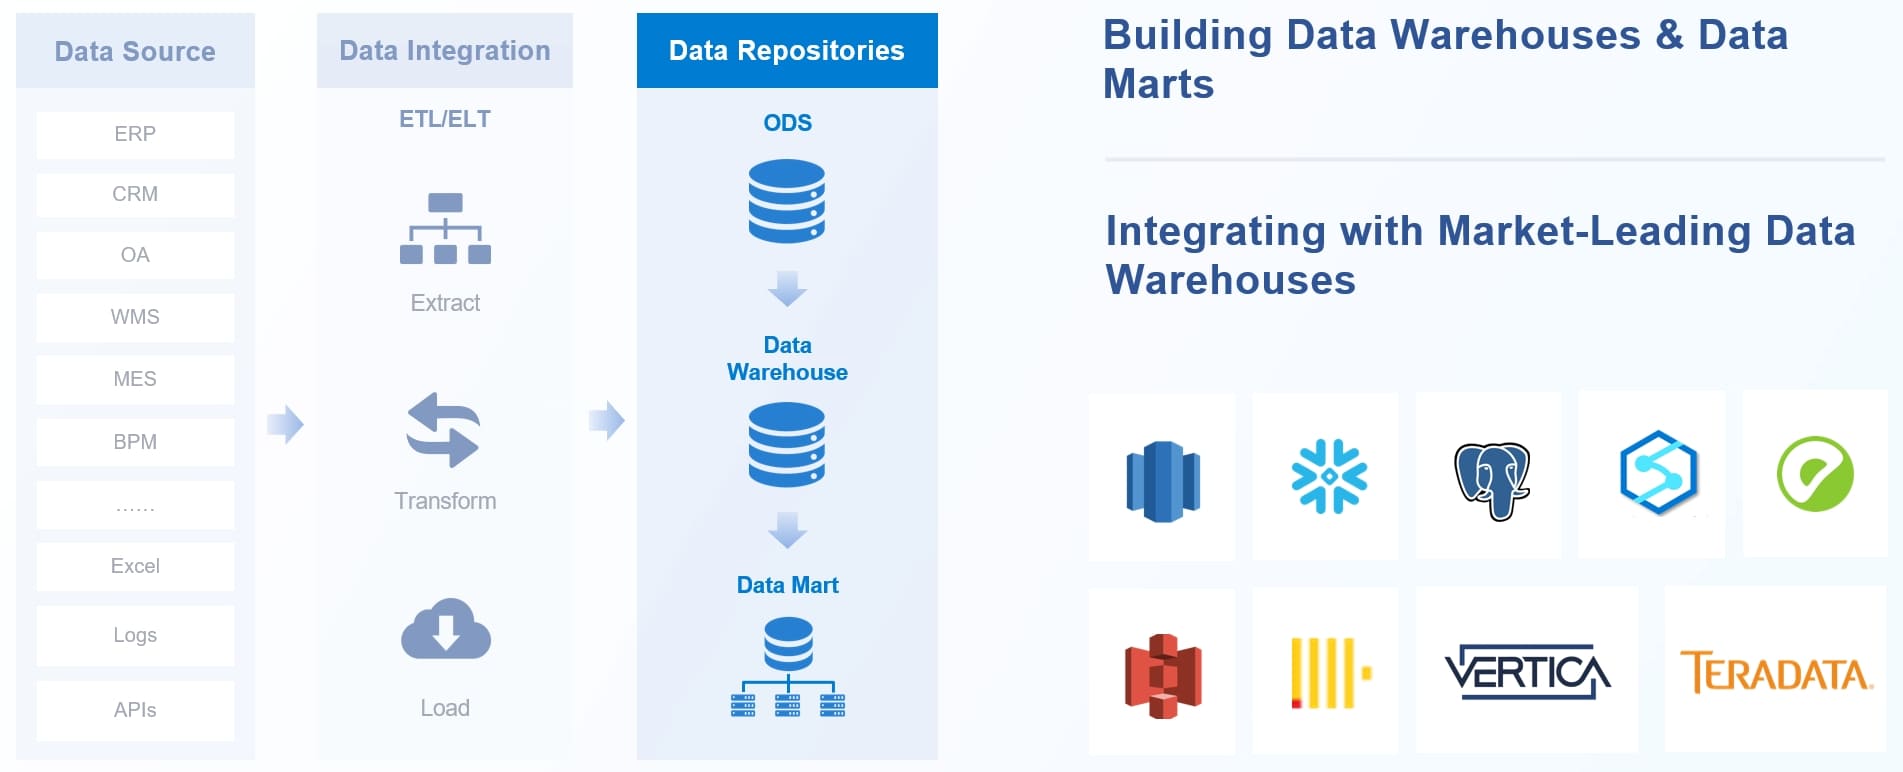
Accurate data is the backbone of effective KPI dashboards. Without reliable data, your dashboards may lead to misguided decisions. FanRuan Solutions, including FineDataLink, play a crucial role in ensuring data accuracy and seamless integration across multiple sources. FineDataLink addresses common challenges like data silos and complex formats, enabling real-time synchronization and transformation of data.
To maintain data accuracy, focus on the following steps:
Centralize Data Sources: Use tools like FineDataLink to integrate data from various systems into a unified platform.
Automate Data Processes: Reduce manual errors by automating data extraction, transformation, and loading (ETL) workflows.
Validate Data Regularly: Implement checks to ensure data consistency and reliability across dashboards.
For example, FineDataLink supports over 100 data sources and provides APIs for seamless integration, making it easier to build a high-quality data layer for business intelligence. By ensuring data accuracy, you can trust the insights generated by your dashboards and make informed decisions that drive performance improvements.
Note: Real-time data integration enhances the responsiveness of your dashboards, allowing you to adapt quickly to changing business conditions in Malaysia.
KPI dashboards are essential tools for driving business success in Malaysia. They provide real-time insights,improve decision-making, and streamline performance tracking. By visualizing key metrics, you can identify trends, address issues promptly, and align your strategies with measurable goals. Businesses in Malaysia that adopt advanced analytics and tools like FineBI often see significant improvements. For instance, McKinsey & Company reports that leveraging analytics can enhance operational efficiency by up to 20%, while decision-making speeds increase by 64%.
Adopting tools like FineBI empowers you to create impactful dashboards tailored to your needs. These tools simplify data visualization, ensuring you stay competitive and focused on achieving your business objectives in Malaysia. Start leveraging KPI dashboards today to unlock your organization’s full potential.
Click the banner below to experience FineBI for free and empower your enterprise to convert data into productivity!
Smarter product, pricing, and inventory management across retail sectors.
FAQ
What is the difference between a KPI and a metric?
A KPI measures progress toward a specific goal, while a metric tracks general data. For example, monthly sales growth is a KPI tied to a target, but total website visits is a metric that provides broader insights.
How often should you update your KPI dashboard?
You should update your KPI dashboard in real time or at least daily. Frequent updates ensure you monitor the latest data, identify trends, and make timely decisions. Tools like FineBI and FineReport support real-time updates for accurate insights.
Can small businesses benefit from KPI dashboards?
Absolutely! KPI dashboards help small businesses track performance, identify growth opportunities, and optimize operations. They simplify data analysis, making it easier for you to focus on achieving your goals without needing a large team or complex systems.
What are the most important KPIs to track?
The most important KPIs depend on your business goals. Common examples include revenue growth, customer satisfaction, and operational efficiency. Choose KPIs that align with your objectives and provide actionable insights for improvement.
How do FineBI and FineReport enhance KPI dashboards?
FineBI and FineReport simplify dashboard creation with user-friendly interfaces and advanced visualization tools. FineBI supports self-service analytics, while FineReport excels in pixel-perfect reporting. Together, they provide real-time insights and customizable dashboards tailored to your business needs.