You want to find the best marketing dashboard tools for agencies because these platforms help you manage client data, track performance, and deliver clear results. When you use marketing dashboard tools for agencies, you get a single place to view all your marketing activity. These tools let you save time on manual reporting and give you real-time insights so you can make smarter decisions fast.
Recent studies show dashboards build client trust, unify fragmented data, and offer scalable reporting. You can customize reports for each client and keep your team focused on strategy, not spreadsheets. Look for tools with strong reporting, easy integration, flexible scaling, simple controls, fair pricing, and solid client management.
Why Agencies Need Marketing Dashboard Tools

Data-Driven Decision Making
You want your agency to make smarter choices. Marketing dashboard tools help you do that by putting all your important data in one place. With a marketing analytics dashboard, you can track key metrics like campaign performance, website traffic, and conversion rates without jumping between different platforms. This means you see the big picture and spot trends as they happen.
When you use a marketing analytics dashboard, you get real-time analytics. You can watch your performance metrics update instantly. This helps you react quickly if something changes in your marketing campaigns. For example, if you notice a drop in engagement, you can adjust your strategy right away. These dashboards also let you segment your audience and analyze customer behavior over time. You can see which campaigns work best for different groups. Tools like Tableau and Power BI make it easy to bring all your data together for a complete view. You save time on reporting and focus more on strategy.
Here’s why agencies rely on dashboard reporting tools for data-driven decisions:
- Gather all your KPIs in one spot for easy tracking.
- Measure campaign success and monitor trends.
- Eliminate the need to check multiple reports.
- Integrate with different platforms for a full analysis.
- Visualize metrics for quick insights.
Common Challenges Without Dashboards
If you try to manage marketing without a dashboard, you run into a lot of problems. Teams often create their own reports, which leads to inconsistent metrics and confusion. You might spend hours pulling data from different sources, only to find errors or missing information. It becomes hard to connect your marketing performance to real business outcomes.
Here’s a look at the most common challenges agencies face without marketing dashboard tools:
| Challenge | Description |
|---|---|
| Data consistency | Different team members create their own reports, leading to inconsistent metrics. |
| Actionable insights | Teams struggle to deliver insights when focused on assembling reports instead of strategy. |
| Connecting metrics to business impact | It’s tough to link marketing performance to actual business results because of data silos. |
| Dashboard proliferation | Multiple reports may tell conflicting stories about the same marketing performance. |
| Need for analytical context | Traditional reporting often lacks the context needed for smart decision-making. |
Without a marketing analytics dashboard, you risk wasting time, missing key insights, and making decisions based on incomplete information. A strong dashboard brings clarity, consistency, and better results for your agency and your clients.

Key Criteria for Marketing Dashboard Tools
When you start looking for a marketing analytics dashboard, you want to make sure it fits your agency’s needs. The right dashboard helps you track marketing performance, manage reporting, and deliver clear insights to your clients. Let’s break down the most important criteria you should consider.
Essential Features for Agencies
You need a dashboard that gives you control over your marketing analytics. Agencies often juggle multiple clients, so it’s important to have tools that let you customize reporting and visualization for each account. The best marketing analytics dashboard will help you track metrics, analyze data, and share insights quickly.
Here’s a table showing the essential features you should look for:
| Essential Feature | Description |
|---|---|
| Data Sources | Connect to advertising platforms, analytics tools, CRM systems, and more. |
| Metrics | Track impressions, clicks, conversions, and revenue for foundational insights. |
| Key Performance Indicators | Tie metrics directly to business goals for context and clarity. |
| Visualizations | Use charts, graphs, and tables to spot patterns and trends fast. |
You should also define one clear purpose for each dashboard. This helps you cater to specific roles, like executives or campaign managers, and keeps your reporting focused.
Integration and Scalability
Integration is key when you work with different marketing platforms. Your dashboard should connect with major ad platforms, SEO tools, email services, and CRMs. This makes it easy to pull in data and create unified analytics reports.
Scalability matters as your agency grows. Some dashboard reporting tools, like Looker BI, work well for complex data environments and large teams. Others, like Looker Studio, are perfect for quick dashboard creation and smaller teams. Usermaven stands out for seamless integration with ad platforms and CRMs, plus automated reporting for KPIs.
Here’s a quick look at how integration and scalability compare:
| Tool | Integration Capabilities | Scalability Features |
|---|---|---|
| Looker BI | Connects with Google Cloud, BigQuery, Snowflake, and SQL databases. | Handles large-scale modeling and governance across departments. |
| Looker Studio | Integrates with Google Analytics, Google Ads, and other Google tools. | Quick dashboard creation for small teams. |
| Usermaven | Cross-channel integrations with ad platforms, SEO tools, CRMs, and email services. | Automated client reporting and visual dashboards for KPIs. |
You want a dashboard that natively connects with platforms like Google Ads, Meta Ads, Google Search Console, Ahrefs, Mailchimp, and HubSpot.
Pricing and Value
Pricing can vary a lot between marketing analytics dashboard tools. You want to find a dashboard that fits your budget but still delivers strong reporting and analytics. Some platforms, like Looker Studio, offer free options for small businesses. Others, like Tableau and Domo, come with higher costs but offer advanced features for larger agencies.
Here’s a table to help you compare pricing and target audiences:
| Platform | Pricing Range | Target Audience |
|---|---|---|
| Cometly | Contact for pricing | SaaS startups, e-commerce, agencies |
| HubSpot Marketing Hub | Mid to high pricing | SMBs to enterprises |
| Tableau | Higher cost | All business sizes |
| Looker Studio | Free | Small to medium businesses |
| Databox | Affordable tiers | SMBs and mid-market |
| Klipfolio | Affordable pricing | SMBs, agencies |
| DashThis | Mid-range pricing | Agencies, marketing teams |
| Cyfe | Affordable pricing | Small businesses, agencies |
| Domo | Higher pricing | Medium to large enterprises |
| Mixpanel | Mid to high pricing | Product teams, SaaS |
| Zoho Analytics | Affordable pricing | SMBs to enterprises |
| Power BI | Affordable pricing | MS ecosystem users, enterprises |
You should balance cost with the value you get from reporting, visualization, and analytics features. The best marketing analytics dashboard will help you deliver better insights and performance for your clients without breaking the bank.
Top 10 Marketing Dashboard Tools for Agencies
When you look for marketing dashboard tools, you want platforms that help you track, analyze, and present your marketing data in a way that makes sense for your agency and your clients. The right marketing analytics dashboard gives you a clear view of your campaigns, helps you spot trends, and lets you deliver real-time insights. Let’s break down the top options you should consider.
FineBI Marketing Analytics Dashboard

FineBI brings a fresh approach to marketing dashboard tools for agencies. You get a self-service marketing analytics dashboard that empowers you to explore data, create dashboards, and share insights without needing advanced technical skills. FineBI stands out for its data integration, real-time analysis, and enterprise-grade governance.
| Feature | Description |
|---|---|
| Self-Service Analytics | You can build dashboards and visualizations with drag-and-drop tools—no coding required. |
| Data Integration | FineBI connects to over 60 data sources, including big data platforms, databases, and APIs. |
| Real-Time Analysis | The real-time engine processes data instantly, so you always see up-to-date metrics. |
| Enterprise Governance | Role-based access, audit trails, and data security keep your client data safe and compliant. |
You can use FineBI to create dashboards for campaign tracking, sales performance dashboard needs, and executive reporting. The platform supports multi-dimensional analysis, so you can dig into marketing metrics from every angle. Teams can collaborate on dashboards, share real-time insights, and automate reporting for clients.

Best Use Cases:
FineBI fits agencies that want to empower business users, reduce IT bottlenecks, and scale analytics across departments. For example, BOE Technology Group used FineBI to unify fragmented data, standardize metrics, and boost operational efficiency by 50%. Agencies in industries like finance, manufacturing, and retail use FineBI to track KPIs, benchmark performance, and drive data-driven decisions.
Pricing:
FineBI offers flexible pricing based on user count and deployment needs. You can request a quote for your agency’s size.
Pros & Cons:
- Pros:
- Self-service analytics for all users
- Seamless data integration and real-time insights
- Enterprise-grade governance and security
- Scalable for agencies of any size
- Cons:
- Requires initial setup and onboarding
Google Data Studio
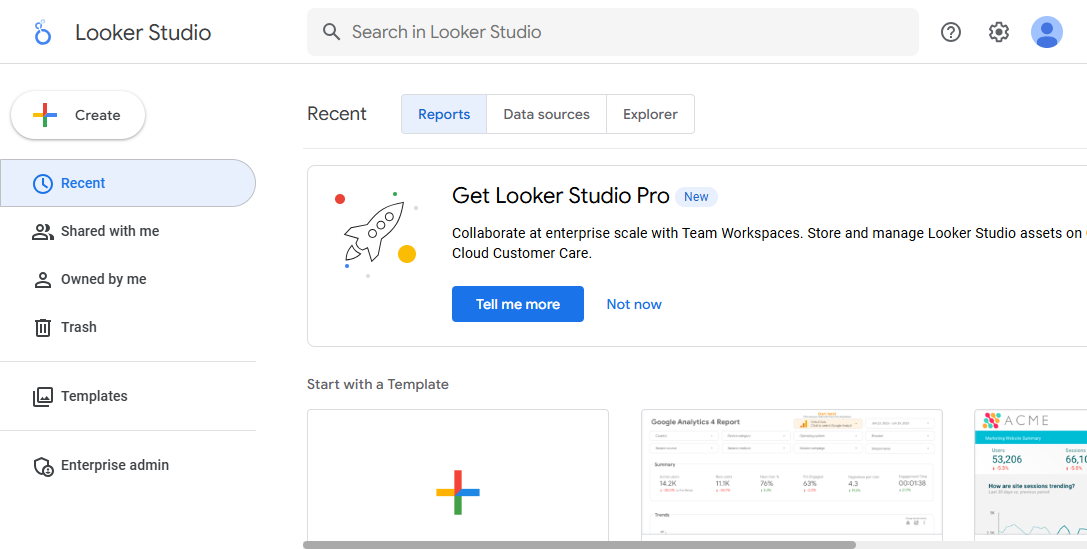
Google Data Studio stands out as a favorite for agencies that want a free, flexible, and powerful marketing analytics dashboard. You can connect it directly to Google Analytics, Google Ads, and other tools in the Google ecosystem. This makes it easy to pull in all your marketing data and visualize it in one place.
Key Features for Agencies:
- Free access for unlimited users.
- Real-time reporting with interactive dashboards.
- Unlimited widgets for comprehensive visualization.
- Seamless integration with Google products.
- Customizable reports with multi-page layouts.
| Key Feature | Description |
|---|---|
| Analyzing large volumes of data | Handles big datasets, ideal for agencies with many clients. |
| Monitoring performance metrics | Tracks KPIs in real time for quick adjustments. |
| Visualizing data | Turns raw data into clear visuals for better decision-making. |
| Integration with Google ecosystem | Connects easily with Google Analytics, Ads, and more. |
Best Use Cases:
You can use Google Data Studio to monitor campaign performance, create client-facing reports, and analyze large volumes of marketing data. It works well for agencies that need to visualize metrics across multiple channels.
Pricing:
Google Data Studio is free for basic use. The Pro version starts at $9 per user per month.
Pros & Cons:
| Pros | Cons |
|---|---|
| Free for most users | Can lag with very large datasets |
| Integrates with Google tools | Limited advanced features in the free version |
| Customizable and flexible | Steep learning curve for beginners |
Tableau

Tableau is a leader in the marketing analytics dashboard space. You get powerful data visualization and analytics tools that help you dig deep into your marketing metrics. Agencies love Tableau for its ability to handle large datasets and deliver real-time insights.
- Real-time monitoring lets you check campaign performance instantly.
- Robust data handling means you can manage big data without slowdowns.
- Mobile accessibility keeps you connected to your dashboards on the go.
- Actionable insights help you refine strategies and improve marketing performance.
Best Use Cases:
Tableau works well for agencies that need to analyze complex data, run repetitive analysis cycles, and deliver high-impact visualizations to clients.
Pricing:
- Creator License: $115/user/month
- Explorer License: $70/user/month
- Viewer License: $35/user/month
Pros & Cons:
- Pros:
- Powerful visualization and analytics
- Real-time analytics for fast decisions
- Comprehensive dashboard reporting tools
- Cons:
- High cost for small agencies
- Steep learning curve
- Some limitations with parameter functionality
Klipfolio
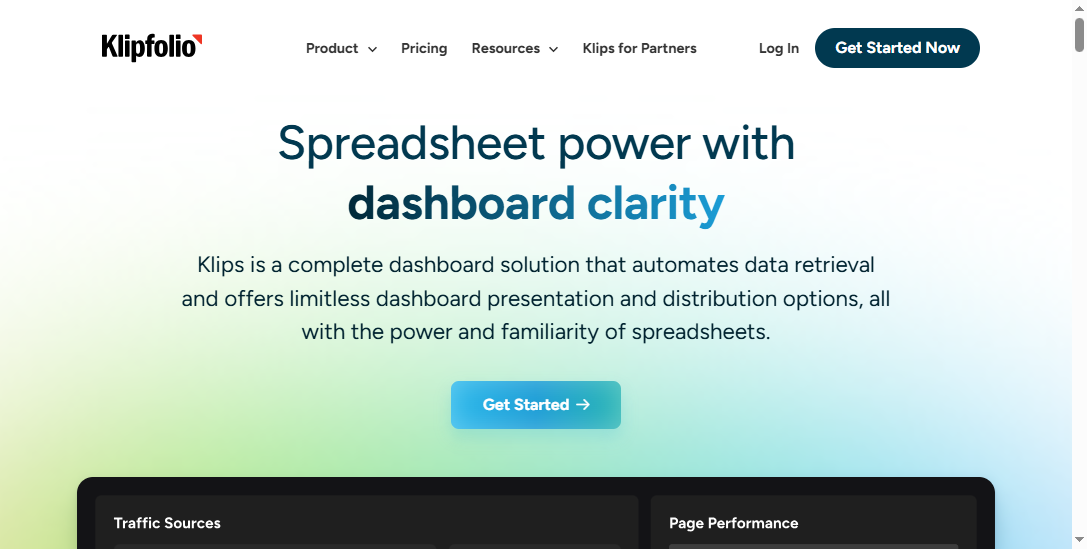
Klipfolio is a popular choice for agencies that want automated client reporting and easy dashboard management. You can combine metrics from different sources and visualize client results in real time.
| Feature | Description |
|---|---|
| Automated Client Reporting | Visualize client results in real time, so you focus on optimization. |
| Client Management | Manage all client dashboards from one account. |
| Customization | Personalize dashboards and automate tasks for branded experiences. |
| Sharing & Publishing | Share dashboards securely via links or emails. |
| White-labeling | Add your agency’s logo and custom domain for a seamless client experience. |
| Expert Support | Access support for onboarding and advanced automation. |
Best Use Cases:
Klipfolio works well for agencies that need to manage multiple clients, automate reporting, and deliver branded dashboards.
Pricing:
Klipfolio offers tiered pricing based on the number of dashboards and users.
Pros & Cons:
- Pros:
- Automated reporting saves time
- Strong client management features
- White-labeling for agency branding
- Cons:
- Advanced customization may require technical skills
- Can get expensive as you add more clients
Databox
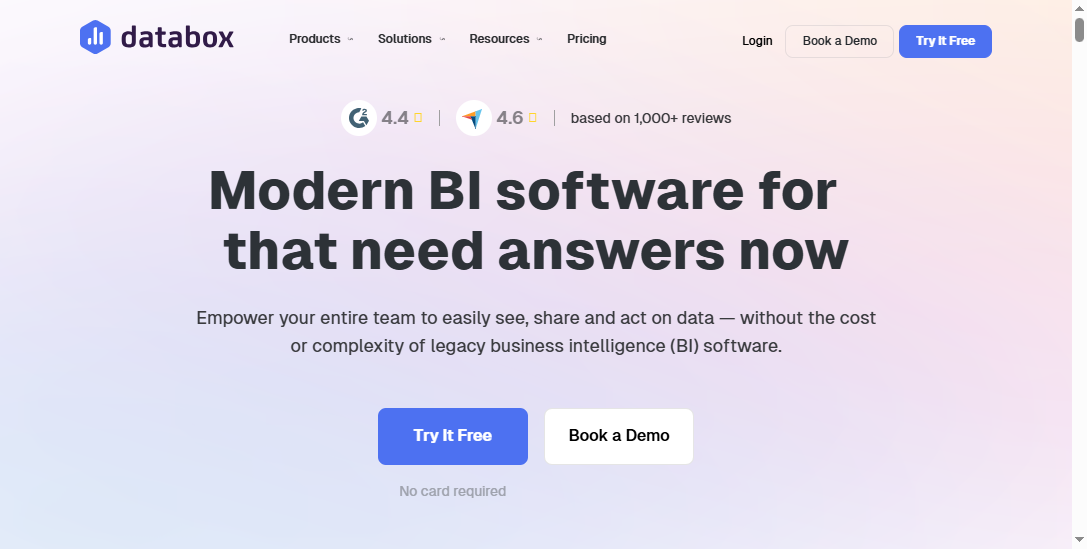
Databox helps you bring all your marketing data together in one place. You can build interactive dashboards, automate reporting, and create custom metrics without coding.
| Feature | Description |
|---|---|
| Data Integration | Connects to 130+ tools for comprehensive analytics. |
| Visualization | Interactive dashboards that are easy to understand. |
| Reporting | Automate performance updates and share with clients. |
| Custom Metrics | Build tailored metrics with the Metric Builder. |
| Benchmarking | Compare performance with similar companies in private groups. |
| Mobile and TV Dashboards | Display dashboards on phones and office TVs. |
You can clone dashboards for multiple clients, schedule performance snapshots, and analyze trends quickly.
Best Use Cases:
Databox is great for agencies that want to automate reporting, track marketing performance, and deliver insights to clients on any device.
Pricing:
Databox offers budget-friendly entry options with scalable plans.
| Pros of Databox | Cons of Databox |
|---|---|
| Many native integrations | Report generation can be slower than some competitors |
| No-code analytics and forecasting | Customization may need technical knowledge |
| Robust mobile access | Limited brandability for client reports |
| Affordable for small agencies | Learning curve for new users |
AgencyAnalytics
AgencyAnalytics is built specifically for agencies. You get comprehensive reporting, data visualization, and client management in one platform.
| Feature | Description |
|---|---|
| Comprehensive Reporting | Automates data retrieval and centralizes marketing metrics. |
| Data Visualization | Presents data clearly and professionally. |
| Client Management | Manage multiple clients and scale operations easily. |
| Integration | Supports 80+ integrations for cross-channel reporting. |
| Workflow Streamlining | Simplifies workflows and monitors real-time performance. |
| Professional Reporting | Delivers personalized reports to enhance client relationships. |
You can automate reporting, manage multiple clients, and provide clear insights into marketing performance.
Pricing:
AgencyAnalytics uses tiered pricing based on the number of clients.
| Feature | AgencyAnalytics | DashThis | Whatagraph |
|---|---|---|---|
| Pricing Structure | Tiered | Simple | Straightforward |
| Custom Dashboards | Unlimited | Limited | Customizable |
| Client Portals | Yes | No | Yes |
| API Access | Limited lower | Yes | Yes |
| Hidden Costs | Yes | No | No |
- Pros:
- Clean, client-friendly dashboards
- Pre-built integrations with major ad platforms
- Automated reporting on mid-tier plans and up
- Branded reports on every plan
- Cons:
- Per-client pricing can add up
- API access limited to higher plans
- Customization options are limited
DashThis
DashThis is a simple, easy-to-use marketing analytics dashboard tool. You can set it up quickly and create reports for small teams or freelancers.
| Feature | Description |
|---|---|
| Ease of Use | Quick setup for simple reports. |
| Integration Options | 29 integrations with platforms like Facebook, Instagram, and Google Ads. |
| Data Organization | Combine multiple metrics into one visual for easy comparison. |
| White-Labeling | Basic features for agency branding. |
| Limitations | Less control over layout and widgets as you scale. |
You can automate reporting, customize dashboards for your brand, and present data in a way that’s easy for clients to understand.
- Pros:
- Saves time with automated reporting
- Customization for agency branding
- Visual presentation makes data engaging
- Cons:
- Limited flexibility for large agencies
- Some issues with layout and data reliability
Power BI
Power BI is a strong choice for agencies that want advanced analytics and seamless integration with Microsoft tools. You can ask questions in plain English and get instant answers with the Q&A feature. Power BI supports advanced analytics, image recognition, and text analytics.
- Integrates with Excel for smooth data flow.
- Power BI Apps organize multiple reports for teams or campaigns.
- Real-time reporting lets you monitor campaigns and adjust strategies fast.
- Collaboration tools make sharing interactive dashboards easy.
You can define key metrics and KPIs, integrate with marketing intelligence platforms, and link data via API for live updates.
Pricing:
| Plan Type | Price | Features |
|---|---|---|
| Power BI Desktop | Free | Basic features for individual users. |
| Power BI Pro | $9.99/user/month | Collaborative features for teams. |
| Power BI Premium | $20/user/month or $4,995/month | Advanced analytics, on-premises reporting, more data capacity. |
- Pros:
- Free version for small businesses
- Advanced features for larger organizations
- Cons:
- Complexity and learning curve for advanced analytics
- Limited compatibility with non-Windows systems
Cyfe
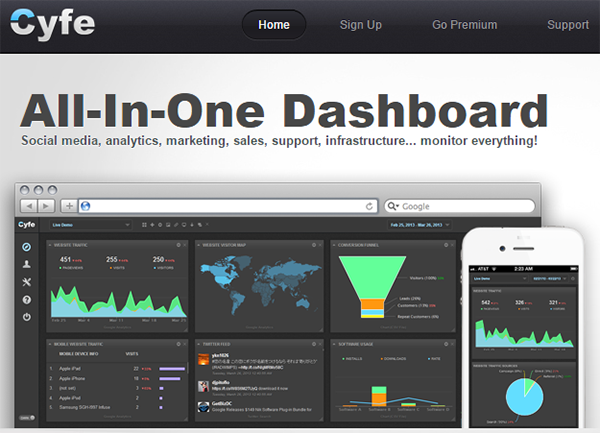
Cyfe helps you manage all your marketing data and KPIs in one place. You can track performance, financial health, and project status with different dashboards.
- Manage many data points and KPIs for marketing optimization.
- Use financial dashboards to understand agency growth.
- Integrate project management dashboards with tools like Basecamp.
Cyfe automates client reporting with weekly emails and lets you print reports with the PDF generator. It integrates with Facebook, Google, and other major platforms.
- Agencies use Cyfe to display metrics from Google Analytics and social media.
- Internal monitoring is simple, even for teams that find other software complex.
Pricing:
Cyfe offers a free plan with two dashboards and one user. Paid plans are higher than some competitors.
- Pros:
- Free plan available
- Integrates with all major data sources
- Cons:
- Limited customization options
- Not fully mobile-friendly
Whatagraph
Whatagraph is built for agencies that want to save time and scale reporting across many clients. You can use AI-powered insights to automate reports and prove the impact of your marketing efforts.
- Save hours each week with automated, AI-powered reports.
- Scale reporting for dozens or hundreds of clients.
- Prove the value of remarketing versus prospecting.
| Feature | Description |
|---|---|
| Native Integrations | 55+ integrations for seamless data connection. |
| Custom Integrations | API, Google Sheets, or BigQuery options. |
| Unified Data Hub | One secure hub for all data. |
| Custom Formulas | Create custom metrics and reusable transformations. |
| Performance Overviews | Insights by country, team, or product. |
| AI-Powered Reports | Automated, white-labeled reports. |
| Alerts | Notifications for immediate action. |
| Cross-Channel Reporting | Blended metrics for unified KPIs. |
| Client Engagement | Interactive reports for clients. |
| No Technical Setup | Easy report building for non-technical users. |
You can save over 60 hours a month on reporting, improve client retention, and deliver reports in your client’s language and currency.
- Pros:
- Automated reporting saves time
- Visual appeal and customization
- Good customer support
- Cons:
- Some stability and data accuracy issues
- Pricing may not fit smaller teams
With these top marketing dashboard tools, you can find the right marketing analytics dashboard for your agency’s needs. Each tool offers unique strengths in data integration, visualization, and reporting. Whether you need real-time insights, advanced analytics, or simple dashboards for client reporting, you have options that fit every agency size and workflow.
Marketing Dashboard Tools Comparison

Features and Integrations
When you compare dashboard reporting tools, you want to see how each one handles data, metrics, and integrations. The right dashboard lets you connect your marketing platforms, track performance, and deliver insights fast. Here’s a quick look at how some top tools stack up:
| Tool | Best For | Core Product Pricing | Primary Strength |
|---|---|---|---|
| Databox | Marketing agencies and SMBs | Paid plans only (Free/Starter tiers sunsetting) | Huge library of pre-built templates and native marketing integrations |
| Klipfolio | Marketing agencies and data-driven teams | Free plan available; Paid plans start at $125/month | Flexible sharing options and strong agency features |
| Cyfe | Small agencies, SMBs, and freelancers | Starts at $19/month; Free "Starter" plan available | Wide range of pre-built widgets and excellent value for the price |
| Domo | Large enterprises needing a unified BI platform | Quote-based pricing | Comprehensive platform for data integration and analytics |
You can see that each dashboard offers different strengths. Some focus on easy integration with marketing tools, while others give you more control over data analytics and visualization. If you need real-time insights, look for dashboards that update metrics instantly and support multiple data sources.
Pricing Overview
Pricing for dashboard reporting tools varies a lot. Some dashboards offer free starter plans, while others use quote-based pricing for enterprise features. You should match your agency’s needs with the right plan. For example, Cyfe gives you a low-cost entry point, while Klipfolio and Databox offer more advanced analytics and reporting for a higher price. Domo targets large agencies with complex data needs and custom pricing.
Pros & Cons Summary
When you choose a dashboard, you want to balance features, integrations, and cost. Here’s what you should consider:
- Databox gives you a huge library of templates and strong marketing integrations, but you lose free options.
- Klipfolio stands out for flexible sharing and agency-focused features, but higher-tier plans cost more.
- Cyfe offers great value and easy setup, but it may lack advanced analytics for larger agencies.
- Domo brings a full business intelligence platform, but it fits best for big teams with complex data analytics needs.
FineBI brings unique advantages to the table:
- You get self-service analytics with a drag-and-drop dashboard builder, so anyone on your team can create visualizations without coding.
- FineBI scales with your agency, handling large data volumes and supporting growth as you add more clients or metrics.
- Enterprise-grade governance features like role-based access control and audit logging keep your data secure and compliant.
If you want a dashboard that grows with your agency, supports real-time insights, and delivers strong reporting and visualization, FineBI is a smart choice. It helps you track marketing metrics, analyze sales performance dashboard data, and share insights across your team.
Choosing the Right Marketing Dashboard Tools
Assessing Agency Needs
You want a dashboard that fits your agency’s workflow. Start by listing your main goals. Do you need to track marketing campaigns, automate reporting, or deliver real-time insights to clients? Think about the types of data you handle every day. Some agencies focus on social media metrics, while others need deep analytics for paid ads or SEO. Write down the features you can’t live without. Maybe you need custom dashboards for each client or advanced visualization tools. When you know your needs, you can narrow down your options and avoid tools that don’t match your business intelligence goals.
Tip: Ask your team what slows them down. If manual reporting or scattered data is a problem, look for a dashboard that solves these issues.
Matching Tools to Team Size and Clients
Your agency’s size matters when you pick a dashboard. If you run a small team, you might want a simple dashboard with easy setup and quick access to insights. Larger agencies often need dashboards that scale, handle more data, and support multiple users. Consider how many clients you manage. Some dashboards let you create separate spaces for each client, while others focus on unified reporting. Use a table to compare dashboard options based on team size and client needs.
| Dashboard Tool | Best For Small Teams | Best For Large Agencies | Client Management Features |
|---|---|---|---|
| FineBI | Yes | Yes | Multi-client dashboards |
| Klipfolio | Yes | Yes | Automated client reporting |
| DashThis | Yes | No | Simple client dashboards |
Reporting and Integration Requirements
You need a dashboard that connects to your marketing platforms and pulls in all your data. Check if the dashboard supports integrations with tools like Google Ads, Facebook, or HubSpot. Strong reporting features help you turn raw data into clear insights. Look for dashboards that offer automated reporting, custom metrics, and real-time updates. If you work in a hybrid data environment, FineBI stands out. You get seamless integration with over 60 data sources and flexible reporting for business-led teams. FineBI’s self-service analytics let you build dashboards and share insights without waiting for IT support.
Choosing the right dashboard means matching your agency’s needs with the tool’s capabilities. When you find a dashboard that delivers strong reporting, easy integration, and actionable insights, you set your agency up for success.
Choosing the right marketing dashboard tool can shape your agency’s growth and boost client satisfaction. You want a platform that delivers clear insights, adapts as your team grows, and makes reporting simple. FineBI stands out for self-service analytics and real-time insights, helping you share valuable insights with clients. Try a few tools, talk with your team, and review your dashboard needs often. The right choice keeps your agency ahead.

Continue Reading About Marketing Dashboard Tools
Best Dashboard Apps for Business Insights
What is a Call Center Dashboard and Why Does It Matter
What is a Reporting Dashboard and How Does it Work
What is An Interactive Dashboard and How Does It Work
What is a Call Center Metrics Dashboard and How Does It Work


FAQ

The Author
Lewis
Senior Data Analyst at FanRuan
Related Articles

How to Build an Investment Portfolio Reporting Dashboard for Executives: KPIs, Benchmarks, and Drill-Down Views
Investment portfolio reporting for executives is not about showing every holding, transaction, and chart your investment team can produce. It is about giving CEOs, CFOs, CIOs, boards, and investment committees a fast, re
Yida YIn
Jun 25, 2026

12 KPI Reporting Examples for Executive Dashboards: What to Show in Weekly, Monthly, and Quarterly Reviews
Executive leaders do not need more data. They need decision ready $1 examples that match how often they review the business and what actions they are expected to take. A weekly $1 should surface fast moving risks and per
Yida YIn
Jun 25, 2026

How to Build a Digital Marketing Reports Dashboard: Executive Examples, KPIs, and Templates
A $1 is the control layer that helps executives and marketing leaders turn scattered channel data into fast, confident decisions. If you are a CEO, CMO, operations director, or marketing analytics lead, the real problem
Yida Yin
May 07, 2026