An executive report template is not just a formatting shortcut. It is a decision tool for leaders who need to understand performance, exposure, and required actions in minutes, not in a 20-page narrative. For operations directors, finance leaders, PMO heads, and business unit managers, the pain is familiar: too much detail, too little signal, inconsistent metrics, and reports that describe activity without driving decisions. A strong one-page executive report solves that by compressing the right message, data, risks, and next steps into a format leaders can scan fast and trust immediately.
Click To Try The Dashboard
All reports in this article are built with FineReport
Executive report template essentials leaders can scan in minutes
A one-page executive report exists to answer one question: what do leaders need to know right now to make a sound decision? It works better than a full narrative update when the audience is senior, the reporting cadence is frequent, and the goal is rapid alignment. Weekly operating reviews, monthly business reviews, portfolio updates, transformation programs, and regional performance check-ins are ideal use cases.
A full narrative report still has value when legal nuance, technical explanation, or deep root-cause analysis is required. But for routine executive reporting, a concise format usually wins because it respects limited attention and accelerates action.
Enterprise leaders typically expect four questions answered at a glance:
How are we performing? Are we on target, ahead, or behind?
Where is the risk? What threatens outcomes, cost, timeline, compliance, or customer impact?
What decisions are needed? What requires approval, escalation, or prioritization?
What happens next? What actions will be taken, by whom, and by when?
This is where many teams confuse different reporting formats. An executive report is a high-level operating or strategic view designed for action. A management update is often more detailed and geared toward team coordination. An executive summary usually condenses a larger document or proposal, while an executive report often stands alone as the main leadership artifact.
What to include on one page
Start with the headline message
The top of the page should carry the single most important takeaway in plain business language. Not a vague status label. Not “project progressing as planned.” Leaders need a message with meaning.
Good headline examples:
Q2 margin improved 2.3 points, but supply delays threaten July commitments
Program remains on budget, though deployment risk in Region East requires executive approval
Customer churn stabilized, but retention gains are below target and pricing action is needed
This headline should also explain why the update matters now and what changed since the previous report. The reader should instantly understand the shift in business conditions.
A strong executive report template does not try to show everything. It shows the few KPIs that directly connect to strategic goals, financial outcomes, delivery performance, or operational health.
For featured-snippet clarity, here are the essential Key Metrics (KPIs) leaders often expect on a one-page executive report:
Revenue or Value Delivered: Measures business output, realized benefit, or commercial performance.
Budget Variance: Shows whether actual spend is above or below plan.
Schedule or Milestone Status: Indicates whether key deliverables are on track.
Forecast vs Target: Compares expected outcome with the committed goal.
Operational SLA or Service Level: Reflects service reliability and customer-facing performance.
Risk Level: Summarizes severity and likelihood of major threats.
Issue Aging: Highlights unresolved blockers and how long they have remained open.
Decision Lead Time: Shows how quickly approvals or escalations are being resolved.
Customer or Stakeholder Impact: Signals whether outcomes affect client experience, adoption, or satisfaction.
Capacity or Resource Utilization: Reveals workload pressure and execution constraints.
Each KPI should include three context signals:
Trend direction: Up, down, or stable
Variance: Difference from plan, target, or prior period
Target: The threshold that defines success
Without those three signals, a metric is just a number. With them, it becomes interpretable.
This section is where executive reporting either becomes useful or fails. Senior leaders do not just want status. They want to know what is standing in the way and what intervention is required.
Keep this section tight. Focus on the top one to three issues that materially affect outcomes, timelines, costs, compliance, or customer commitments. For each item, include:
The risk or blocker
The business impact
The required executive action
The urgency or due date
For example:
Vendor integration delay — pushes rollout by two weeks and may impact revenue recognition; decision needed: approve contingency spend by Friday.
Regional staffing gap — threatens service levels in peak period; action needed: approve temporary resource reallocation.
Scope expansion request — increases cost by 8%; decision needed: approve, defer, or reduce scope.
Close with next steps and ownership
The final section should translate insight into accountability. If the report stops at observation, it leaves work unfinished.
Your next steps should include:
Action
Owner
Date
Expected outcome
Avoid generic statements like “monitor situation” or “follow up with team.” Strong commitments are specific enough to review in the next reporting cycle.
Examples:
Finalize revised deployment plan — VP Operations — May 28
Submit cost mitigation options — Finance Director — May 30
Confirm vendor recovery timeline — Program Manager — May 24
One reason many executive reports miss the mark is that authors write for themselves rather than for the reader. Different leaders scan the same page for different signals.
CEOs look for strategic movement, enterprise risk, business impact, and whether intervention is required.
CFOs focus on budget variance, forecast reliability, ROI, cost pressure, and exposure.
COOs prioritize execution, throughput, bottlenecks, service reliability, and operational continuity.
Business unit heads care about performance against target, local constraints, ownership, and actions needed to protect results.
That is why brevity matters. Executives rarely read line by line. They scan headlines, color cues, variances, exception notes, and ownership fields. Comparability also matters. If every report uses different labels, date formats, or KPI definitions, leaders waste time decoding structure instead of making decisions.
Visual hierarchy is critical here. Put the most important message first. Use whitespace intentionally. Make exceptions and decision points stand out. Let the page direct the eye from summary to metrics to risks to actions.
Common executive reporting mistakes to avoid
Too much detail and not enough signal
The fastest way to weaken an executive report is to overload it with commentary, secondary metrics, and background explanation. If a detail does not support a decision, it probably belongs in an appendix or backup slide.
Common offenders include:
Long narrative paragraphs
Metrics with no strategic relevance
Historical context that does not change the current decision
Raw data tables that require interpretation
The goal is not to prove effort. The goal is to communicate signal.
No clear recommendation
Many reports describe what happened but never state what should happen next. That creates friction for senior leaders because they must infer the recommendation themselves.
A better approach is to include a direct recommendation when appropriate:
Approve additional budget
Escalate vendor issue
Reprioritize initiative sequence
Hold launch until compliance review is completed
That does not mean overstepping. It means doing the analytical work before the meeting.
Weak formatting and inconsistent data
Even good insights lose credibility when formatting is sloppy or definitions shift between reporting cycles. Trust is built through consistency.
Use the same:
Date conventions
Metric names
Color logic
Units of measure
Reporting periods
Variance formulas
If “on track” means one thing this month and another next month, the report becomes unreliable.
A practical structure you can adapt
Recommended one-page layout
A practical executive report template usually works best with this structure:
Header
Report title
Scope or business area
Reporting period
Report owner
Summary box
Main headline message
Why it matters
What changed since the last update
Performance section
Three to six critical KPIs
Actuals, targets, variance, and trend
Risk and decision section
Top blockers or risks
Business impact
Decision or escalation required
Next steps section
Immediate actions
Owners
Dates
This structure works because it mirrors executive thinking: first significance, then evidence, then intervention, then accountability.
The best template is adaptable, not rigid. The same one-page structure can support multiple executive scenarios if the content is adjusted to the decision context.
Board updates
Emphasize strategic outcomes, governance, major risks, and investment implications.
Project reviews
Highlight milestones, budget, delivery confidence, dependencies, and approvals needed.
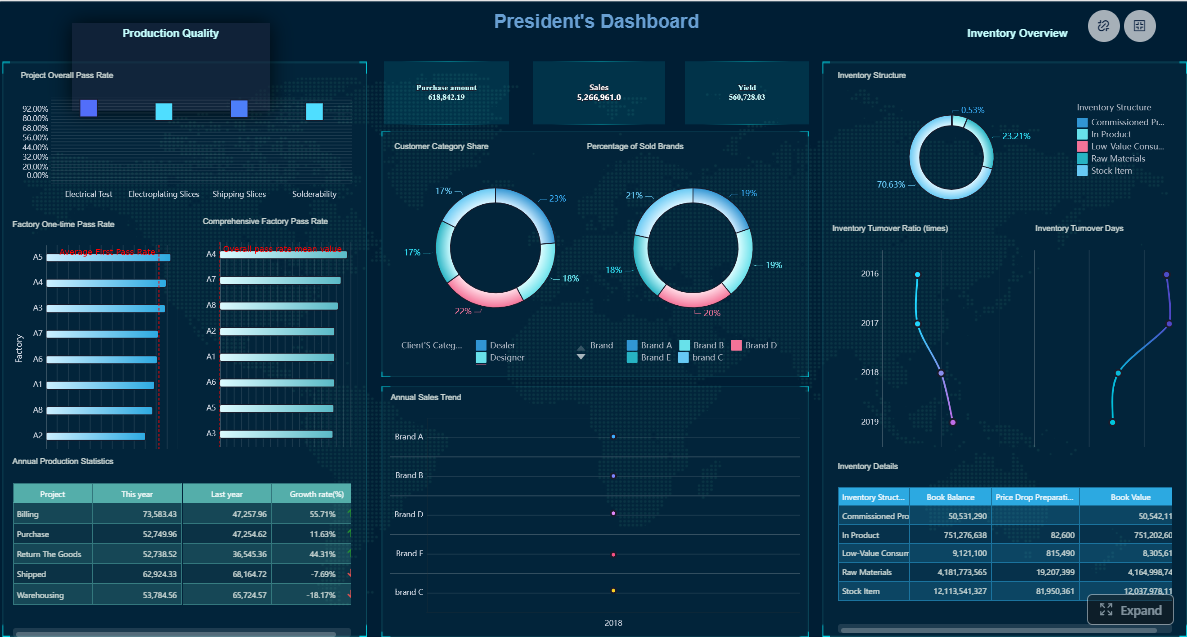
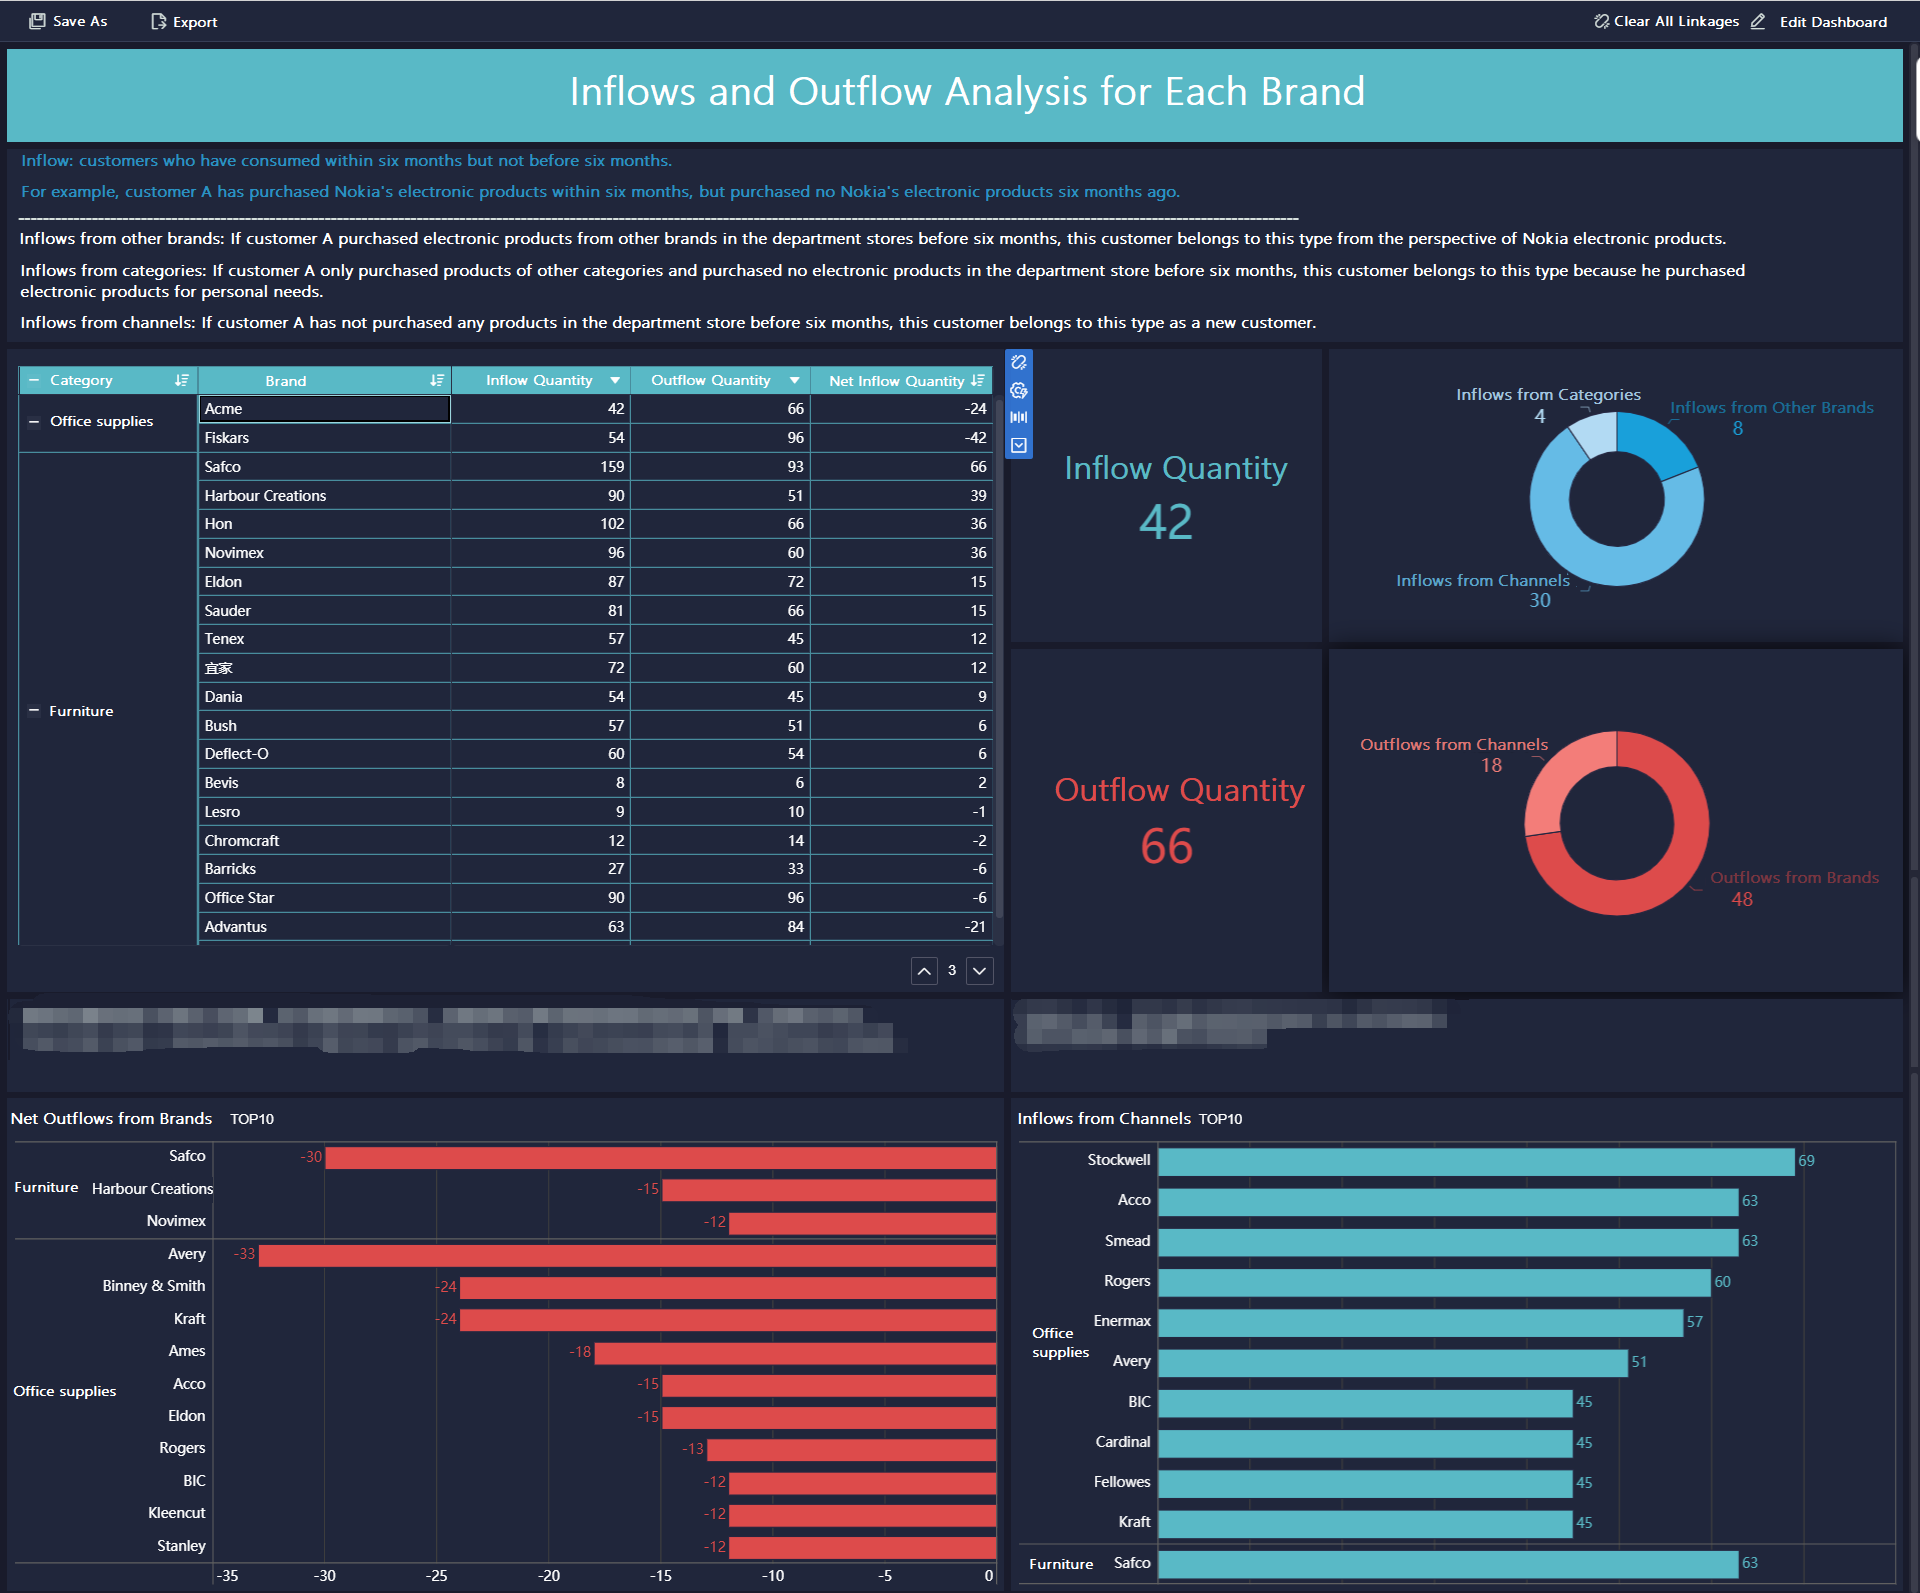
Operational dashboards
Focus on service levels, throughput, incident trends, utilization, and corrective actions.
Investment requests
Lead with business case, expected return, timing, risk exposure, and approval ask.
The language should also shift with the audience. Board members want strategic framing. Operating leaders want execution clarity. Finance stakeholders want numerical precision. The reporting cadence matters too: weekly reports should be sharper and more exception-based, while monthly reports can include slightly more context.
Where templates help and where judgment still matters
Templates help by reducing drafting time, standardizing structure, and improving consistency across teams. They are especially useful when multiple functions must report to the same executive audience. A shared format makes cross-functional comparison easier and supports faster review.
Depending on workflow, teams may use different output formats:
Word for memo-style reporting and easy collaboration
PDF for controlled distribution and formal presentation
Presentation slides for meeting-led reviews
Design tools for branded external communication
But format alone does not create clarity. A template cannot decide which KPI actually matters, what risk deserves escalation, or how to frame a recommendation for an executive audience. That still requires judgment, business context, and disciplined reporting habits.
Building an executive report template at scale with FineReport
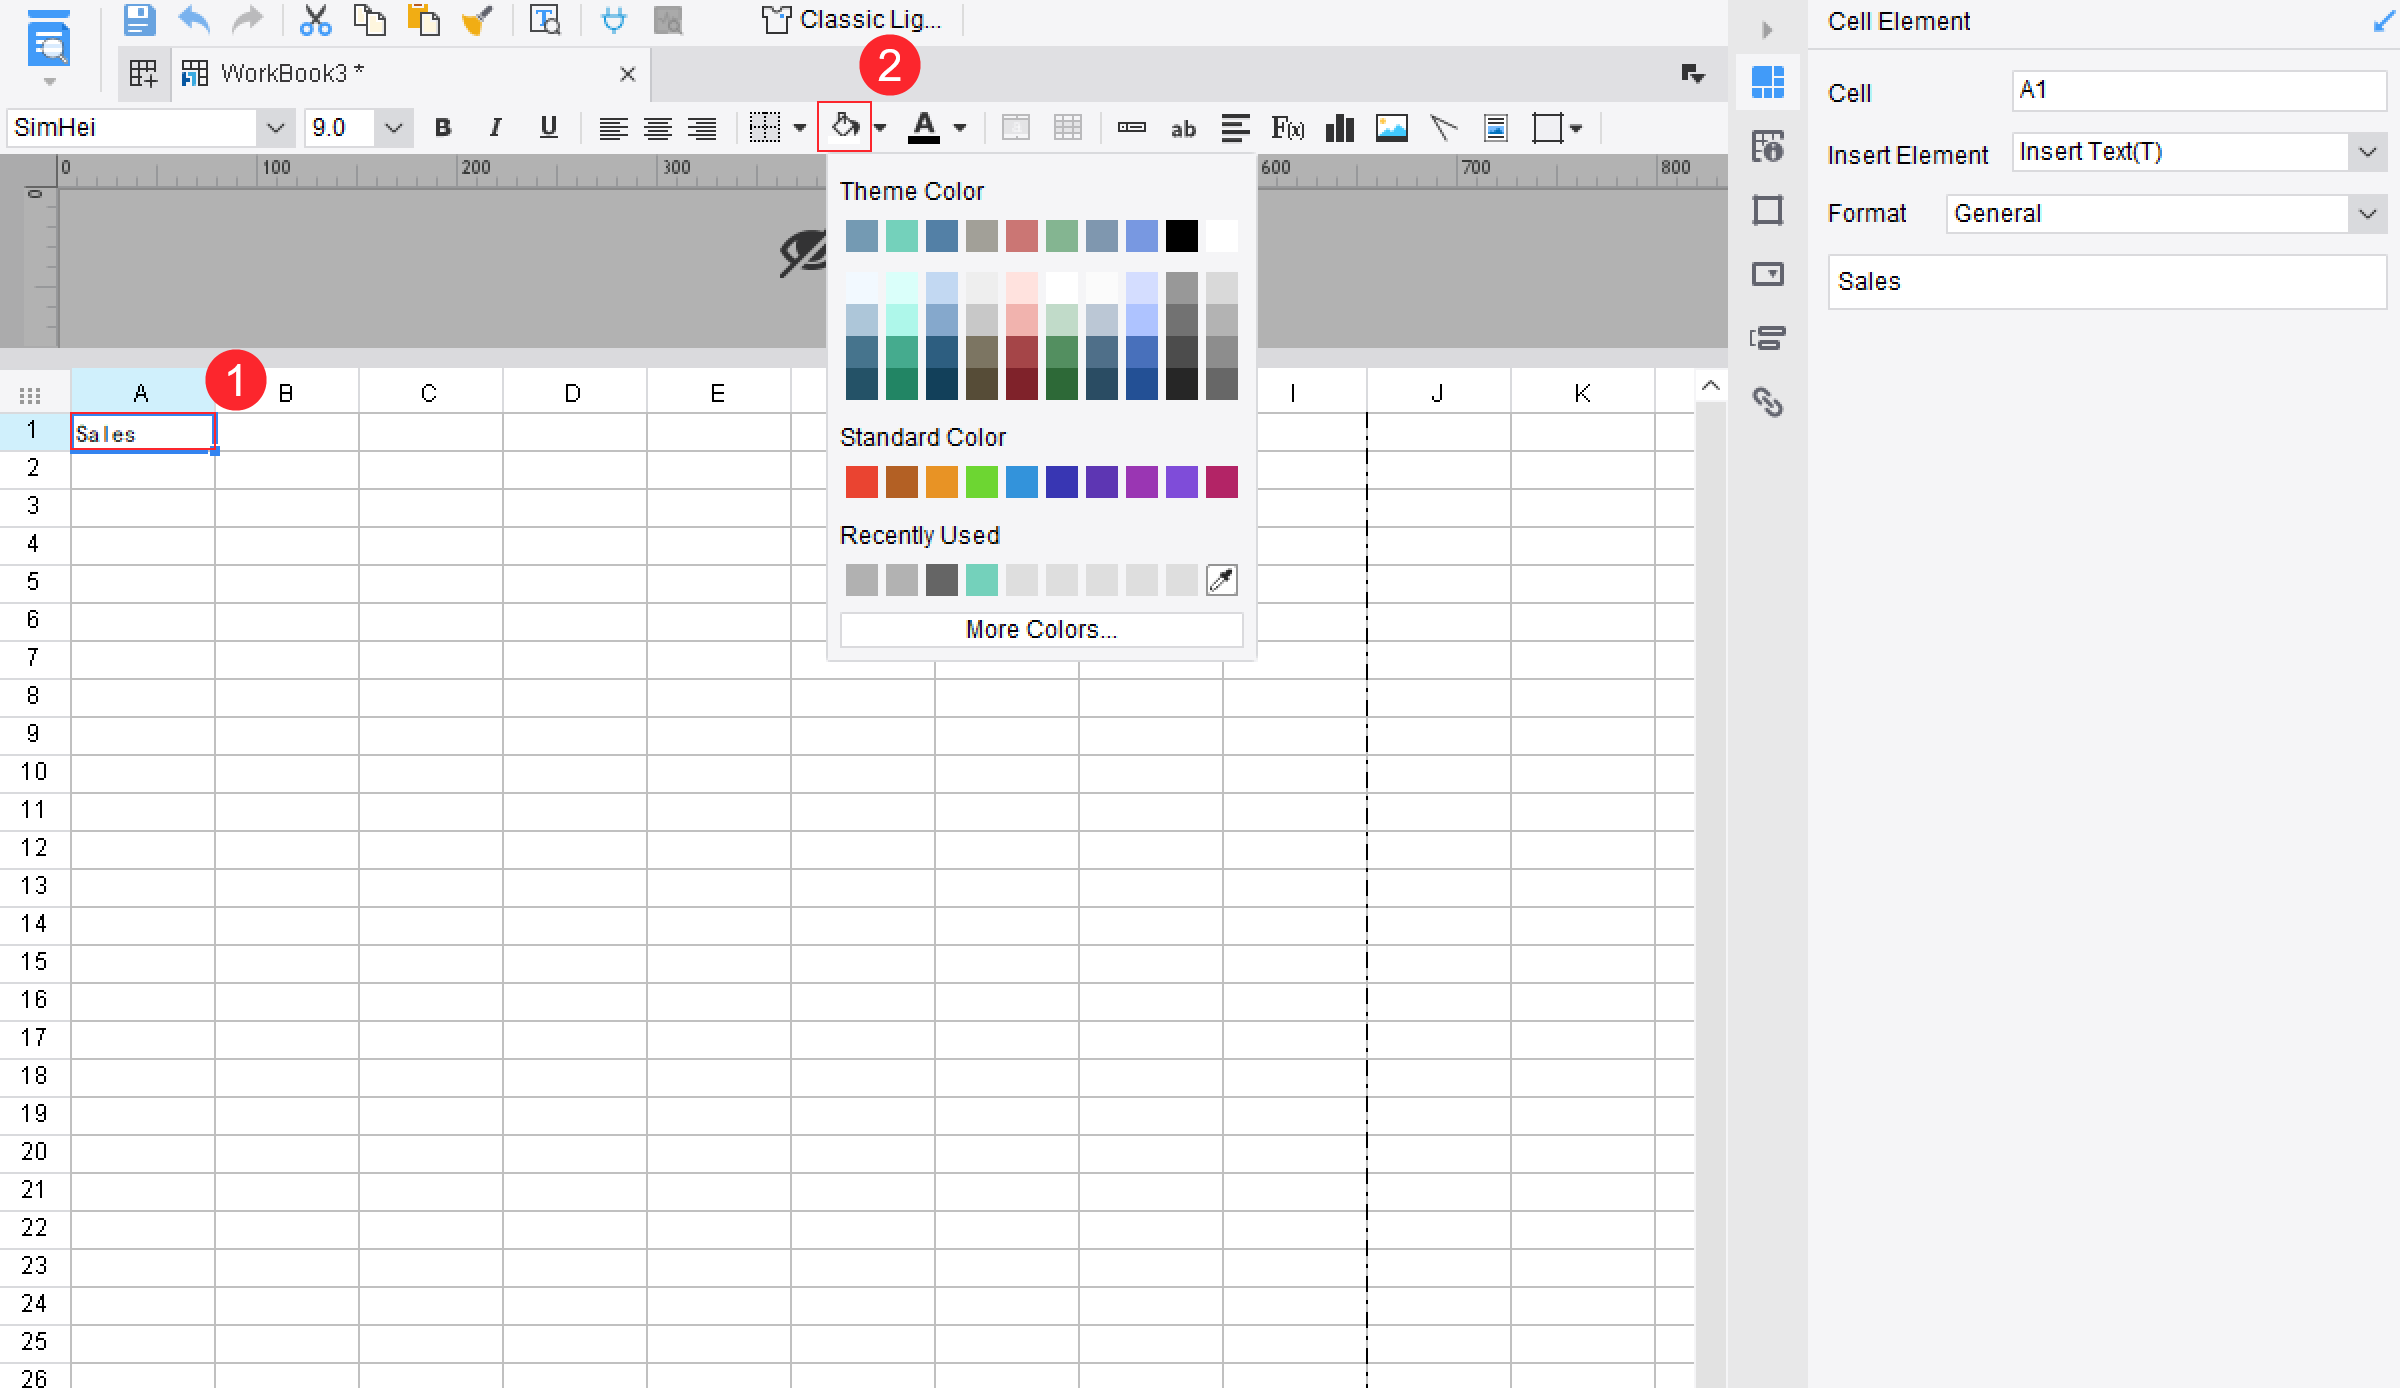
Building this manually is complex; use FineReport to utilize ready-made templates and automate this entire workflow. For enterprise teams, the challenge is rarely writing a single report once. The real challenge is producing reliable one-page executive reports every week or month across departments, with clean data, consistent logic, and visual clarity.
FineReport helps solve that at scale by enabling teams to:
Deliver dashboard-style reporting with drill-down capability when needed
That means leaders get the one-page view they need, while analysts and managers avoid rebuilding reports from scratch each cycle.
From a consulting perspective, the biggest value is not just speed. It is governed consistency. When every executive report follows a trusted structure and pulls from validated data, decision-making gets faster and more confident across the enterprise.
If your current reporting process depends on manual slide edits, spreadsheet stitching, and inconsistent team inputs, this is exactly where automation creates measurable value.
A high-performing executive report template should do four things well: state the main message, show decision-driving KPIs, surface risks and required actions, and assign next steps with ownership. Get those four right, and one page is enough for most leadership reviews.
For organizations that want to standardize this process without adding reporting overhead, FineReport provides the fastest path from fragmented updates to executive-ready reporting.
An executive report is usually a stand-alone leadership update focused on performance, risks, decisions, and next steps. An executive summary typically condenses a longer document such as a proposal, business plan, or full report.
A strong one-page template should include a clear headline message, a small set of decision-driving KPIs, major risks or blockers, decisions needed, and immediate next actions. The goal is to let leaders understand the situation in minutes.
Most executive reports work best with a limited number of KPIs, often five to ten, depending on the audience and topic. Too many metrics reduce clarity and make it harder for leaders to spot what matters most.
Focus on business impact rather than activity, and show trend, variance, and target for each key metric. Keep the message concise, highlight only the most material risks, and make any required executive decision explicit.
Yes, FineReport can be used to create one-page executive dashboards and report templates with KPI cards, trend indicators, risk flags, and action tracking. This helps teams standardize reporting and give leaders a faster view of performance.
Product Trial
FineReport
Pixel-perfect reports · Interactive dashboards · Easy data entry · Digital twins