Executives do not need a blow-by-blow account of project activity. They need fast clarity: what is happening, what is at risk, what decision is needed, and what business impact follows. That is why effective project report templates are built for decision velocity, not documentation volume. For PMOs, IT managers, operations directors, and program leads, the right template reduces reporting friction, improves alignment, and helps leadership act before small issues become expensive problems.
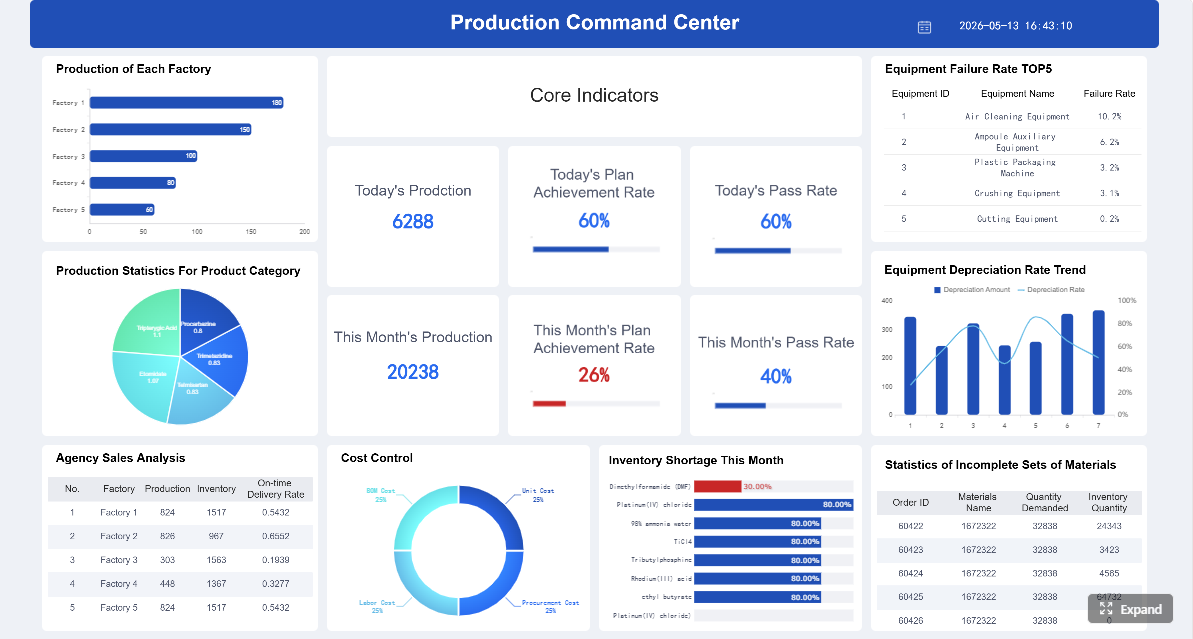
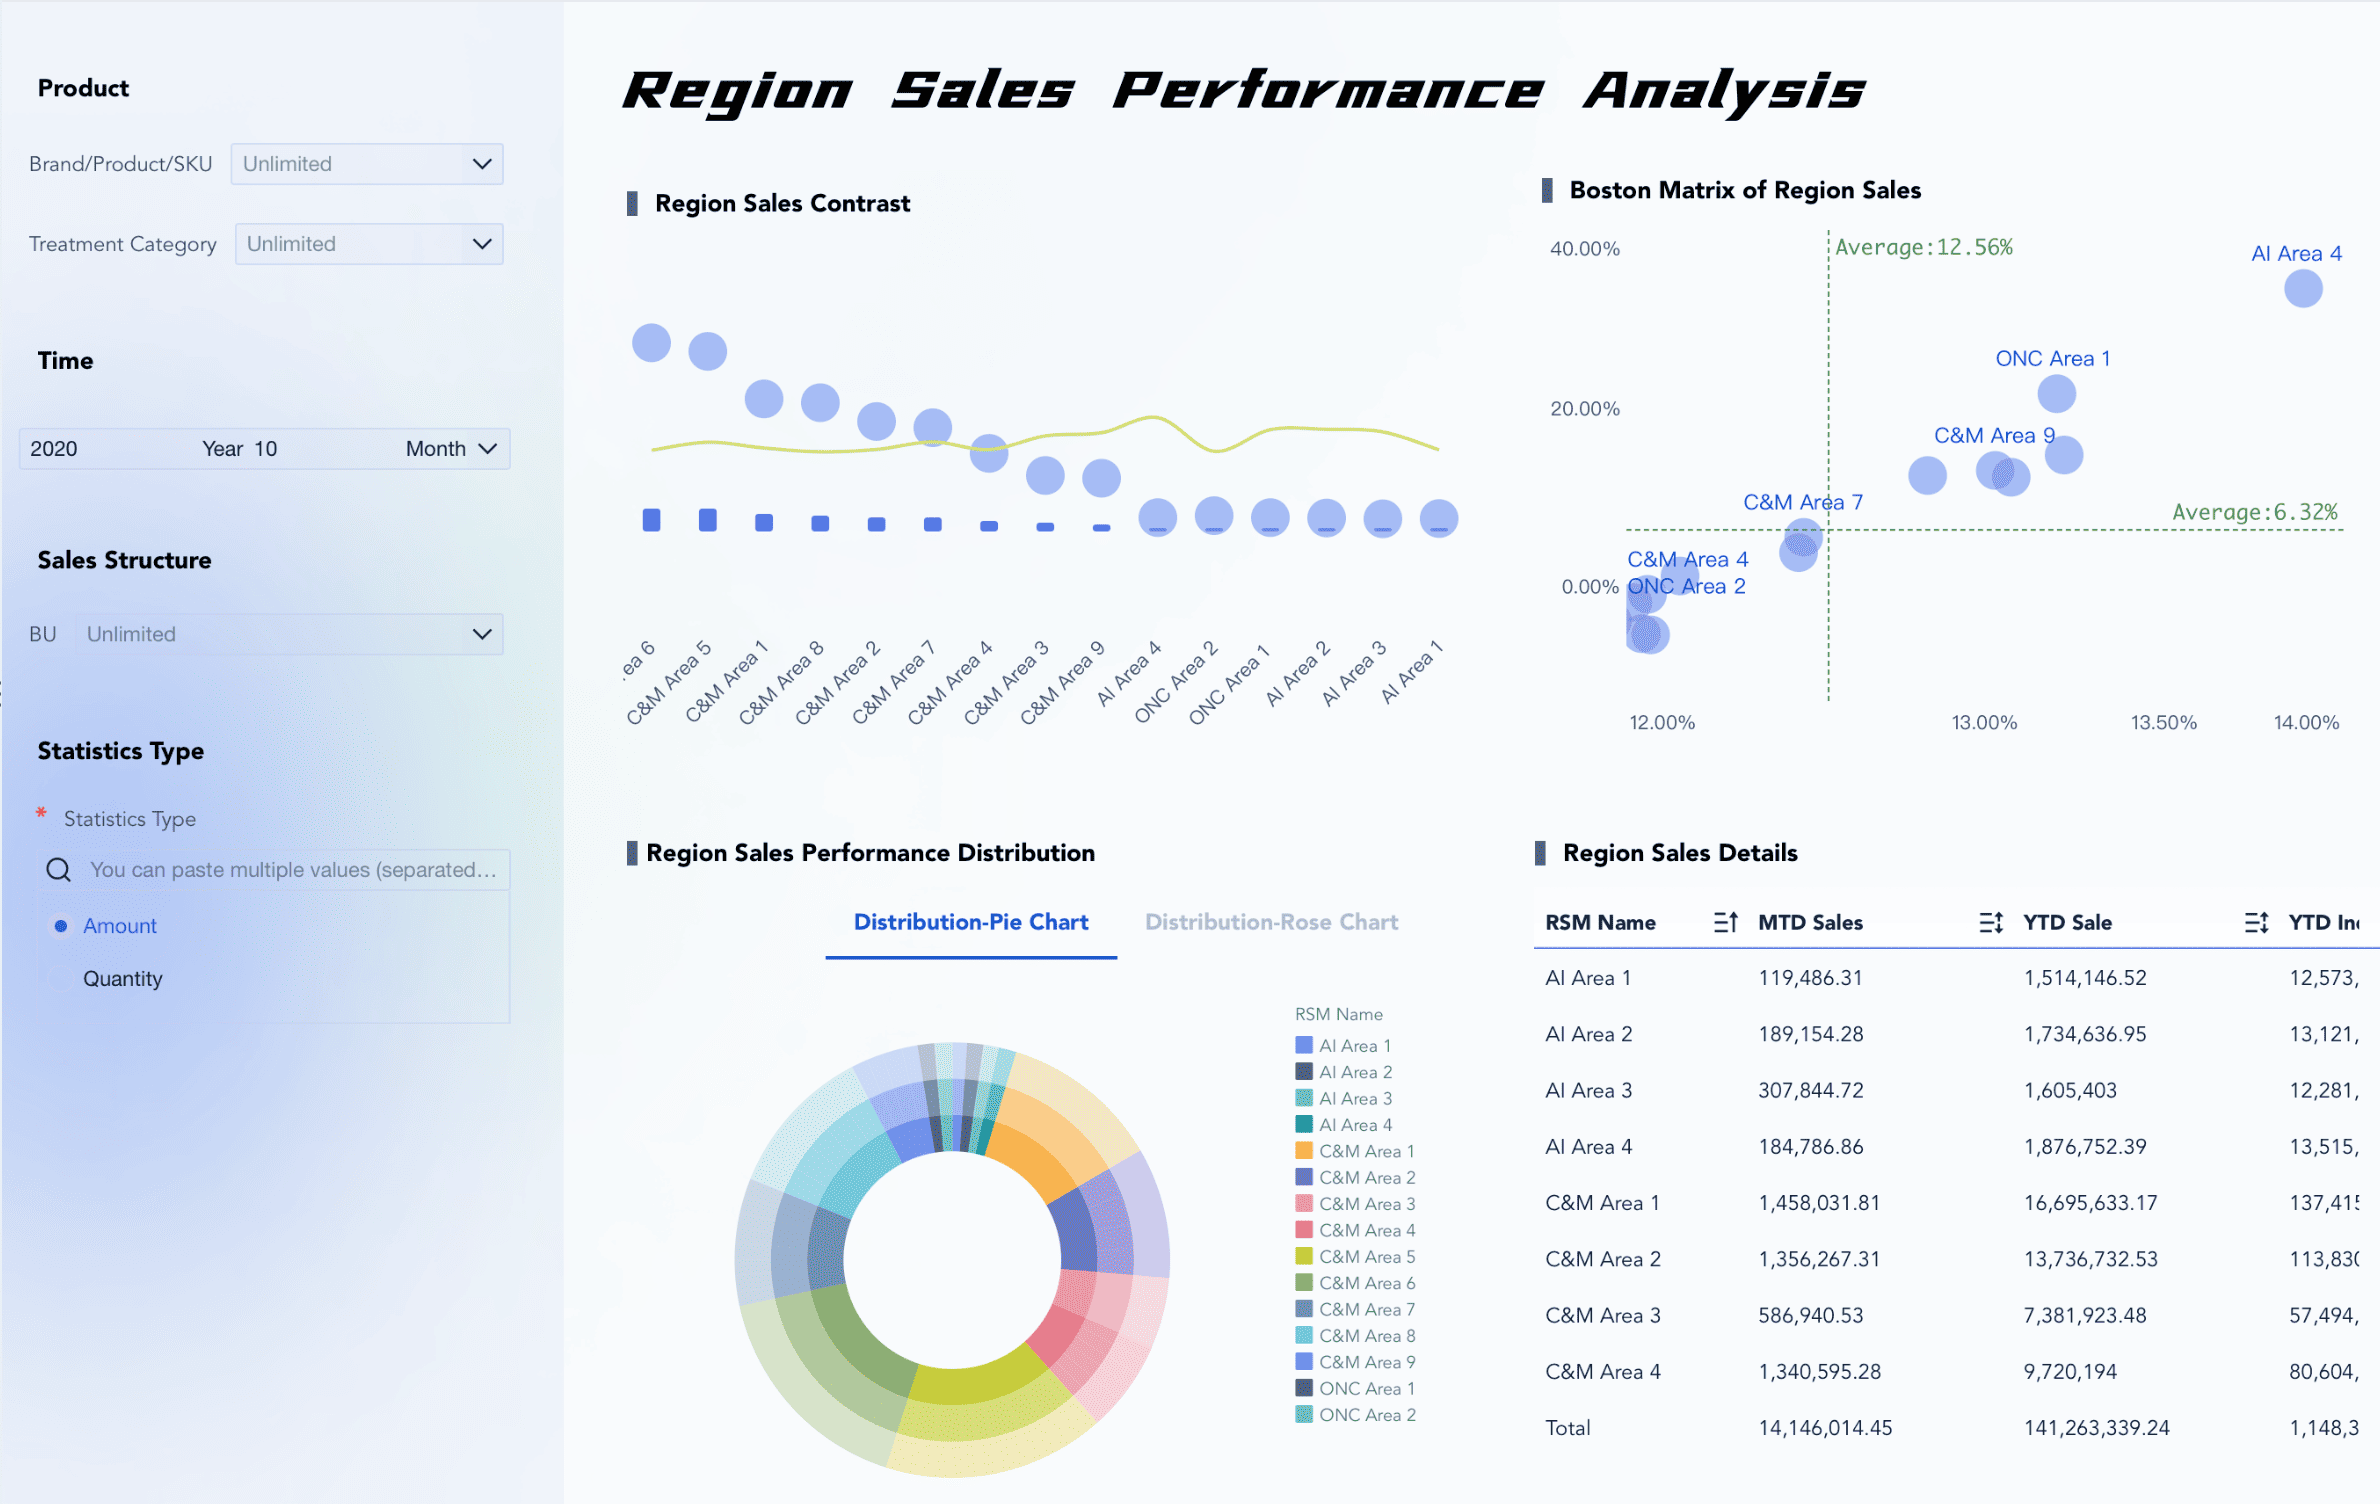
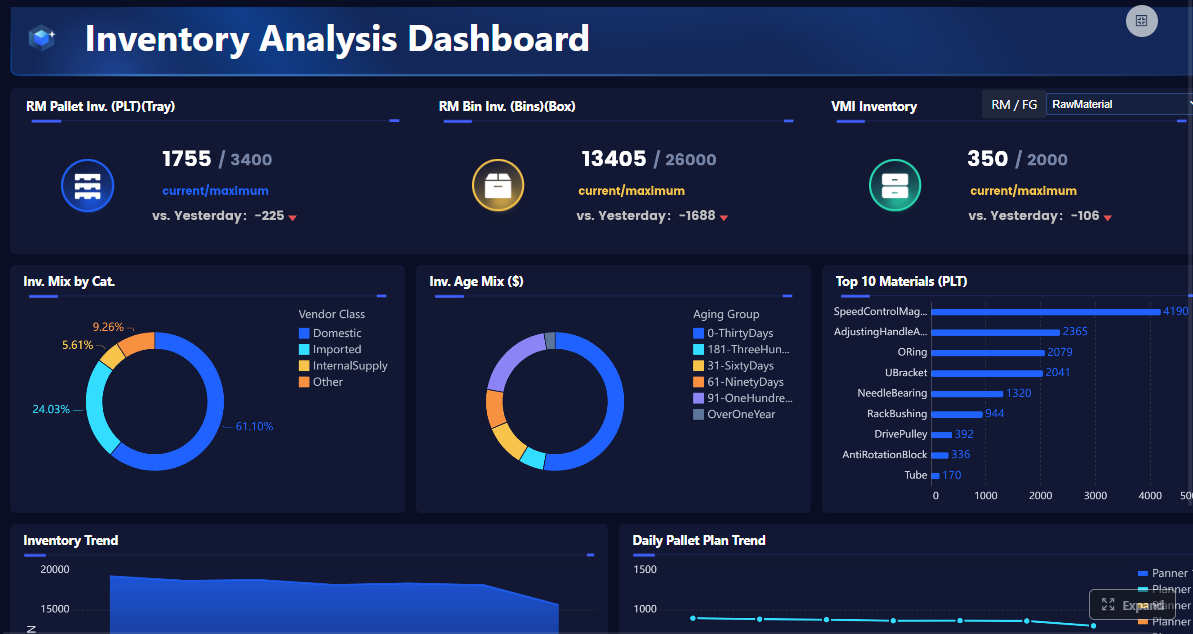
Click To Try The Dashboard
All reports in this article are built with FineReport
Why Project Report Templates Matter for Executive Decision-Making
Executives prefer concise, decision-oriented reporting because their job is to allocate resources, remove blockers, manage risk, and approve tradeoffs. They are not looking for every task update. They are looking for a reliable operating picture. Strong project report templates translate project complexity into a format leaders can scan in minutes.
A one-page format is especially effective because it forces prioritization. Instead of burying key facts across slides, spreadsheets, and email threads, teams summarize what matters most: status, risks, budget, timeline, outcomes, and required actions. This improves scanability and shortens response time in leadership reviews.
Well-designed templates also create organizational consistency. When every project follows the same reporting logic, executives spend less time decoding formats and more time making decisions. Over time, this standardization improves governance, portfolio visibility, and accountability across departments.
What makes project report templates effective for leadership audiences
The best executive-facing templates share a few core characteristics:
Concise structure: One-page or tightly controlled layout with no filler.
Decision-first design: Critical ask and business impact appear at the top.
Visual clarity: Status signals, trend indicators, and summaries are easy to scan.
Business language: Goals, risks, and outcomes are explained in plain terms.
Actionability: Each update leads naturally to a decision, action, or follow-up.
Key Metrics (KPIs) executives expect in project report templates
To make your report useful at the leadership level, include a consistent set of KPIs and signals:
Overall project status: A red, amber, or green indicator showing current health.
Milestone completion rate: Percentage of planned milestones completed on time.
Schedule variance: Difference between planned timeline and actual progress.
Budget variance: Difference between approved budget and current or forecast spend.
Resource capacity utilization: Whether the current team has enough bandwidth to deliver.
Open critical risks: Number of risks with material impact on scope, timeline, cost, or quality.
Open issues requiring escalation: Active blockers that need immediate action.
Dependency status: Whether external teams, vendors, or approvals are on track.
Business outcome metric: A direct measure tied to value, such as adoption, revenue lift, cost savings, or service improvement.
Decision aging: How long key approvals or unresolved decisions have been pending.
Section 1: Executive Summary and Decision Required
What leaders need to know first
This is the most important section in any executive-ready project report template. If leadership reads only one part, it will be this one. The executive summary should state the current project position, the direction of travel, and the single takeaway that matters most right now.
A strong summary answers three questions immediately:
What is the current status?
What is the business implication?
What decision or support is needed?
For example, instead of writing, “Development is progressing with some challenges,” write: “The project remains on track for phase-one launch, but delayed vendor API access now threatens user acceptance testing. Executive approval is needed to prioritize vendor escalation this week.”
That style works because it combines status, impact, and action in one short block.
What to include in this section
A one- or two-sentence status overview
The most important project development since the last report
The specific decision, approval, or escalation required
The urgency level and likely business impact
The recommended next step
This section should read like a briefing note, not a progress diary. The goal is to let executives know where to focus attention in under 30 seconds.
Section 2: Goals, Scope, and Current Progress
Tie the update back to business objectives
Projects drift when status reporting becomes detached from business purpose. That is why effective project report templates restate the goal and scope in simple language before showing progress. Leaders need to know not just that work is moving, but that the work still aligns with the intended business result.
Start by restating:
The project objective
The success criteria
The agreed scope boundaries
Then show progress against milestones, deliverables, or timeline commitments. Distinguish clearly between what is complete, what is in progress, and what is coming next. This structure reduces ambiguity and helps leaders judge whether execution still matches expectations.
When this section is done well, executives can quickly see whether the initiative is advancing the original business case or quietly expanding beyond it.
Section 3: Risks, Issues, and Dependencies
Surface blockers before they become surprises
This section protects executive trust. Leaders do not expect projects to be risk-free. They do expect risks to be surfaced early, separated clearly from active issues, and paired with mitigation actions.
A common reporting mistake is blending everything into one generic “challenges” section. That weakens decision-making. Instead, divide the content into three buckets:
Risks: Potential future events that may affect delivery
Issues: Active problems already impacting the project
Dependencies: External inputs or commitments the team does not fully control
This distinction matters because each requires a different executive response.
What to report
For each major item, include:
Short description
Impact area: timeline, budget, quality, compliance, or adoption
Severity or probability
Mitigation or resolution plan
Whether executive support is needed
For example:
Risk: Security review backlog may delay release approval by two weeks.
Issue: Vendor data feed failed validation and blocked testing.
Dependency: Legal approval for contract amendment due by Friday.
This format makes it easy for executives to identify where intervention can create leverage.
Section 4: Budget, Resources, and Timeline Signals
Present the numbers that influence decisions
Executives need financial and capacity signals without digging through line-item detail. This section should present a high-level view of budget status, resource sufficiency, and schedule health using simple visual cues.
The objective is not to recreate the project plan. It is to show whether delivery remains viable under current conditions.
Include:
Budget status: Approved budget, actual spend, and forecast at completion
Timeline health: Planned versus actual milestones, plus forward-looking confidence
Trend signals: Improving, stable, or deteriorating
Stoplight indicators work well here because they reduce interpretation time. But the color must be supported by short context. A red budget flag without explanation is not useful. A red budget flag with “forecast increased by 8% due to extended vendor onboarding” is useful.
Also note any forecast changes. Executives care less about the fact that a forecast changed than about what that change means for delivery, benefits realization, or customer impact.
Section 5: Metrics, Outcomes, and Customer Impact
Focus on evidence, not just activity
This is where many project reports fall short. They describe effort instead of results. Executives want to know whether the project is creating measurable value, not just generating output.
That means your project report templates should include outcome-oriented KPIs tied to business performance. Depending on the initiative, this could include adoption, revenue impact, process efficiency, customer satisfaction, defect reduction, or service-level improvement.
Metrics that matter most
The exact metrics depend on the project, but leadership reporting usually benefits from a shortlist such as:
Adoption rate: Percentage of intended users actively using the new system or process
Time saved: Reduction in cycle time, handling time, or turnaround time
Cost impact: Savings realized or costs avoided
Quality performance: Error rate, defect rate, or rework reduction
Customer outcome: Satisfaction score, complaint reduction, retention, or service improvement
Operational throughput: Increase in completed cases, transactions, or units delivered
The critical point is linkage. Do not report “training completed for 120 users” unless you connect it to value. Report “training completed for 120 users, supporting a projected 85% adoption rate before go-live.”
Trend lines are especially helpful here. Executives often care more about movement than static numbers. A KPI that is slightly below target but improving may be acceptable. A KPI that is on target but deteriorating may need attention.
Section 6: Decisions, Actions, and Next Reporting Cycle
End with clear accountability
A report should never end with vague optimism. It should end with explicit accountability. This section tells leadership exactly what remains open, who owns it, and when it will be resolved.
At minimum, include:
Open decisions awaiting approval
Named owners for each action
Target dates
Immediate next steps before the next report
What will be reported next cycle
This is where the report becomes operationally useful. It gives executives a clean list of what to approve, what to monitor, and what to expect next.
A simple format works best:
Decision needed: Approve additional contractor support Owner: CIO Due date: May 30
Action: Escalate vendor data issue Owner: Program Director Due date: May 24
Next report will cover: User testing completion, revised launch confidence, and updated budget forecast
Also know when a recurring status update is no longer the right vehicle. If the project is complete, use a final project report template instead. Closeout reporting should focus on outcomes achieved, final cost and schedule performance, lessons learned, and handoff readiness rather than ongoing status.
How to Choose and Adapt a Template for Different Reporting Needs
Compare one-page, recurring, and closeout formats
Not every project report serves the same purpose. The best project report templates are adapted to the reporting moment without overwhelming the executive audience.
Here is a practical way to think about format choice:
One-page executive status report: Best for weekly or monthly leadership updates where decisions must happen quickly
Recurring project status report: Best for steering committees or PMO governance where consistent tracking across cycles matters
Final project report template: Best for project completion, benefit review, and lessons learned
The rule is simple: match the template to the decision context. If executives need a snapshot, keep it one page. If governance requires trends and cross-project comparison, use a recurring format with fixed fields. If the project has ended, shift to a closeout structure.
How to adapt templates without overloading executives
Teams often start with free or customizable templates, which is fine. The problem begins when every stakeholder adds another requested field. Soon the report becomes too dense to read.
To avoid that, evaluate templates using these criteria:
Usability: Can a busy executive scan it in two minutes?
Flexibility: Can teams adjust sections for different project types?
Branding control: Can it align with corporate standards?
Visualization support: Does it handle charts, indicators, and dashboards cleanly?
Export options: Can it be shared in PDF, presentation, portal, or mobile-friendly formats?
Data connectivity: Can it pull from live systems instead of manual copy-paste?
Best practices for implementing executive-ready project report templates
As a consultant, I recommend four practical steps:
Standardize the reporting logic before the design
Decide what every project must report: status, risks, budget, outcomes, and decisions.
Lock the minimum fields before debating layout.
Design for executive scan behavior
Put the decision request, health status, and top risks above the fold.
Use concise headers, short summaries, and clear status indicators.
Limit metrics to the few that influence action
If a metric does not change an executive decision, remove it.
Focus on signals that affect investment, timing, risk, or value realization.
Automate data collection wherever possible
Pull milestones, budget data, and KPI updates directly from source systems.
Reduce manual reporting effort so teams spend more time interpreting data than gathering it.
Review the template quarterly
Executive priorities shift.
Refresh the template based on what leaders actually use in meetings, not what teams assume they want.
Build Executive Project Report Templates Faster With FineReport
Building this manually is complex; use FineReport to utilize ready-made templates and automate this entire workflow. For enterprise teams, the challenge is not just designing better project report templates. It is maintaining reporting consistency across multiple projects, teams, and systems without creating another manual reporting burden.
FineReport helps solve that problem by turning executive reporting into a repeatable, data-driven process. Instead of chasing updates across spreadsheets, emails, and disconnected tools, teams can centralize project status, milestone progress, budget signals, and KPI outcomes into one reporting layer.
For organizations that want faster decisions, better governance, and more credible reporting, this matters. A strong template is useful. A strong template powered by automated, trusted data is far more valuable.
If you are still building executive reports by hand, now is the time to simplify the process and improve decision quality at the same time.
An executive-ready project report template should highlight current status, business impact, key risks, budget and timeline health, milestone progress, and any decision needed. The goal is to give leaders a fast, reliable summary they can act on quickly.
In most cases, one page is the most effective format for executive audiences. It forces teams to focus on the most important facts instead of overwhelming leadership with operational detail.
The most useful KPIs usually include overall project status, schedule variance, budget variance, milestone completion, open critical risks, dependency status, and business outcome metrics. These indicators help executives assess performance and urgency at a glance.
Weekly or monthly reporting is common, depending on project pace, risk level, and stakeholder expectations. High-priority or fast-moving projects may need more frequent updates when major decisions or escalations are involved.
FineReport can help teams turn project data into clear dashboards and standardized report templates that are easier for executives to scan. This improves consistency, reduces manual reporting effort, and supports faster decision-making.
Product Trial
FineReport
Pixel-perfect reports · Interactive dashboards · Easy data entry · Digital twins