A sales report template Excel file is most valuable when it helps sales managers, operations leaders, and business analysts answer three questions fast: How much did we sell, who drove the results, and where is revenue shifting month over month? If your team is still piecing together numbers from multiple sheets, inconsistent channel labels, and manual summaries, monthly reporting becomes slow, error-prone, and hard to trust. A well-built Excel template fixes that by standardizing raw data, automating calculations, and turning recurring reporting into a repeatable process.
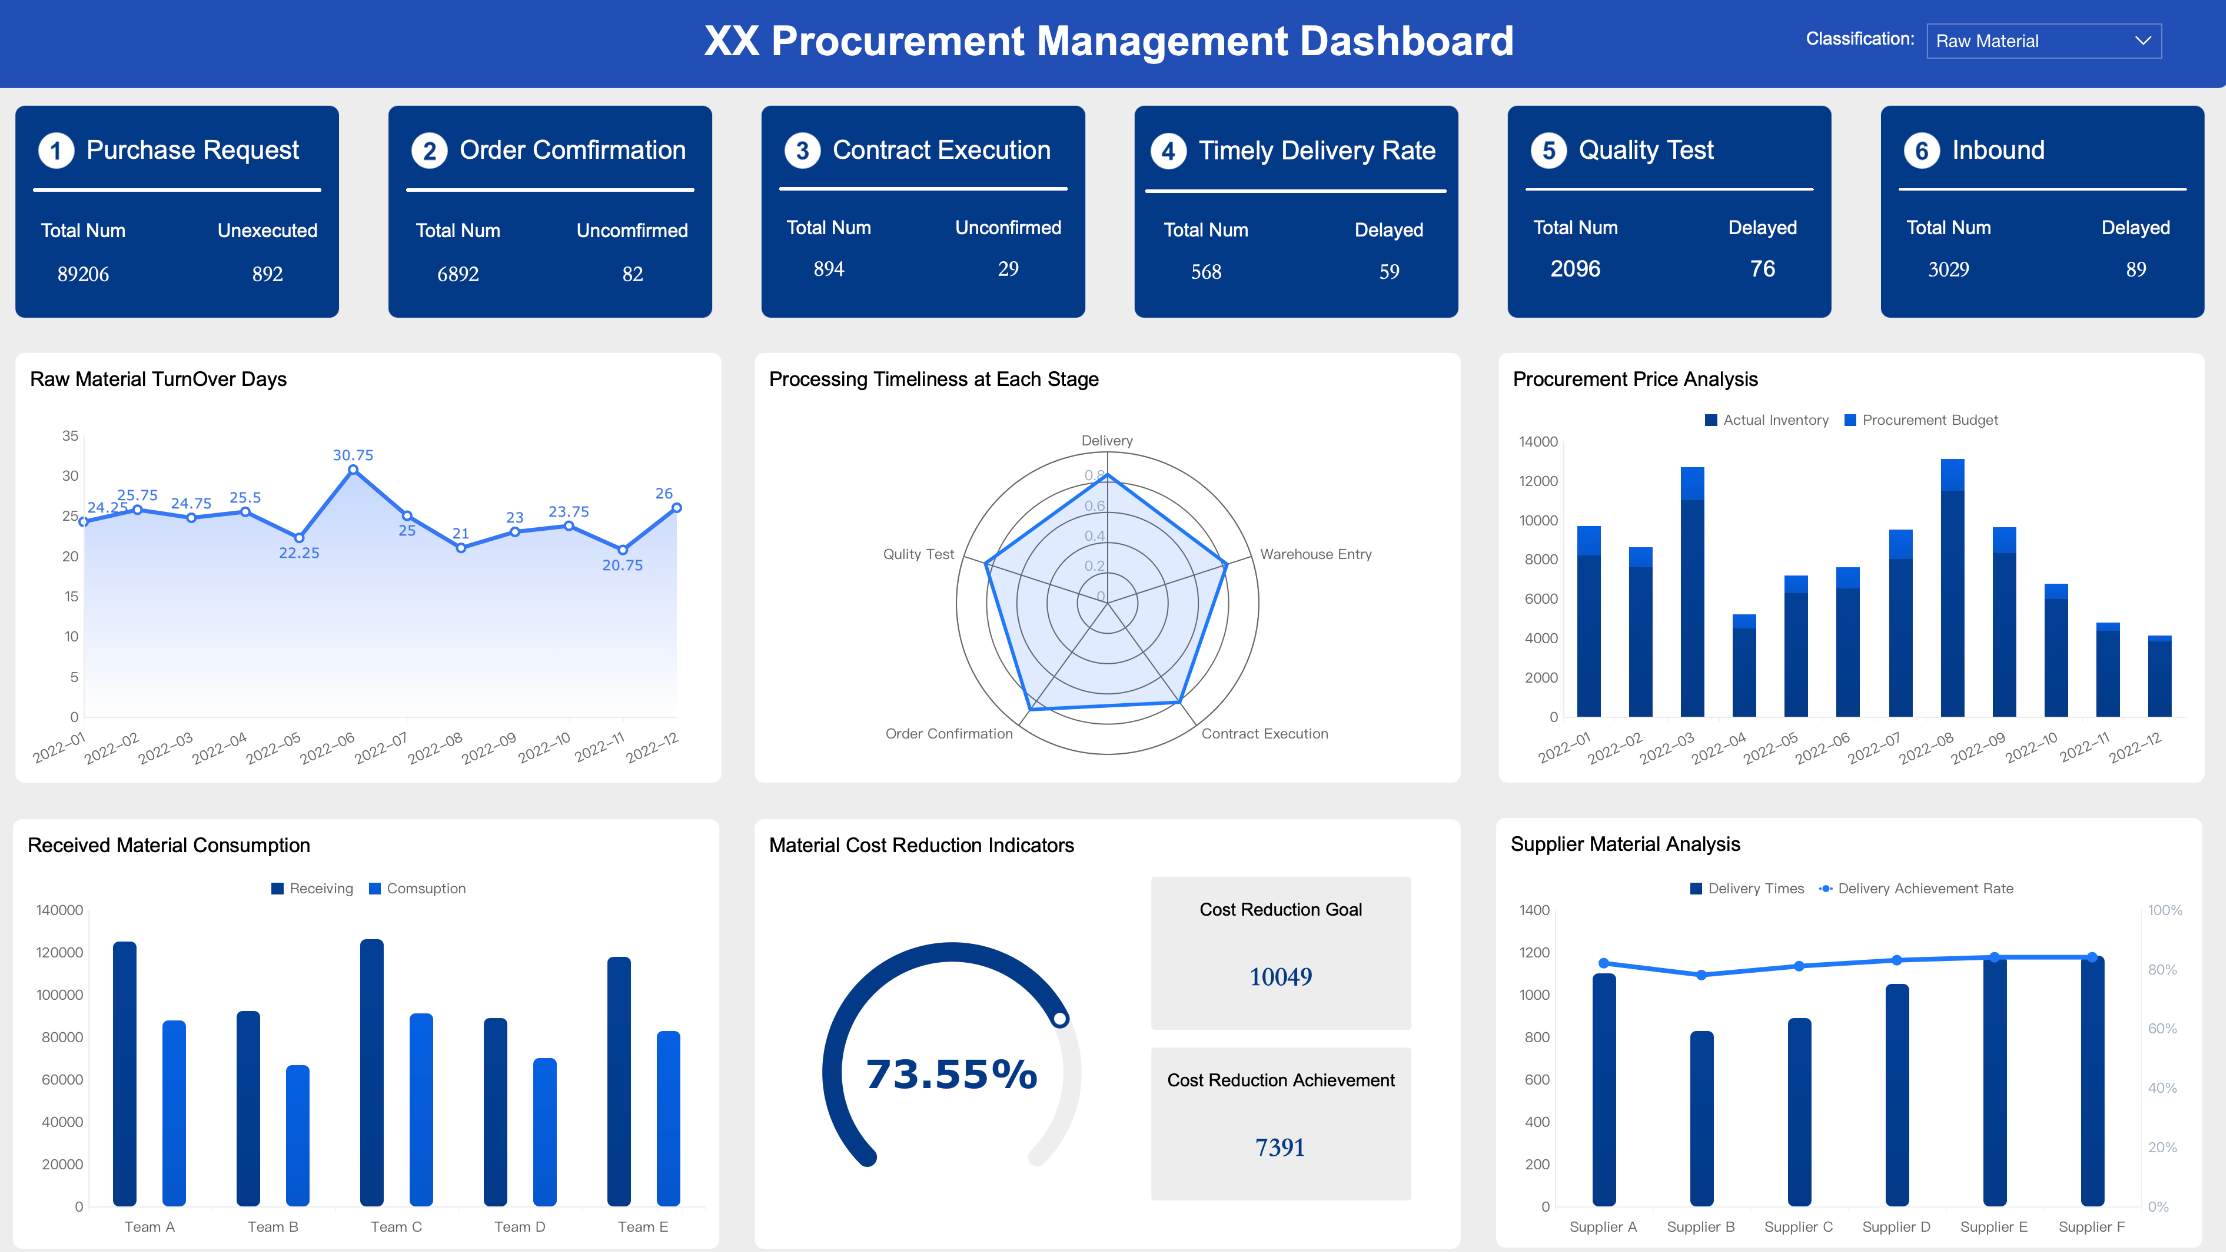
Click To Try The Dashboard
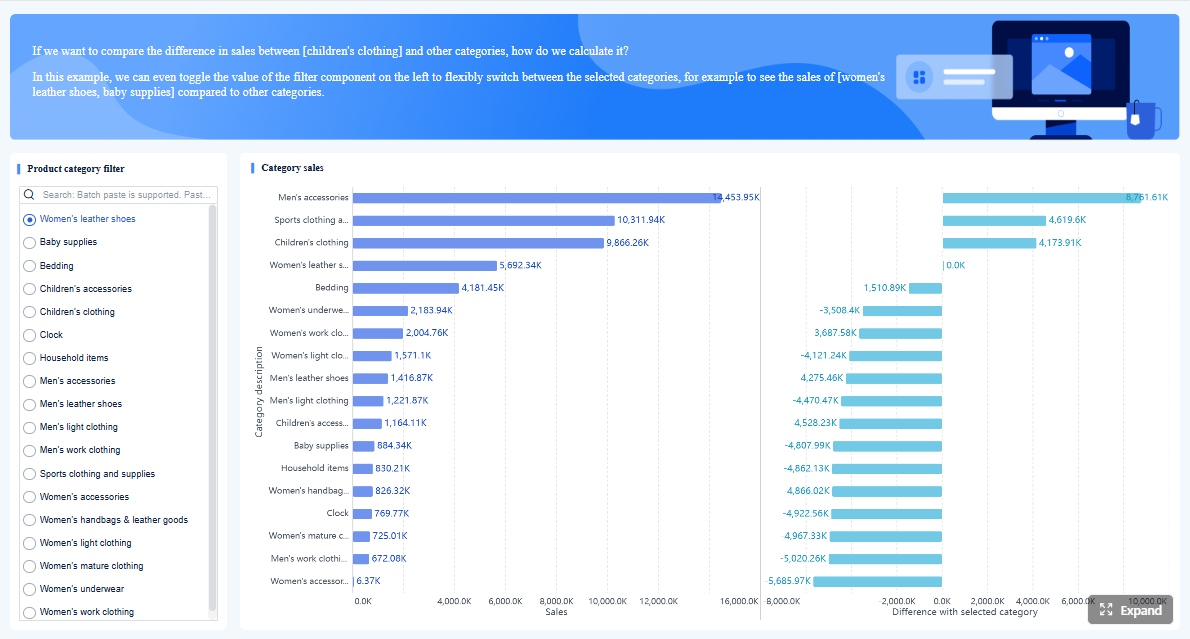
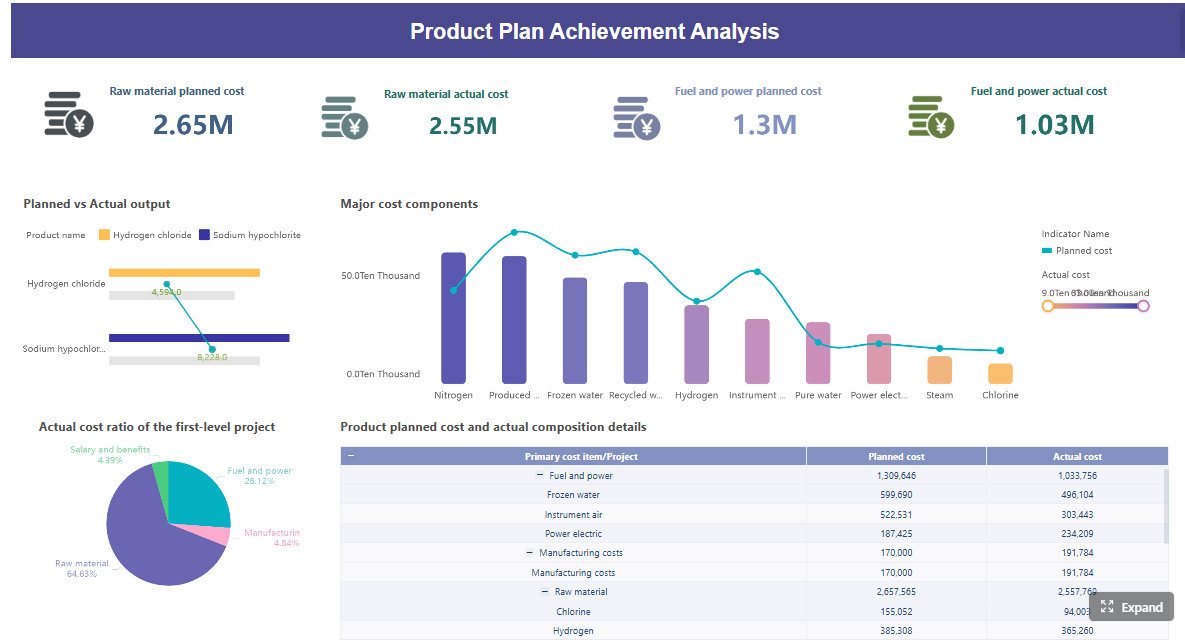
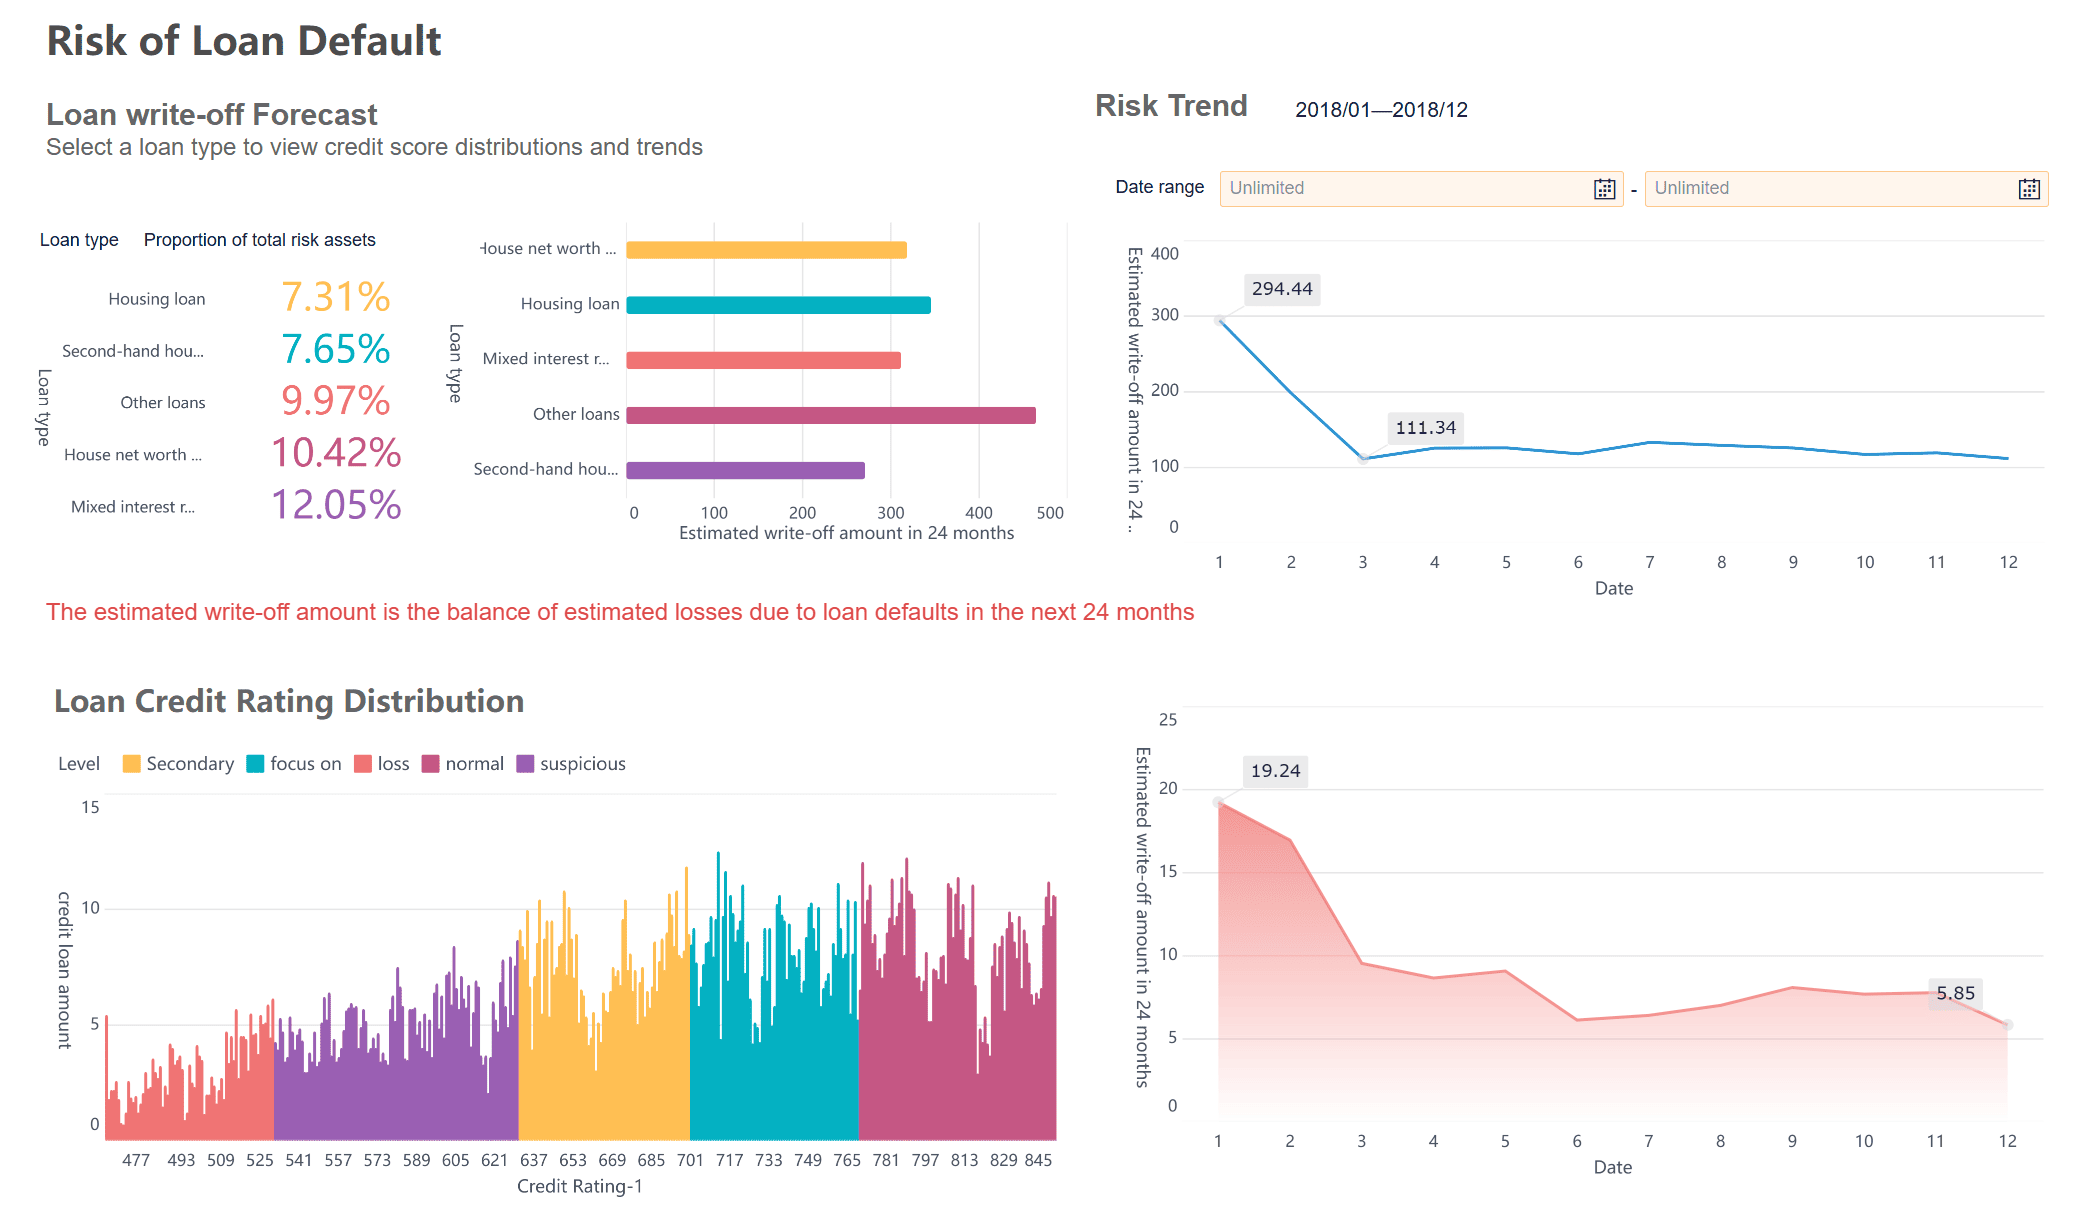
All reports in this article are built with FineReport
What a sales report template in Excel should track each month
A monthly sales report should do more than list transactions. It should surface the patterns that matter for management decisions: growth, decline, team performance, and channel efficiency. If your template cannot reveal those trends in under a few minutes, it is not doing its job.
The core metrics every monthly report needs
Every practical sales report template Excel setup should include a short set of KPIs that leadership can review at a glance.
Key Metrics (KPIs)
Total Revenue: The total sales value closed during the month. This is the primary performance indicator.
Units Sold: The total quantity of products or services sold. Useful for volume analysis.
Average Deal Size: Total revenue divided by number of closed deals. Shows whether deal value is rising or shrinking.
Conversion Rate: The percentage of leads or opportunities that became sales. Helps evaluate selling effectiveness.
Month-over-Month Change: The percentage increase or decrease compared with the prior month. Critical for trend tracking.
Team Revenue: Revenue generated by each rep or team. Useful for performance reviews and coaching.
Channel Contribution: The percentage of total revenue coming from each sales channel. Helps identify your strongest acquisition paths.
Product Line Performance: Revenue or unit totals by product category. Useful for merchandising and sales strategy.
Regional Performance: Sales output by territory or region. Helps managers spot location-based opportunities or risk.
Target Attainment: Actual sales versus quota or target. Essential for management reporting and forecasting.
A good monthly report keeps these KPIs visible in the top section, then supports them with breakdown tables and charts.
How to organize reporting by team, sales channel, product line, or region
The template should support multiple ways to view the same sales data. Most organizations need at least one of these reporting dimensions:
By team for manager-level accountability
By sales rep for performance tracking
By channel for marketing and route-to-market analysis
By product line for mix and profitability discussions
By region for territory planning
The smartest approach is to keep one clean raw data table and generate all summaries from it. Do not create separate manual tables for every stakeholder if the same dataset can feed them all. This reduces duplication and avoids reconciliation headaches at month-end.
When a monthly report works better than a daily or weekly view
Monthly reporting is best when leaders need a stable view of performance rather than noise from short-term fluctuations. It works especially well for:
Sales cycles longer than a few days
Teams measured against monthly quotas
Channel comparisons that require enough volume to be meaningful
Executive reviews focused on revenue trends, not daily activity spikes
A daily report is useful for frontline operations. A weekly report is useful for pipeline control. But when you need a management-ready summary of team, channel, and revenue performance, monthly is usually the right reporting cadence.
How to build a sales report template in Excel step by step
Building a dependable sales report template Excel workbook is less about fancy formatting and more about good structure. Start with the reporting logic first, then add formulas and visuals.
Define the sections of your report
Your monthly sales report should have four clear sections:
Summary KPI section for top-line performance
Team performance section for rep or team comparisons
Channel breakdown section for source-level insights
Revenue trend section for monthly movement over time
This structure helps different stakeholders find what they need without digging through a giant spreadsheet.
Automated calculations: totals, percentages, growth rates, rankings, and lookups
As a consultant, I recommend separating input cells from formula cells visually. Use one color for editable cells and another for protected formula areas. This small design choice reduces user error dramatically.
The raw data sheet is the engine of the template. If the data table is messy, every summary built on top of it will be unreliable.
Include columns such as:
Date
Sales Rep
Team
Channel
Product
Quantity
Revenue
Status
Depending on your business, you may also add:
Region
Customer name
Deal ID
Lead source
Target amount
Closed/won flag
Industry segment
Use Excel table formatting so the range expands automatically when new rows are added. That makes formulas, filters, and pivot tables easier to maintain.
Once the raw data is clean, use formulas to convert rows into insights. For a monthly report, your calculations should focus on totals, comparisons, and contribution analysis.
Useful formulas include:
SUM / SUMIFS for monthly revenue and units sold
COUNTIFS for won deals or closed transactions
AVERAGE / AVERAGEIFS for average deal size
XLOOKUP or VLOOKUP for pulling targets, team assignments, or product categories
IFERROR to prevent broken displays
Percentage change formulas for month-over-month comparisons
Examples of what to calculate:
Team total revenue
Team close rate
Channel share of total revenue
Current month vs previous month revenue
Product contribution to overall sales
Target attainment percentage
If you want a cleaner reporting model, store helper calculations in a separate sheet instead of embedding every formula directly in the dashboard view.
A report becomes a template only when it is easy to reuse next month without redesigning it.
To make your Excel workbook practical:
Add dropdown lists for channel, team, status, and product categories
Apply conditional formatting to flag low performance, negative growth, or missed targets
Lock formula cells to protect calculations
Freeze header rows for easier navigation
Use clearly labeled tabs such as Raw Data, Monthly Summary, Team View, and Charts
Leave a designated area for monthly comments or management notes
This is also the right time to create a polished front page or dashboard tab that stakeholders can review without touching the raw data.
How to track team, channel, and revenue performance clearly
The strongest sales report template Excel files do not overwhelm readers with raw numbers. They organize sales information into views that support action.
Build a team performance section
Your team performance area should allow managers to compare reps or teams on the metrics that actually drive accountability.
Include measures such as:
Sales volume
Revenue generated
Number of deals closed
Close rate
Average deal size
Target attainment
Use ranking or conditional formatting to highlight:
Top-performing teams
Reps consistently below target
High-volume but low-conversion performers
Strong closers with smaller average deal sizes
This section should help a sales leader answer: Who needs recognition, coaching, or territory adjustment?
Create a channel analysis view
Channel performance often reveals more than total revenue alone. A business may hit revenue goals while relying too heavily on one channel or underperforming in a strategic one.
Create a channel section that groups sales by categories such as:
Online
Retail
Direct
Partner
Distributor
Marketplace
Social
Referral
A pivot table is usually the fastest way to summarize this view in Excel. From there, you can add bar charts or percentage contribution visuals to show which channels are generating the most revenue and which ones are losing momentum.
The practical goal is simple: identify where to invest more, where to optimize, and where to stop guessing.
Monthly revenue trends should be visual, not buried in rows of numbers. A basic line or column chart can help management spot:
Seasonality
Growth patterns
Revenue dips
Rebound months
Momentum across quarters
Your trend summary should include:
Current month revenue
Prior month revenue
Month-over-month growth
Year-to-date revenue
Optional rolling 3-month average
A concise trend panel speeds up executive review and makes the template more useful in meetings.
Where to find examples, datasets, and free template ideas
Before building your final version, it is smart to test the structure with sample data and compare a few layout options. This saves time and exposes weaknesses in your design before the workbook reaches your team.
Use sample sales data before building your own report
Testing with sample sales data is one of the easiest ways to improve report quality. It lets you validate:
Formula accuracy
Pivot table design
Filter behavior
Chart readability
Monthly comparison logic
Use a dataset with enough variation across dates, teams, channels, and products to stress-test the template. If your workbook only works with perfect data, it is not ready for real business use.
Review free spreadsheet and report template collections
Looking at existing templates can help you decide whether your team needs:
A simple monthly tracker
A printable management summary
A dashboard-style report
A rep-level sales review sheet
A Google Sheets-friendly version for shared editing
When reviewing template libraries, focus less on visual style and more on logic. A visually attractive template with poor data structure quickly becomes hard to maintain.
Learn from specialized sales report downloads
Specialized sales report examples are useful because they show how different businesses report differently. A retail report may emphasize units sold and store performance. A B2B team may care more about deal size, win rate, and target attainment. A partner-driven model may prioritize channel contribution and territory results.
Reviewing these examples helps you decide which fields belong in your own monthly report and which ones add noise.
Common mistakes to avoid when creating a monthly sales report
Most Excel sales reports fail for structural reasons, not technical ones. Avoid these common mistakes:
Mixing raw data and summary calculations in the same area
This makes updates risky and increases the chance of accidental edits.
Tracking too many metrics without a clear business purpose
If a number does not support a decision, it probably does not belong on the front page.
Using inconsistent channel or team names
Small naming differences break filters, pivot tables, and formulas fast.
Forgetting to design for repeat monthly updates
A report that works once but requires rework every month is not a template.
Overusing manual calculations
The more manual steps involved, the more likely the report becomes late or inaccurate.
Building charts before confirming KPI logic
Visuals should come after the metric definitions are stable.
The best monthly report templates are boring in the right ways: structured, repeatable, and hard to break.
How to keep your Excel sales report useful over time
A sales report template should evolve with the business. Teams change, channels expand, product lines shift, and management priorities move. If the workbook never gets reviewed, it eventually becomes outdated and ignored.
To keep it useful:
Review the template quarterly
Confirm the KPIs, dimensions, and targets still match how the business operates.
Standardize data entry rules
Use dropdowns, naming rules, and data validation so month-to-month reporting stays consistent.
Separate raw data, calculations, and presentation layers
This makes the workbook easier to troubleshoot and scale.
Plan for dashboard growth
Start with a simple tracker, but leave room for charts, slicers, and management summaries.
Document the logic
Add a short instruction tab so new users understand what to enter and what not to change.
These habits extend the life of your sales report template Excel file and reduce reporting friction over time.
Building this manually gets complex—use FineReport to automate the workflow
Excel is a strong starting point for monthly sales tracking, especially for smaller teams or early-stage reporting processes. But as reporting expands across teams, channels, regions, and leadership audiences, manual workbook maintenance becomes difficult. Version control breaks down. Formula errors creep in. Refresh cycles slow down. Stakeholders start questioning whether the numbers are current.
That is where FineReport becomes the practical next step.
Building this manually is complex; use FineReport to utilize ready-made templates and automate this entire workflow. Instead of stitching together raw data tables, formulas, pivot summaries, and dashboard views by hand each month, teams can centralize reporting logic, standardize KPI definitions, and generate interactive sales dashboards faster.
Build role-specific views for managers and executives
Reduce spreadsheet maintenance and manual errors
Scale from basic reporting to enterprise-grade dashboards
If you are currently using Excel as a stopgap, FineReport helps you move from manual reporting to a more reliable and decision-ready model without rebuilding your process from scratch.
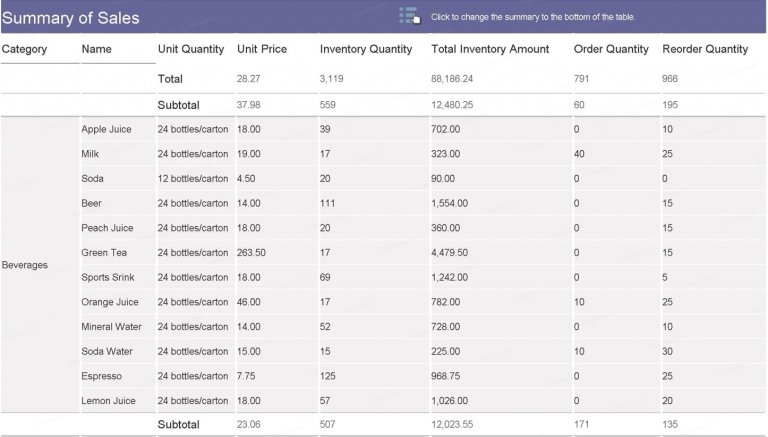
It should include top-level KPIs such as total revenue, units sold, average deal size, conversion rate, month-over-month change, and target attainment. It should also break results down by team, channel, product line, or region for faster analysis.
Start with one clean raw data table and build all summaries from that source using formulas, PivotTables, or charts. Keep manual inputs like targets separate from calculated fields so monthly updates are faster and less error-prone.
A monthly report is better for tracking stable performance trends, quota progress, and channel contribution without short-term noise. It is especially useful for management reviews and longer sales cycles.
OLE
Use consistent columns for sales rep, team, channel, date, and revenue in your raw data sheet. Then create summary tables or PivotTables that let you filter and compare performance across both dimensions.
Common issues include messy source data, inconsistent channel names, duplicate manual summary tables, and formulas mixed with input cells. These problems make reports harder to trust and slower to maintain.
Product Trial
FineReport
Pixel-perfect reports · Interactive dashboards · Easy data entry · Digital twins