A store performance dashboard is a digital tool that brings together your key business data in one place. You can track sales, inventory, and customer activity in real time. This dashboard helps you see how your shop performs each day.
Many retailers find it hard to manage scattered data and manual reports. In fact, 73% of retailers say these challenges slow down their store management. You need quick, reliable insights to stay ahead. Modern tools like FineBI make this possible by turning complex data into clear, actionable information. With a store dashboard, you can transform the way you manage your retail business.
What is a Store Dashboard
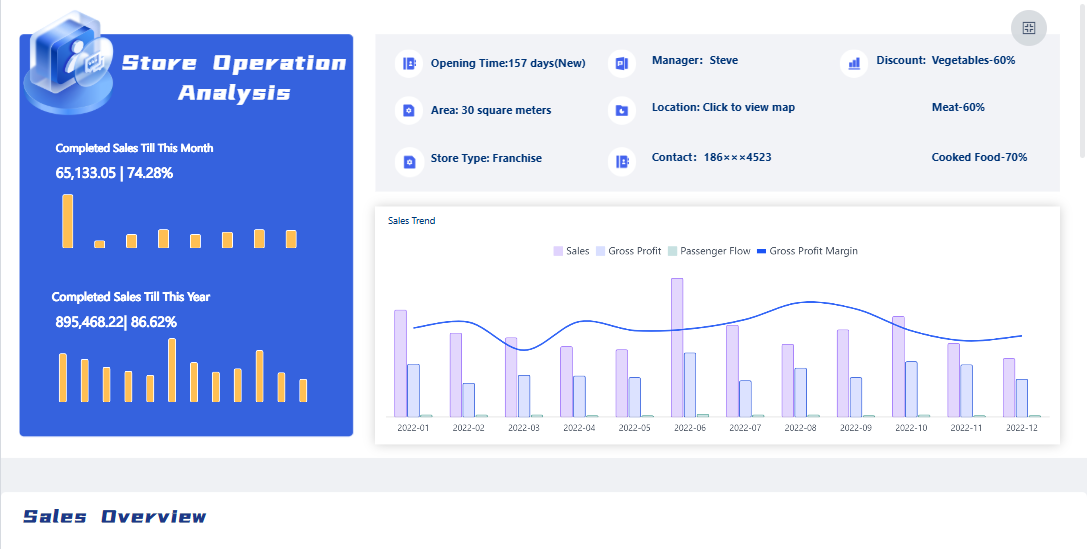
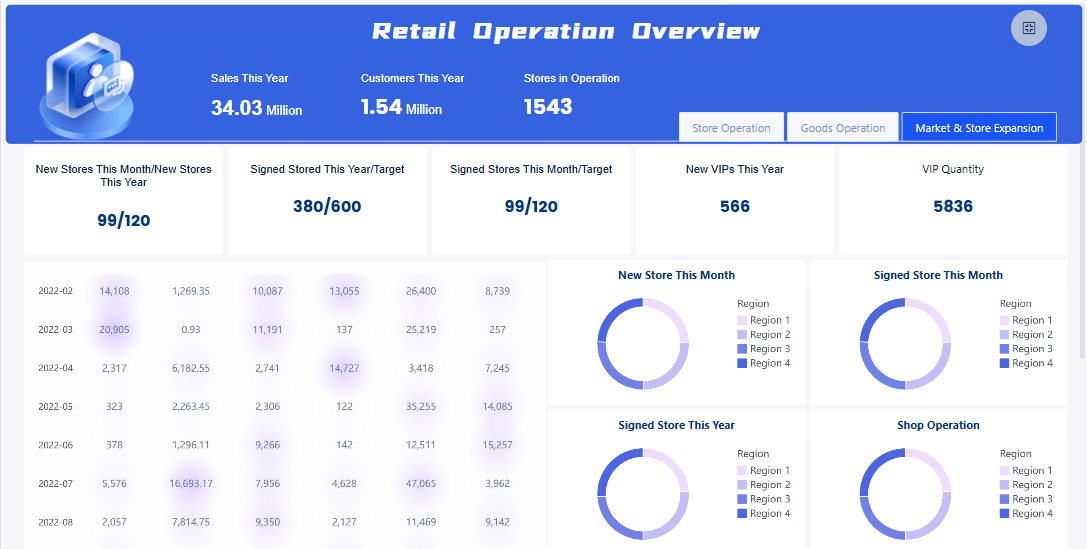
A store performance dashboard acts as your command center for retail management. You use it to see all your important business data in one place. The store performance dashboard gives you a visual interface that consolidates real-time insights into your store’s performance. You can monitor sales, stock levels, and customer satisfaction with ease. The store performance dashboard helps you make quick decisions and respond to changes in your shop.
Core Features and Metrics
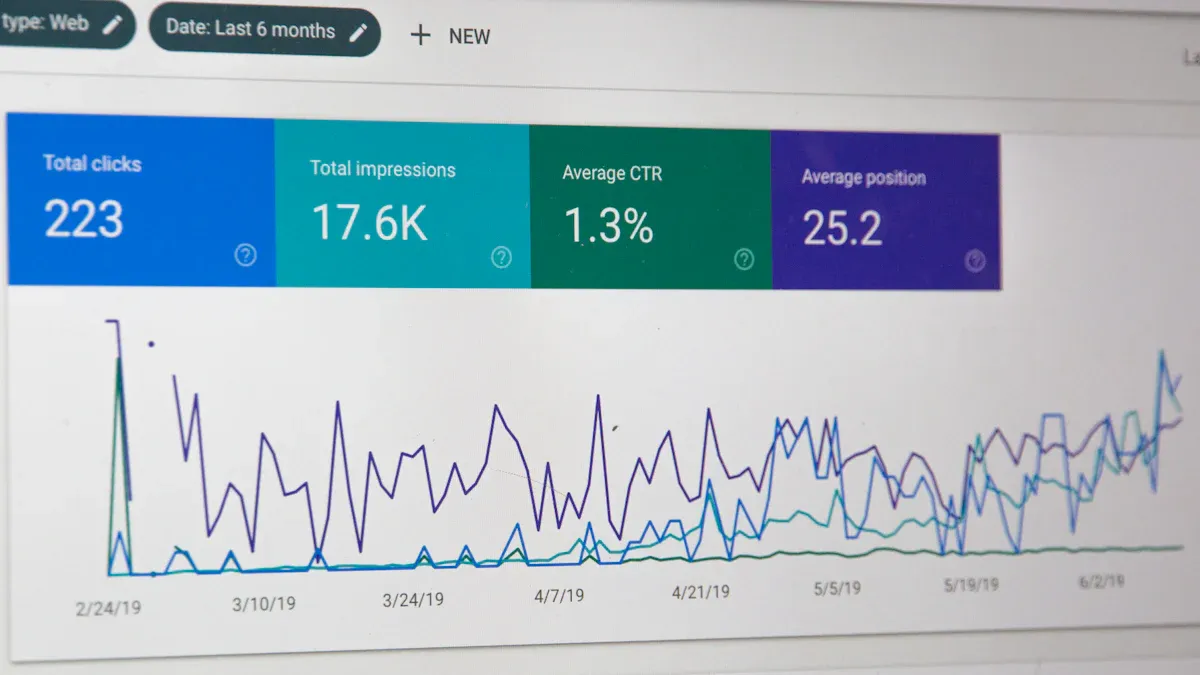
The store performance dashboard tracks essential metrics that show how your store operates. You can measure average wait time, service time per customer, and customer satisfaction score. These metrics help you understand how well your team serves customers and how happy they feel after shopping. You also see sales numbers, inventory levels, and traffic trends. The store performance dashboard displays these metrics in clear charts and tables, making it easy for you to spot problems or successes.
- Average Wait Time
- Service Time per Customer
- Customer Satisfaction Score (CSAT)
- Sales Volume
- Inventory Turnover
- Store Traffic
You rely on these metrics to improve your store’s performance every day. The store performance dashboard updates these metrics in real time, so you always have the latest information.
How it Works in Retail
The store performance dashboard connects with your existing retail systems. You get live data from your POS, ERP, and customer loyalty platforms. The dashboard uses API connections to unify all your systems for real-time reporting and analytics. You see data from sales, inventory, and customer feedback without delays. Automation features in the store performance dashboard sync your inventory and financial reports with platforms like NetSuite and Oracle.
| Feature | Description |
|---|---|
| API Connections | Simplified API connections unify various systems for real-time reporting. |
| Data Unification | Connects POS systems with ERP and loyalty tools for better decision-making. |
| Live Data Access | Provides access to live sales, inventory, and customer data without delays. |
| Automation | Automates inventory and financial reporting by syncing with other platforms. |
The store performance dashboard stands apart from traditional reporting tools. You get real-time or near real-time data refresh, visual and interactive formats, and high user interaction. You access the dashboard on web or cloud platforms, making it easy to use anywhere.
| Feature | Dashboards | Traditional Reports |
|---|---|---|
| Data Refresh | Real-time or near real-time | Static / Scheduled |
| Format | Visual, Interactive | Tabular, Narrative |
| Use Case | Monitoring, Alerts | Documentation, Auditing |
| Accessibility | Web-based, Cloud-enabled | PDF, Excel, Printed |
| User Interaction | High | Low |
The store performance dashboard gives you the tools to monitor, analyze, and improve your shop’s results. You see all your metrics in one place and act on insights faster.
Why Every Shop Needs a Store Dashboard
A store performance dashboard solves many of the biggest challenges you face in retail. You often deal with data silos, outdated information, and manual reporting. These issues slow down your ability to make smart choices and respond quickly to changes in your shop. When you use a store dashboard, you bring all your important data together. You see a clear picture of your business and can act with confidence.
Better Decisions With Real-time Data
You need to make decisions based on facts, not guesses. A store performance dashboard gives you real-time access to your most important metrics. You can track sales, inventory, and customer feedback as they happen. This helps you spot trends, respond to problems, and take advantage of new opportunities right away.
- Real-time dashboards show you key performance areas like sales and customer engagement.
- You can monitor live metrics instead of waiting for old reports.
- Quick responses to challenges and opportunities become possible.
- Teams across your shop align around shared goals and collaborate more effectively.
A store dashboard lets you see what is happening in your shop right now. You can watch sales numbers, check inventory levels, and review customer satisfaction scores. This live view supports data-driven decisions. You do not have to wait for someone to send you a report. You act on the latest information and stay ahead of the competition.
| Challenge | Description |
|---|---|
| Fragmented Customer Views | Lack of a unified view leads to unreliable projections and poor customer experiences. |
| Inconsistent Product Information | Product details become inconsistent across channels due to data residing in multiple sources. |
| Inefficient Inventory Management | Disjointed data results in stock inaccuracies, overstocking, and stockouts, complicating order fulfillment. |
| Integration Challenges | Complexities arise in consolidating data from various platforms, hindering operational efficiency. |
| Delayed Data Delivery | Manual reporting processes slow down access to current data, affecting decision-making and agility. |
You can see how a store performance dashboard addresses these challenges. It unifies your data, keeps your product information consistent, and helps you manage inventory more efficiently. You do not waste time searching for information or fixing errors caused by manual processes.
A sales performance dashboard also reduces the time you spend on manual reporting. Automation checks your data for accuracy and updates your dashboards without extra work. You and your team can focus on finding insights and making improvements, not just collecting numbers.
- Automated validation ensures your data is clean and accurate.
- End-to-end automation saves time and lets your technical teams focus on analysis.
- Non-technical staff can access dashboards and reports directly, without waiting for IT support.
With a store performance dashboard, you move from slow, manual reporting to fast, automated insights. You make better decisions and improve your shop’s results.
Daily Operations and Growth
A store dashboard does more than help you make decisions. It supports your daily operations and long-term growth. You can monitor employee productivity, track sales trends, and respond to customer feedback in real time. This keeps your shop running smoothly and helps you grow over time.
| Aspect | Contribution to Efficiency and Growth |
|---|---|
| Immediate Issue Detection | Enables real-time monitoring of stock and employee productivity, allowing for quick responses to issues and preventing lost sales. |
| Enhanced Decision-Making | Provides access to the latest sales trends and customer behaviors, facilitating informed and timely decisions. |
| Improved Customer Experience | Allows for personalized engagement and swift responses to customer feedback, enhancing overall satisfaction and loyalty. |
A store performance dashboard gives you the tools to detect problems before they become serious. You can see if stock is running low or if sales are dropping in a certain area. You respond quickly and prevent lost sales. You also improve customer experience by acting on feedback right away.
A sales performance dashboard helps you track the metrics that matter most for growth. You can see which products sell best, which promotions work, and how customer behavior changes over time. This information supports data-driven decisions that lead to higher sales and better customer loyalty.
When you use a store dashboard, you set your shop up for success. You run daily operations more efficiently and build a foundation for long-term growth. You do not just react to problems—you plan for the future with confidence.
After you understand the value of a store performance dashboard, you can look for the right tool to bring all these benefits to your shop. FineBI stands out as a solution that unifies your data and delivers actionable insights for every type of store.
Key Features of an Effective Store Dashboard
Must-have Functions
When you choose a store performance dashboard, you want features that help you manage your shop with confidence. The right dashboard brings together all your important data and presents it in a way that is easy to understand. You can track key performance indicators, monitor sales and revenue metrics, and keep an eye on inventory levels. A strong store performance dashboard should include these essential functions:
- Customer reports that show you how shoppers behave and what they buy.
- Shrinkage reports to help you spot inventory loss from spoilage or theft.
- Low-stock alerts that prevent missed sales due to empty shelves.
- Product performance reports that highlight your best and worst sellers.
- Basket analysis to reveal customer purchasing habits.
- Sales by department, category, and employee for a clear view of revenue.
- Vendor performance reports to evaluate supplier reliability.
- Peak sales time analysis to optimize staffing.
- Seasonal sales analysis for adapting to changing trends.
- Compliance reports to ensure you meet legal requirements.
You need a store performance dashboard that can handle integration with many data sources. This helps you avoid problems like data fragmentation and incomplete information. Real-time updates keep your metrics current, so you always know what is happening in your shop. Visualization tools turn complex numbers into clear charts and graphs. Access control features protect your sensitive data and let you decide who can see what.
Tip: Look for a dashboard that makes it easy to visualize key performance indicators and analyze sales patterns. This will help you manage inventory and make better decisions every day.
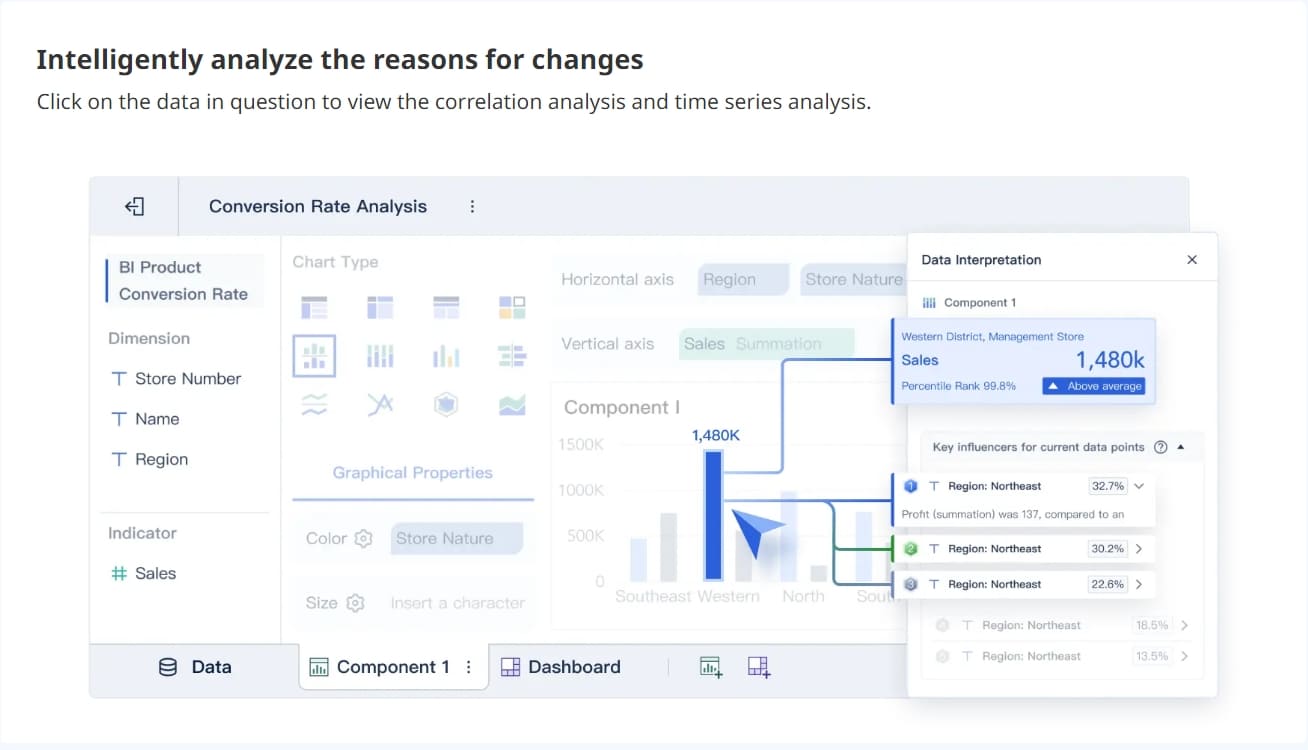
Actionable Insights With FineBI
FineBI gives you the tools to get the most out of your store performance dashboard. You can connect to over 30 types of data sources, including big data platforms and Excel files. FineBI offers a wide range of visualization options, so you can create charts and reports that fit your needs. The dashboard merges all your analytic data into unified reports with layouts you can customize.
| Feature | Description |
|---|---|
| Data Source Integration | Connects with big data platforms, SQL data sources, and Excel datasets. |
| Data Visualization | Offers many visual analysis options with different charts and mapping. |
| Dashboard Functionality | Combines analytic data into unified reports with flexible layouts and themes. |
| Real-time Updates | Uses advanced technology for high data availability and quick recovery. |
FineBI supports real-time insights, so you can make decisions based on the latest information. You can identify areas for improvement and enhance efficiency by focusing on the right metrics. The dashboard helps you support strategic decisions, such as resource allocation and marketing plans.
FineBI also makes it easy for non-technical staff to use the store performance dashboard. You can access and analyze data without coding skills. The drag-and-drop interface and natural language queries let you find answers quickly. Mobile access and collaboration features mean your team can work together from anywhere, updating progress and sharing insights in real time.
Security is a top priority. FineBI uses encryption, device monitoring, and strict access controls to protect your data. You can set permissions for different users and review access logs to keep your information safe.
A store performance dashboard with these features will help you track metrics, improve operations, and grow your business with confidence.
Real-world Impact and Success Stories with Store Dashboard
Retail Scenarios and Outcomes
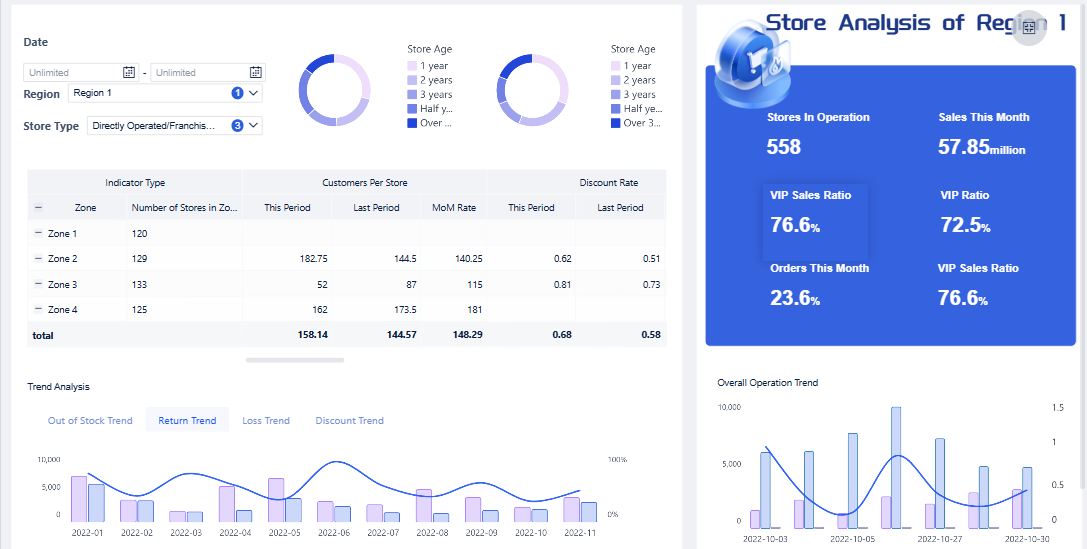
You see the difference a store performance dashboard makes when you look at real retail operations. Many shops use dashboards to track sales, manage inventory, and improve customer engagement. You can identify high-performing sales regions and measure the success of promotions. With an inventory management dashboard, you keep stock levels in check and avoid running out of popular products. You also spot slow-moving items and adjust your orders to match demand.
- You monitor sales KPIs and quickly see which products sell best.
- You use dashboards to compare store performance across locations.
- You analyze promotional campaigns and adjust strategies for better results.
- You rely on an inventory management dashboard to maintain product availability and prevent shortages.
A store performance dashboard helps you make strategic decisions and improves communication between teams. You respond faster to changes in sales trends and customer preferences.
The dashboard also supports customer engagement. You track shopping habits and personalize promotions. You find new market opportunities and enhance the customer experience. You optimize inventory to meet real-time demand and maximize sales.
| Benefit | Description |
|---|---|
| Analyzes Customer Preferences | Tracks top-selling products and customer shopping trends, helping personalize promotions. |
| Drives Retail Business Growth | Identifies new market opportunities and monitors store performance to enhance customer experience. |
| Improves Inventory Optimization | Maintains ideal inventory levels to prevent shortages and maximize sales based on real-time demand. |
Case Study: BOE and FineBI
You can see the power of a store performance dashboard in action at BOE Technology Group. BOE faced challenges with fragmented data and inconsistent metrics. The company needed a way to unify information and improve operational efficiency. BOE chose FineBI to build a comprehensive dashboard solution.
FineBI helped BOE integrate data from multiple sources and standardize key metrics. The dashboard provided real-time insights into inventory, sales, and operations. BOE reduced inventory costs by 5% and increased operational efficiency by 50%. The dashboard enabled data-driven decisions and supported cross-factory benchmarking.
You learn from BOE’s experience that a store performance dashboard can transform your business. You gain a unified view of your data, improve accuracy, and make smarter decisions. FineBI gives you the tools to monitor KPIs, optimize inventory, and drive growth in your shop.
A store performance dashboard gives you clear visibility into your shop’s data and helps you optimize daily operations. You track sales, monitor KPIs, and improve customer satisfaction with centralized data.
| Reason | Description |
|---|---|
| Increased visibility | Access data from multiple locations for better decisions. |
| Optimization of operations | Centralized data streamlines inventory and demand planning. |
| Enhanced customer satisfaction | Quick access to information improves problem-solving and customer experience. |
You see future trends like AI-powered analytics, automated alerts, and personalized dashboards. Start with FineBI to simplify your data journey and drive your shop’s digital transformation.

Continue Reading About Store Dashboard
Best Dashboard Apps for Business Insights
What is a Call Center Dashboard and Why Does It Matter
What is a Reporting Dashboard and How Does it Work
What is An Interactive Dashboard and How Does It Work
What is a Call Center Metrics Dashboard and How Does It Work


FAQ

The Author
Lewis
Senior Data Analyst at FanRuan
Related Articles

How to Build an Investment Portfolio Reporting Dashboard for Executives: KPIs, Benchmarks, and Drill-Down Views
Investment portfolio reporting for executives is not about showing every holding, transaction, and chart your investment team can produce. It is about giving CEOs, CFOs, CIOs, boards, and investment committees a fast, re
Yida YIn
Jun 25, 2026

12 KPI Reporting Examples for Executive Dashboards: What to Show in Weekly, Monthly, and Quarterly Reviews
Executive leaders do not need more data. They need decision ready $1 examples that match how often they review the business and what actions they are expected to take. A weekly $1 should surface fast moving risks and per
Yida YIn
Jun 25, 2026

How to Build a Digital Marketing Reports Dashboard: Executive Examples, KPIs, and Templates
A $1 is the control layer that helps executives and marketing leaders turn scattered channel data into fast, confident decisions. If you are a CEO, CMO, operations director, or marketing analytics lead, the real problem
Yida Yin
May 07, 2026