You can start with data standardization by organizing your numbers, calculating the average, and applying a simple formula. Data standardization helps you compare information easily and makes your results more accurate. If you wonder how to standardize data, you will find the process much easier than it sounds. With the right tools, like FineDataLink, standardization feels simple and achievable.

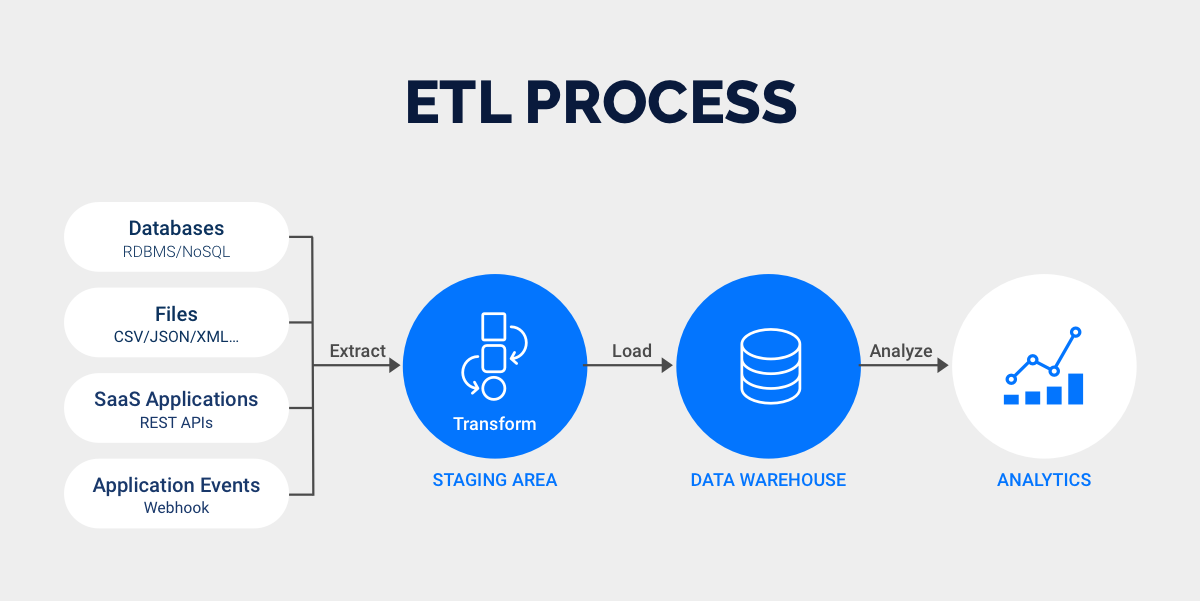
You might wonder what data standardization really means. In simple terms, data standardization is a process in data preprocessing where you convert your data into a uniform format. This step helps you achieve consistency across different datasets, making your analysis much clearer. You often use z-scores for this. Z-scores show how far a value is from the average, measured in standard deviations. This method helps you compare numbers even if they come from different sources or scales.
Here’s a quick look at how experts define data standardization:
| Definition | Description |
|---|---|
| Data Standardization in Computer Science | Establishing reference standards for organizing and exchanging clinical data, ensuring accurate measurement and communication in healthcare. |
| Data Preprocessing in Analytics | Converting data into a uniform format to ensure consistency across datasets, enhancing clarity and quality for analysis. |
| Mapping Source Data | Parsing and rearranging components of data (e.g., customer names) into a canonical representation for better manipulation by data services. |
You can also use min-max scaling, but z-scores are more common when you want to handle outliers or compare features with different units.
You need data standardization for several reasons. First, it transforms your data so that each feature has a mean of 0 and a standard deviation of 1. This step ensures consistency and makes your results more reliable. Standardization improves accuracy for models like PCA, KNN, and SVM. If you skip this step, poorly scaled features can bias your models or slow down algorithms like gradient descent. Consistency in your data also makes it easier to interpret feature importance, especially in regression.
Here are some key reasons to use data standardization:
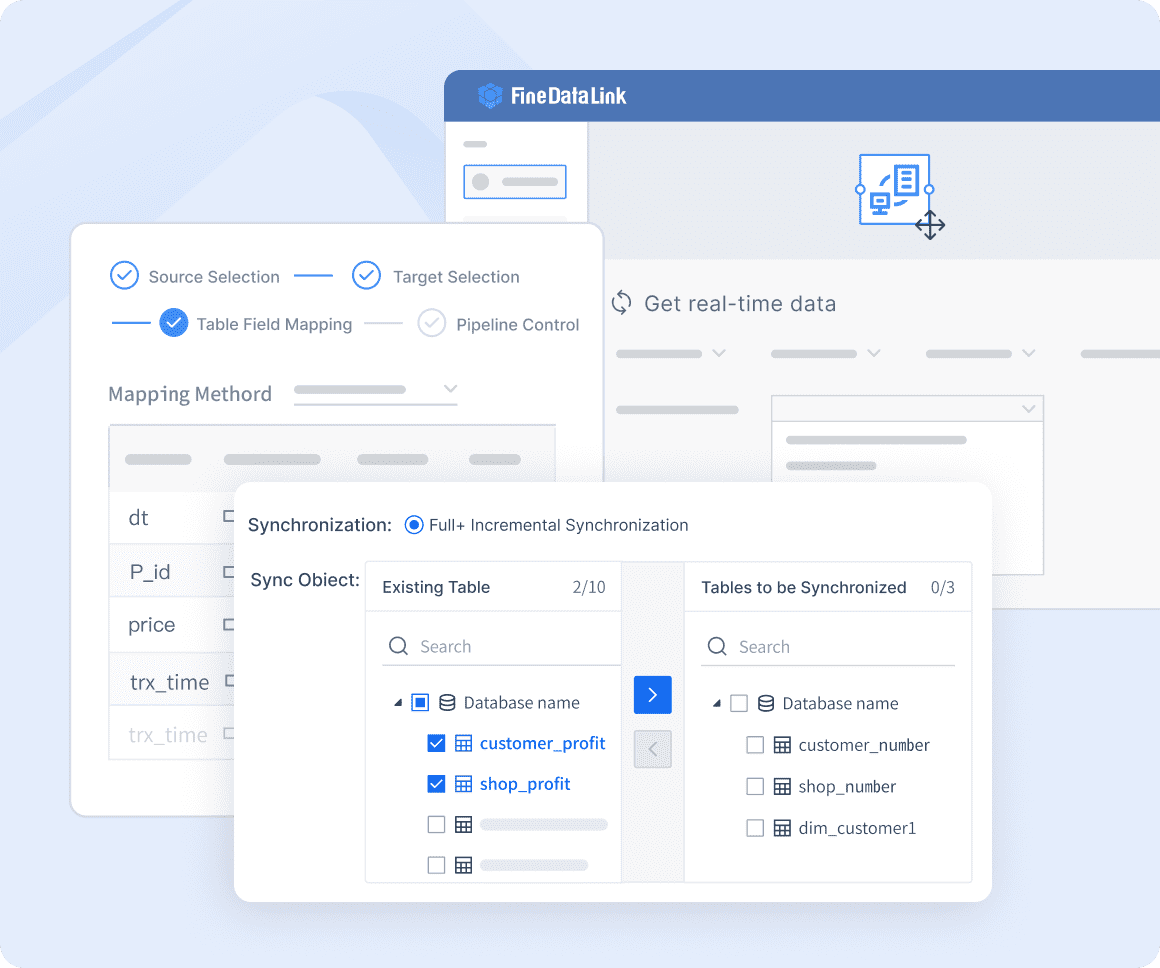
When you work with large or complex datasets, you might face data silos or integration issues. FineDataLink helps you solve these challenges. It connects different data sources quickly, supports real-time data synchronization, and offers flexible ETL options. With FineDataLink, you can build a consistent and high-quality data layer for business intelligence, making your standardization process much smoother.
Learning how to standardize data can feel overwhelming at first, but you can break it down into simple steps. This section will walk you through the process, so you can confidently create standardized data for your analysis. Let’s use a small example to make things clear.
Suppose you have a list of test scores: 70, 80, 90, 100, and 110. Here’s how to standardize data step by step:
Start by gathering all your raw data in one place. Make sure your data is:
You should map out where your data comes from. Use a data dictionary to track entry points and common input formats. Clean your data by checking for inconsistencies and correcting them. Consistent formatting helps you avoid standardization issues and other data-related problems. If you use Excel, you can import your data and let AI features suggest corrections or use Flash Fill to format your data quickly.
Now, calculate the mean (average) and standard deviation for your dataset. The mean tells you the central value, while the standard deviation shows how spread out your numbers are.
You can use different tools for this step. Here’s a quick comparison:
| Tool | Description |
|---|---|
| Excel | Built-in functions make it easy to calculate mean and standard deviation. |
| KNIME | Offers nodes for computing these values, with customization for your needs. |
| Python | Flexible and scalable, great for large datasets and automation. |
In Excel, use the AVERAGE and STDEV.P functions. In Python, libraries like pandas and numpy make these calculations simple. Python is especially helpful if you want to automate the process or handle large datasets, since it reduces manual effort and minimizes errors.
Once you have the mean and standard deviation, you can apply the standardization formula to each data point. The formula is:
z = (x - μ) / σ
Where:
x is your original value,μ is the mean,σ is the standard deviation.Let’s use our example scores. If the mean is 90 and the standard deviation is 15.81, the standardized value for 100 would be:
z = (100 - 90) / 15.81 ≈ 0.63
Repeat this for each value in your dataset. This process transforms your data so that it has a mean of 0 and a standard deviation of 1. Now, your standardized data is ready for analysis.
After you standardize data, review your results to make sure everything looks right. Here are some best practices:
If you use Excel, you can automate many of these checks with built-in validation rules. Python scripts can also help you spot errors and keep your standardized data accurate.
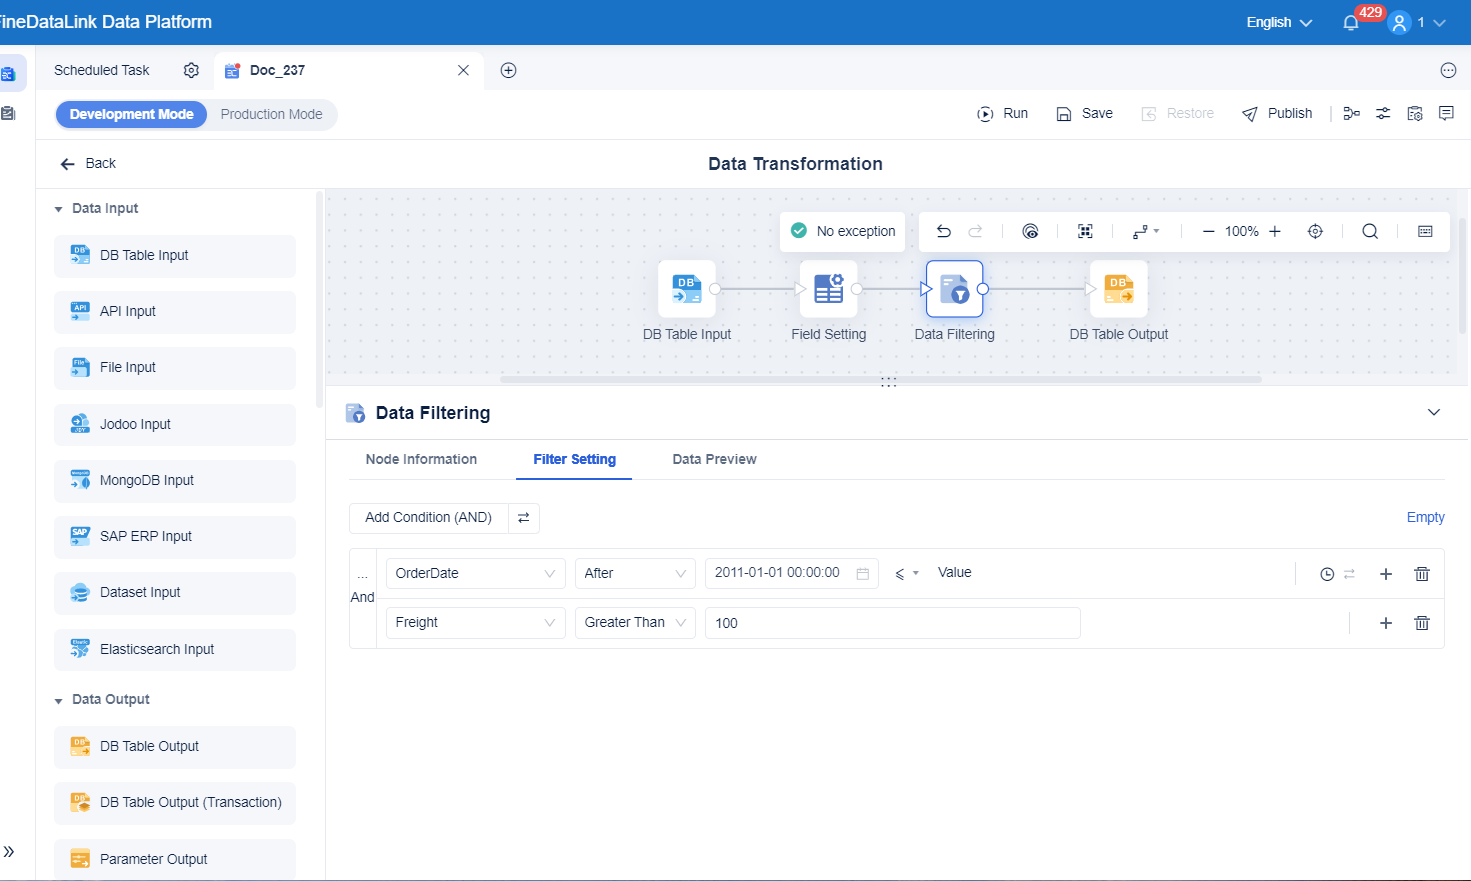
Tip: Automating these steps saves time and reduces mistakes. Excel’s AI features, like Flash Fill, can predict and complete formatting tasks. Python offers powerful libraries for cleaning and standardizing data. If you want to handle real-time data integration or need advanced ETL/ELT workflows, FineDataLink provides a low-code platform with drag-and-drop tools. It connects to over 100 data sources and helps you build a high-quality data layer for business intelligence. FineDataLink makes it easy to standardize data across multiple systems, so you can focus on analysis instead of manual work.
Now you know how to standardize data from start to finish. With these steps, you can create reliable, standardized data for any project. Whether you use Excel, Python, or a platform like FineDataLink, you have the tools to make standardization simple and effective.
When you look at popular formulas to standardize data, you will often see z-scores and min-max scaling. Z-scores transform your data so it has a mean of 0 and a standard deviation of 1. This method works well when your data follows a normal distribution or when you want to reduce the impact of outliers. Min-max scaling, on the other hand, rescales your data to fit within a specific range, usually 0 to 1. You might use min-max scaling when you need all your features on the same scale, but it can be sensitive to outliers. In clustering or principal component analysis, standardization with z-scores is usually the better choice because it focuses on variance and is less affected by extreme values.
You might wonder about normalization vs. data standardization. Both methods help you prepare your data for analysis, but they work differently. Standardization changes your data so it has a mean of 0 and a standard deviation of 1. Normalizing data, however, scales everything to a set range, like 0 to 1. You should use standardization when your data looks like a bell curve. Normalizing data works best when you do not know the distribution or want to keep all values between 0 and 1. Here is a quick comparison:
| Method | Output Range | Distribution Focus |
|---|---|---|
| Standardization | No fixed | Mean = 0, SD = 1 |
| Normalization | 0 to 1 | Any distribution |
When you use data standardization, you can run into some common mistakes. Here are a few to watch out for:
You should always check your data for errors, use clear rules for formatting, and avoid shortcuts that make future changes harder. For example, make sure first names are capitalized, phone numbers follow one format, and emails use the correct structure. Consistency is key in data standardization.
If you want to automate data standardization, FineDataLink can help. This platform brings together data from many sources and keeps everything consistent. FineDataLink automates data synchronization, so your reports always show the latest information. You can transform your data as you integrate it, making sure it is ready for analysis. FineDataLink also supports advanced data quality management, like profiling, cleansing, and de-duplication. With these features, you can trust your data standardization process and focus on getting insights from your data.
You just learned how standardization improves your data quality and makes analysis easier. Here’s a quick look at the benefits:
| Benefit | Explanation |
|---|---|
| Improved Data Quality | Fewer errors and more reliable results |
| Better Decisions | Consistent data leads to smarter choices |
Try these steps yourself. FineDataLink can automate standardization, so you can focus on building your data confidence.
Enterprise Data Integration: A Comprehensive Guide
What is enterprise data and why does it matter for organizations
Understanding Enterprise Data Centers in 2025
Enterprise Data Analytics Explained for Modern Businesses

The Author
Howard
Engineer Data Management & Ahli Data Research Di FanRuan
Related Articles

11 Best Data Management Tool Options Compared in 2026: Features, Pros, Cons & Use Cases
Compare the best data management tools for 2026. Review features, pros, cons, and ideal use cases for platforms like FineBI, Microsoft Purview, and Talend.
Lewis Chou
Apr 26, 2026

7 Best Data Governance Platforms Compared: Pros, Cons, and Which Teams They Fit Best
A data governance platform is software that helps organizations define, manage, monitor, and enforce how data is cataloged, accessed, trusted, and used across the business. 7 best data governance platforms compared at a
Howard Chu
Apr 20, 2026
What is a data management platform in 2025
A data management platform in 2025 centralizes, organizes, and activates business data, enabling smarter decisions and real-time insights across industries.
Howard
Dec 22, 2025


