Enterprise data analytics lets you change raw information into useful ideas. These ideas help your business do well. Today, most companies think data is important for smart choices. You can see this in the numbers:
81% of businesses think data should help with decisions.
More than 90% say analytics give real results.
Companies using these tools often work much better.
But many organizations like yours have problems. Data silos, slow access, and bad data can make things hard. FanRuan has solutions like FineReport and FineBI. These tools help you get past these problems. Is your business ready to use its data well?
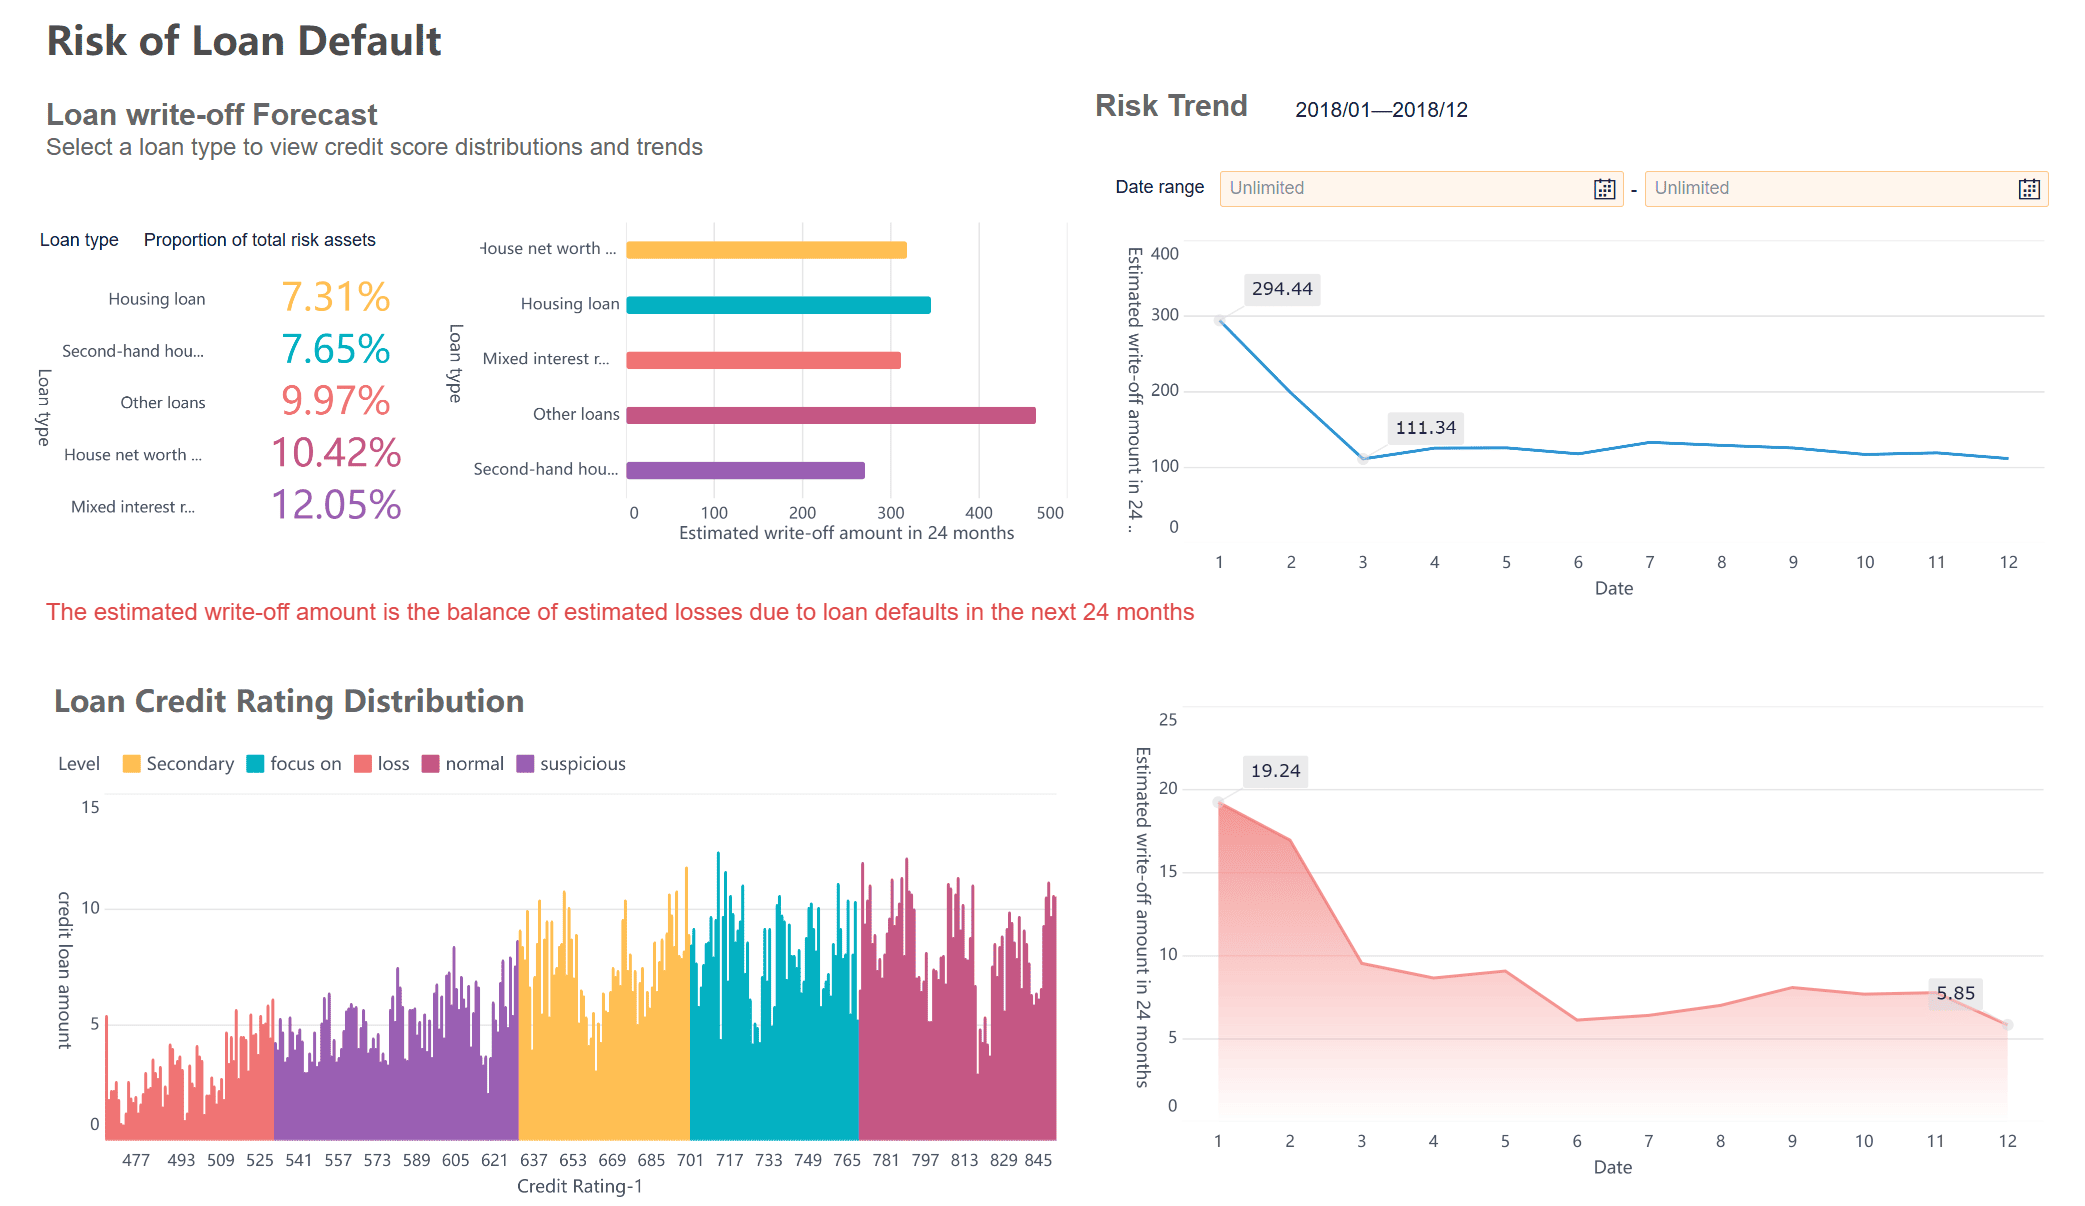
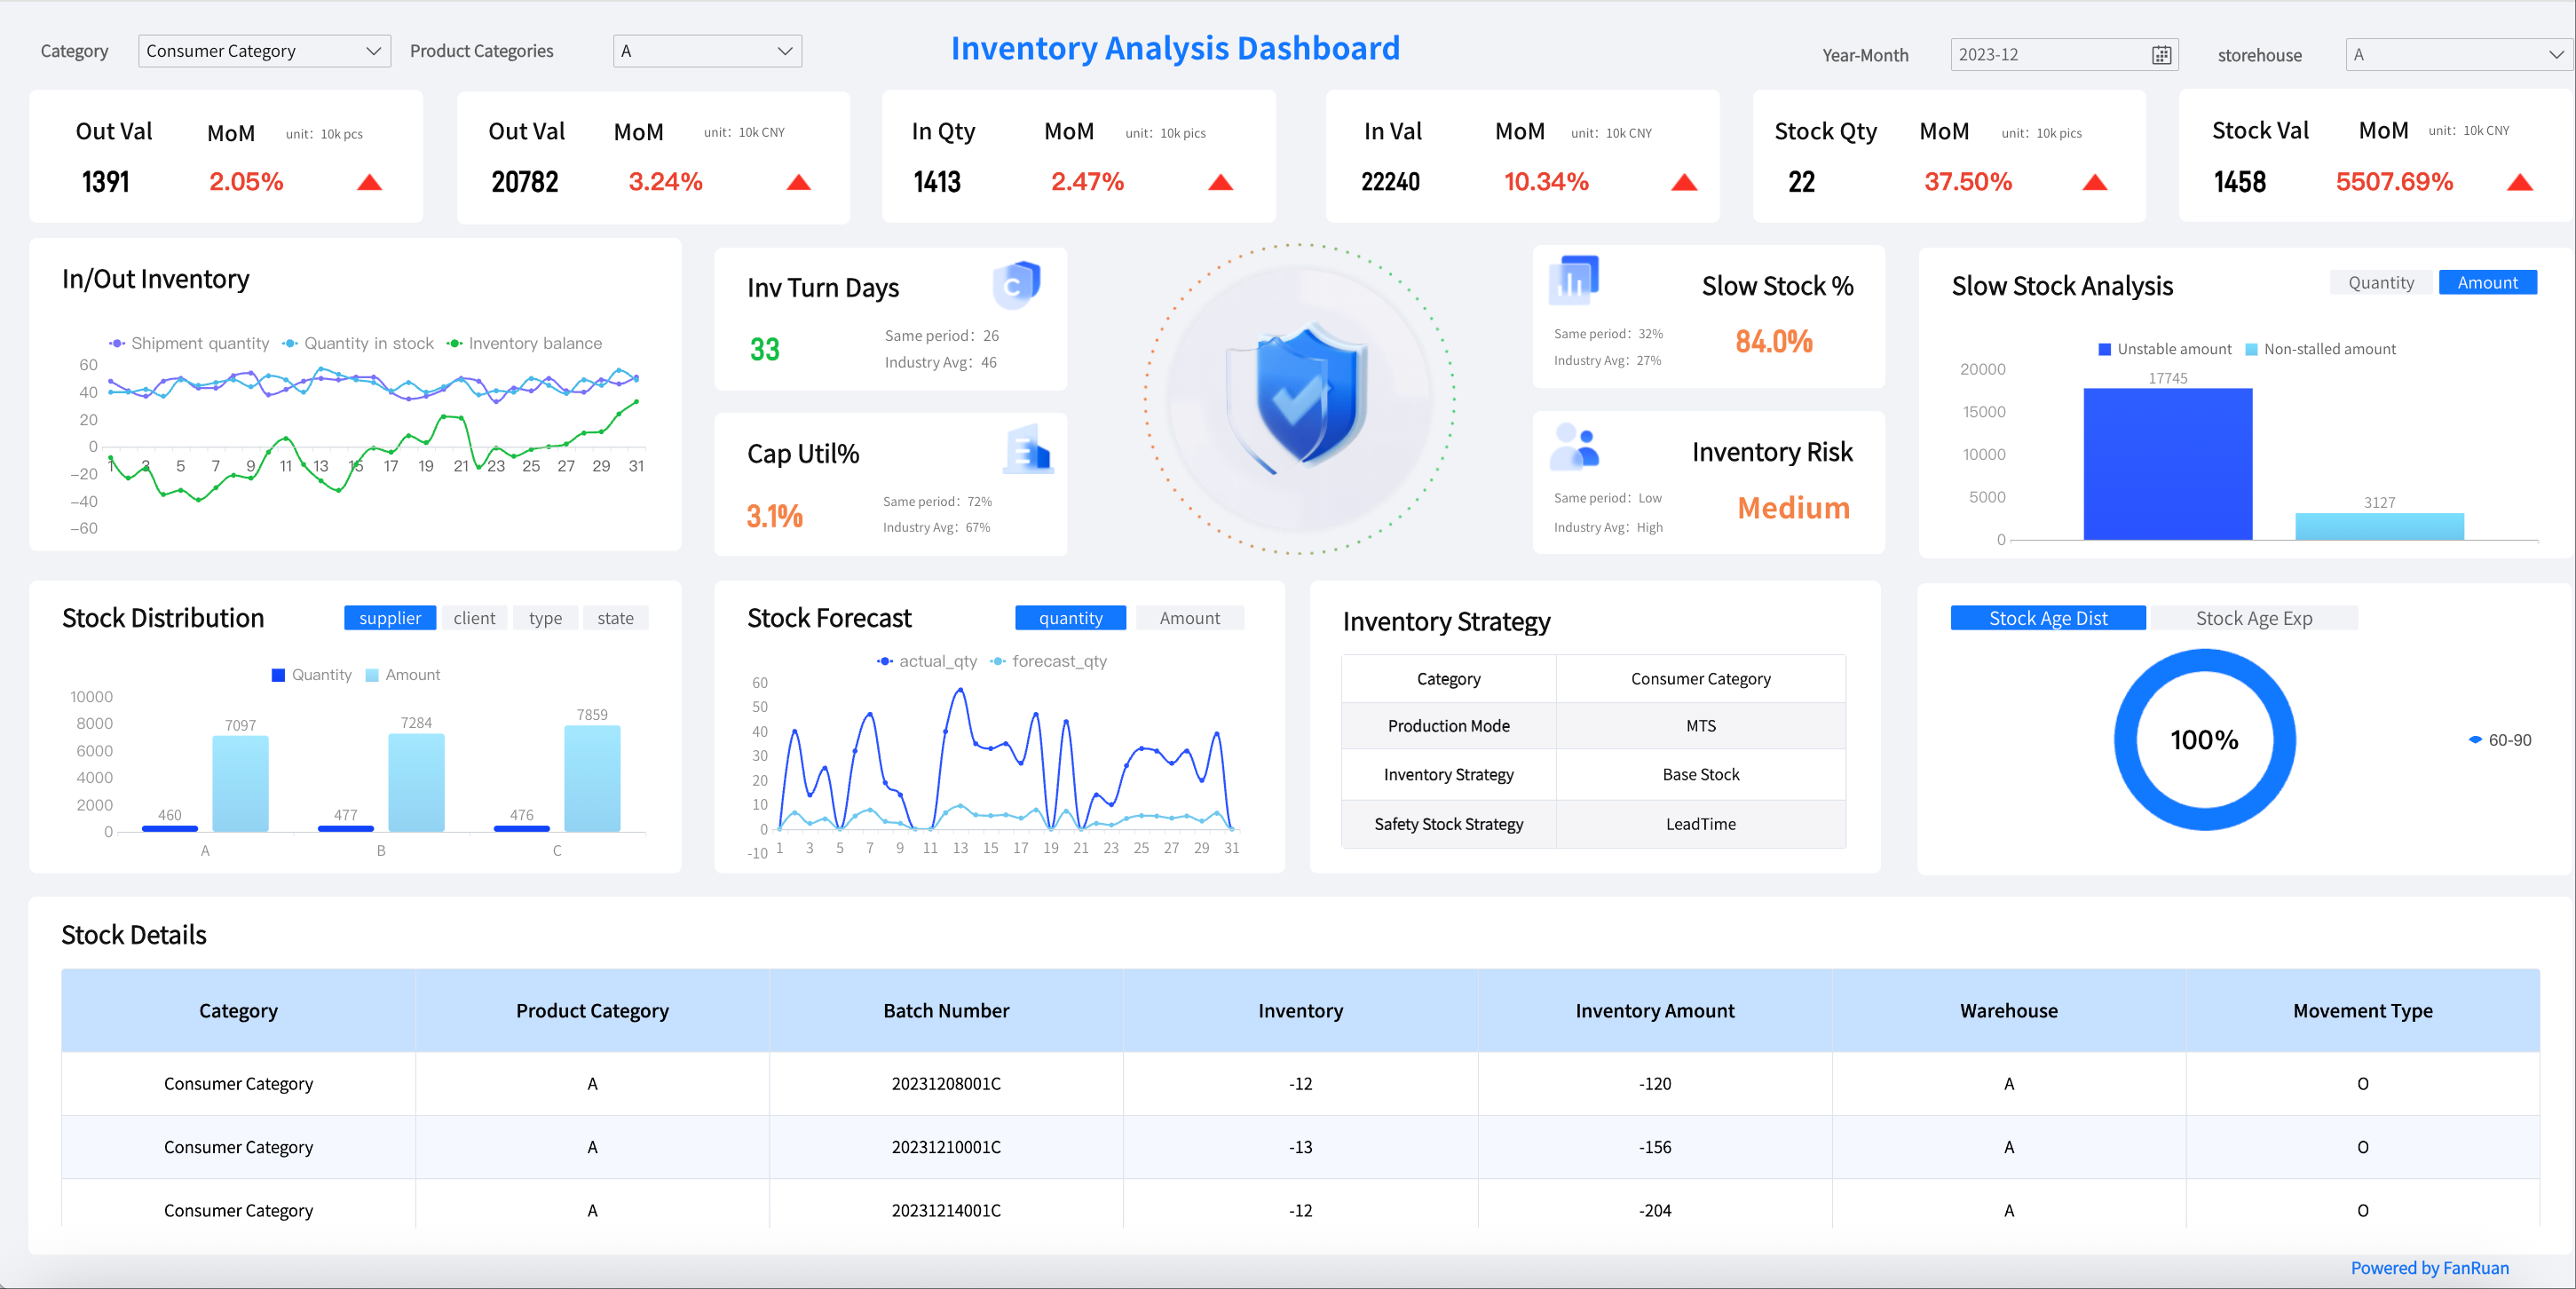
Enterprise data dashboard created by FineBI (click to engage)
Enterprise data analytics helps you use your company’s data. You can find helpful ideas from this information. This makes it easier to make smart choices. It also helps your business work better. Many experts say enterprise data analytics is a step-by-step way. You collect lots of data. You process and study the data. You use what you learn to make good decisions.
You get data from many places.
You use different ways to study data, like descriptive, diagnostic, predictive, and prescriptive analytics.
You search for patterns and answers to big questions.
You use tools to see and understand the data.
Enterprise analytics shows you why things happened. It helps you guess what could happen next. It tells you what you should do. These ideas help you fix problems and plan ahead. You can stay ahead of other businesses.
Tip: Enterprise data analytics is not just about numbers. You find stories and lessons in your data.
Key Features of Enterprise Data Analytics
Enterprise analytics is special because it works with lots of data. It can use information from many places. You get a full picture of your business. Here is a table that shows how enterprise data analytics helps big companies:
Aspect
Description
Integration
Puts together data from different parts of your business.
Types of Analytics
Uses descriptive, diagnostic, predictive, and prescriptive analytics.
Decision-Making
Helps you make smart choices and run your business better.
Competitive Advantage
Gives you useful ideas from data to help you win.
Challenges
Fixes problems like mixing data, keeping it good, and keeping it safe.
Enterprise analytics has features that make it different from regular analytics. You can see these differences in the table below:
Feature
Enterprise Data Analytics
Traditional Analytics
Flexibility
Works with both structured and unstructured data
Only works with structured data
Scalability
Can grow across many places and systems
Stays in one place only
Performance
Handles fast and real-time data
Gets slow with lots of data
Real-time Analytics
Gives answers right away
Shows results after things happen
Variety of Sources
Connects to many kinds of data
Connects to just a few sources
Architecture
Uses a spread-out system for more power
Uses one main system
Data Size
Handles very big sets of data
Works with smaller sets of data
You can use tools like FineDataLink and FineBI from FanRuan. FineDataLink connects over 100 data sources. You can move and match data right away. You do not need to write code to share data. FineBI lets you look at your data in a simple way. You can use AI and machine learning to find patterns and get better results.
See new information about your customers and business.
Use an easy interface to work with your data.
Share data between systems without programming.
Connect to many different data sources.
Use smart technology to make your data better.
Enterprise data analytics brings all your data together. You can make smarter choices and spot trends fast. When you use FineDataLink and FineBI, your business can grow and do well.
Why Enterprise Data Analytics Matters
Business Impact of Enterprise Data Analytics
You want your company to make smart choices. Enterprise data analytics helps you do this. When you use analytics, you find patterns in your data. These patterns show what works and what does not work. You can change your plans quickly. You do not need to guess. You use facts to decide.
Analytics gives you real results you can see. Your business gets better with these results. Look at the table below. It shows how analytics changes your company’s numbers:
You can see these changes happen in real life. For example:
You set up a new model in week one.
In week five, users give feedback about pricing in regions.
You retrain your model in week six. You add details for each region.
Your revenue goes up by 15 percent.
Analytics helps you make better decisions for your business. You do not depend on luck. You use data from many places. You look at customer feedback and market trends. You find answers in your numbers.
Tip: When you use enterprise analytics, you stop guessing. You make smart choices. You see what is happening now and what could happen next.
Competitive Edge of Enterprise Data Analytics
You want your company to be different from others. Enterprise analytics gives you this edge. You use analytics to see things your competitors do not see. You find new ways to win.
Big companies use analytics to lead their industries. Walmart uses data to know what customers want. They keep prices low and stock the right products. Netflix uses analytics to suggest shows you might like. They keep viewers happy and loyal.
Inventory dashboard created by FineReport (click to engage)
You can do this too. When you use enterprise analytics, you:
Find trends before others do.
Change your plans quickly.
Keep your customers happy.
Make your business stronger.
FanRuan helps you reach this level. The company has won awards for its analytics tools. FanRuan got an Honorable Mention in the Gartner Magic Quadrant for ABI Platform for three years. Forbes put it on the Cloud 100 list in 2021. These awards show FanRuan’s solutions work for real businesses.
You can trust FanRuan to help you use enterprise data analytics. You get tools like FineDataLink and FineBI. These tools help you connect your data, find ideas, and make smart business choices. You move faster than your competitors. You grow your business with confidence.
Enterprise Data Analytics's Benefits for Businesses
Efficiency Gains of Enterprise Data Analytics
You want your business to work well and save time. Enterprise analytics helps you do this. FineDataLink and FineBI connect to many data sources fast. You see all your data in one spot. You do not wait long for reports. You get answers quickly.
Here is a table that shows how analytics makes work easier:
Efficiency Gain
Description
Improved Decision-Making
AI-driven insights help you find new revenue and predict future trends.
Enhanced Operational Efficiency
Automated reporting and anomaly detection make your work faster and reduce delays.
Increased Revenue Generation
Predictive analytics lets you plan for demand and optimize your strategy.
FineDataLink gives you quick connections and real-time data updates. FineBI lets you study and see your data by yourself. You do not need to wait for IT help. You make choices faster and make your work better.
Real-Time Insights
You need to know what is happening in your business now. Enterprise analytics gives you real-time insights. You see the newest data. You act on problems or trends right away.
Here are some ways real-time analytics helps you:
Sharpened decision making: You use the latest information to make smart choices.
Personalized customer experiences: You adjust your services to match what customers want.
Increased business efficiency: You monitor key numbers and fix issues quickly.
FineBI help you watch your business as it happens. You respond to changes fast. You keep your work running well. You stay ahead of other companies.
You want to make choices using facts, not guesses. Enterprise data analytics helps you make data-driven decisions. You use analytics to find patterns and answers in your data. You see what works and what needs to change.
A client used a dashboard for grant management. More users joined, up by 40%. Renewals went up too.
Another client changed their pricing page after studying user actions. Lead generation jumped by 156%.
One company gave special rewards to workers. Sales and engagement got better.
A construction client focused on homes after analytics showed higher profits.
FineDataLink and FineBI help you turn raw data into clear ideas. You make choices with confidence. You grow your business and reach your goals.
Key Components of Enterprise Data Analytics
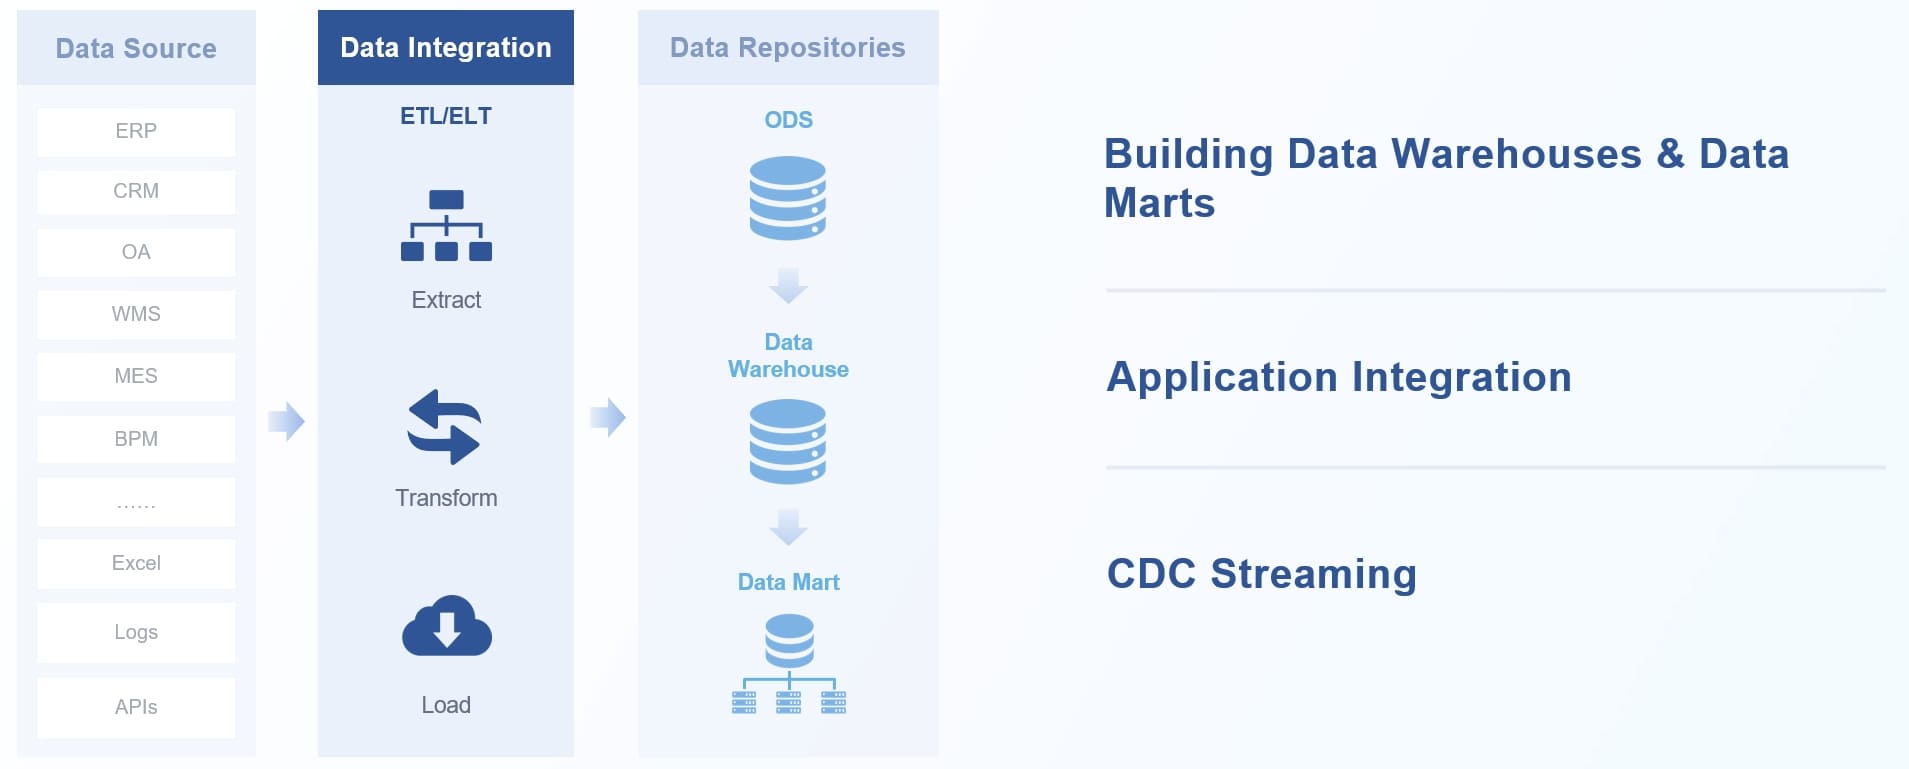
Data Integration
Data integration is the first step in enterprise analytics. You put information from different places together. This helps you manage your data better. It also makes your analytics more correct. When all your data is in one spot, you find answers faster. You do not waste time looking for information.
Data integration makes your data better.
You keep everything in one place, so it is easy to use.
You save time and energy and can focus on analytics.
You can use reverse ETL to let business users do analytics tasks.
FineDataLink helps with data integration. It connects to many sources, like databases and cloud storage. It keeps your data the same and up to date. You can see how FineDataLink helps your analytics in the table below:
Feature
Description
Data Integration from Multiple Sources
Connects to many kinds of data, like cloud and on-premises systems.
Updates your dashboards and reports with new information.
Seamless Data Transformation
Changes your data into the right format for analytics.
Analytics Tools
Analytics tools help you turn raw data into useful ideas. You use these tools to study your data and find patterns. They help you make smart choices. Many companies use tools like Power BI, Klipfolio, SAP Analytics Cloud, Sisense, and ThoughtSpot. These tools let you see real-time numbers, look at data, and make reports.
FineBI is a strong analytics tool for enterprise analytics. You get an easy drag-and-drop interface. FineBI works with big data sets and lets you change your reports. You can compare FineBI to other analytics tools in this table:
You can use FineBI to look at your data, make dashboards, and share results with your team. This makes analytics easier for everyone.
Governance
Governance is important for enterprise analytics. You need rules to keep your data safe and correct. Good governance helps you trust your analytics results. It also helps you follow laws and keep private information safe.
Here are some best ways to do data governance:
Set clear roles and jobs.
Pick the right software for governance.
Start small and grow slowly.
Check and improve your process often.
You should also:
Make a plan for governance.
Make sure your data matches business goals.
Keep your data safe and correct.
Work together with other teams.
Follow all rules and laws.
Strong governance keeps your data high quality. It helps you avoid mistakes and follow the rules. When you use enterprise analytics with good governance, you make better choices and protect your business.
Implementation Best Practices of Enterprise Data Analytics
Building a Data Culture
You need a strong data culture to do well with enterprise analytics. Leaders should support your analytics journey. When leaders care about data, others will care too. Let your team use and see data. Ask business and technology teams to work together. Celebrate when your team makes good choices using data.
Tip: When you reward people for using data, your team learns why analytics matters.
Here are steps to help you build a data culture:
Match your analytics journey with your business plan.
Get leaders to support your work.
Start with small projects to show quick results.
Make your data strong and safe.
Help your team get used to changes.
Find people who can lead and set examples.
Keep trying and always get better.
Setting Objectives
Clear goals help your enterprise analytics projects. Decide what you want before you start. Let your team help set these goals. Break big goals into smaller tasks. Use data to help pick your goals.
Follow these steps to set good objectives:
Find your main business goals.
Match each analytics project to a business goal.
Set key numbers to measure each project.
Check your progress often and change things if needed.
Share results and ideas with everyone.
When you set clear goals, your analytics work helps your business. This stops you from wasting time and missing chances.
Ensuring Quality
Good data is very important for enterprise analytics. You must trust your data to make smart choices. Make rules to keep your data the same. Use checks to stop mistakes before they spread. Automated tools can help you watch data quality all the time.
Here are five important parts of data quality:
Completeness
Accuracy
Consistency
Timeliness
Uniqueness
FanRuan’s products help you keep high data quality. FineDataLink and FineBI give each group a data manager. They check for duplicate tables and make sure data follows rules. Each table has someone to fix mistakes. Public data sets have clear names and rules so everyone understands. You get official, trusted data for your analytics.
Note: When you use FanRuan’s solutions, your enterprise analytics uses trusted, high-quality data.
Enterprise Data Analytics Solutions Overview
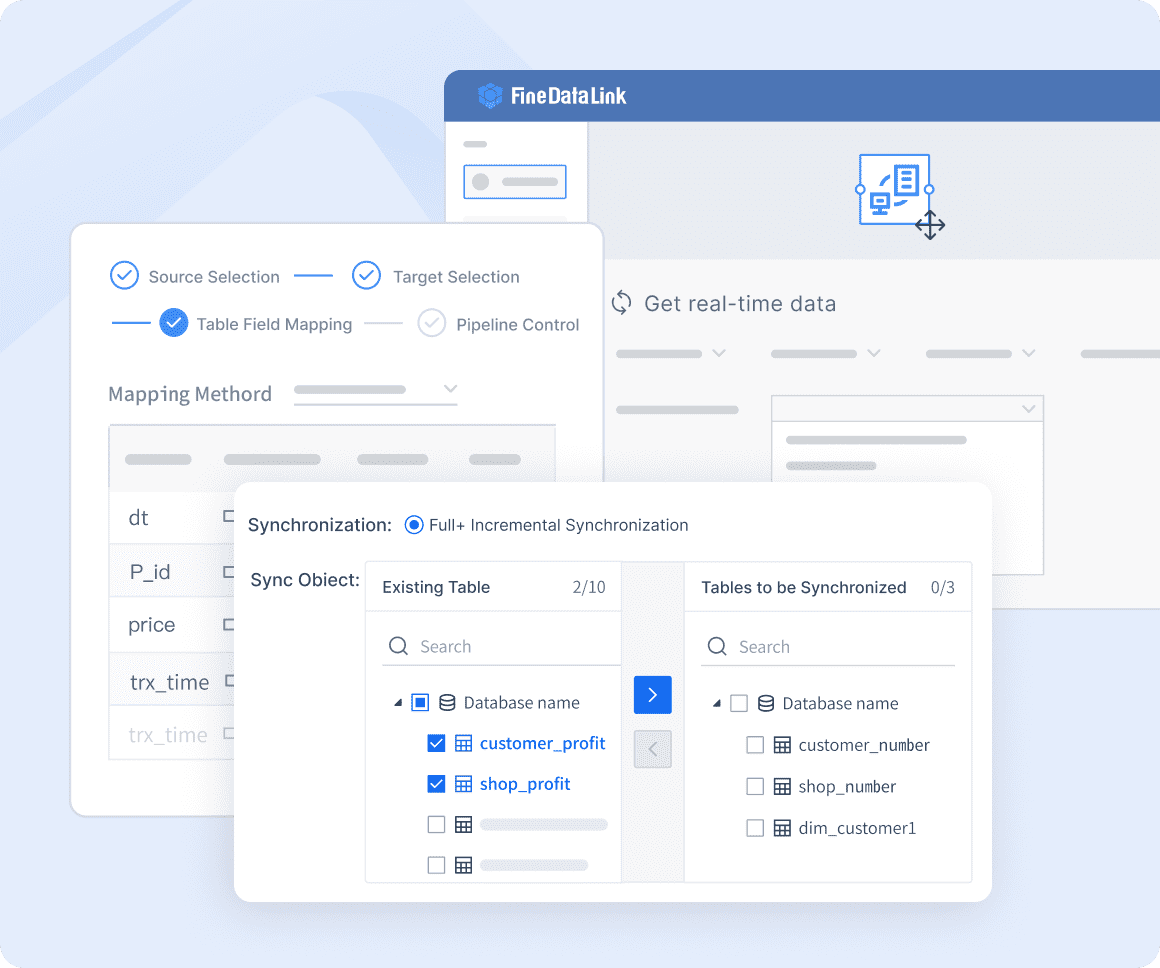
FineDataLink
FineDataLink lets you put all your data together. You can link information from more than 100 places. You do not have to write any code. You use a simple drag-and-drop tool. This platform moves data right away. You can build a strong data base for your company. You get quick updates and keep your data safe.
FineDataLink makes your job easier. You save time and make fewer mistakes. You can focus on analytics and growing your business. You can learn more about FineDataLink on the official product page.
Note: FineDataLink helps you break apart data silos and create one main source for your analytics.
FineBI
FineBI gives you strong analytics tools. You can look at your data and find answers fast. You do not need special tech skills. You use a drag-and-drop dashboard to make charts and reports. FineBI connects to over 30 big data platforms and SQL sources.
Here is a table that shows how FineBI helps you with advanced analytics:
Feature
Description
Self-Service BI Capabilities
You study data and make visualizations by yourself.
Data Visualization
You make charts and dashboards with an easy tool.
Data Collaboration
You share ideas with your team to help decisions.
Data Management
You clean and get data ready for better results.
Connection Support
You link to many data sources for full analysis.
You can use FineBI to:
Help your team study and understand data.
Make smarter choices and help your business do better.
Use smart chart styles that fit your data.
FineBI helps you turn raw data into clear ideas. You can learn more about FineBI on the official product page.
Enterprise data analytics helps you run your business better. You can spot patterns in your data. This lets you make smarter choices. Your company can grow faster with these ideas. FanRuan’s tools, FineDataLink and FineBI, help you use all your data.
Think about how you use data now. Ask yourself if your business is ready to improve. Look at FanRuan’s solutions and begin making better choices today.
Smarter product, pricing, and inventory management across retail sectors.
FAQ
What is enterprise data analytics?
Enterprise data analytics helps you use your company’s data. You find patterns and answers in the information. This helps you make smart choices. You can improve your business with these ideas. You use tools to collect and study data from many places.
How does FineDataLink help with data integration?
FineDataLink lets you connect to over 100 data sources. You move and sync data right away. You use a drag-and-drop interface. You do not need to write any code. Your data stays clean and ready for analysis.
Can FineBI support real-time analysis?
Yes, FineBI gives you real-time insights. You see the newest data as soon as it updates. You build dashboards and reports fast. You make choices using current information.
Is it easy to use FanRuan’s analytics tools?
You do not need special skills to use FineDataLink or FineBI. You use simple interfaces to work with your data. You create reports and dashboards by dragging and dropping. Guides and videos help you learn.
How do I keep my data safe with enterprise analytics?
You set clear rules for who can see data. You use role-based permissions in FineBI. You pick managers for each data table. You follow best practices for data governance. You keep sensitive information safe.