

Gross profit shows the difference between revenue and the cost of goods sold. Every business needs to track gross profit to measure how much money stays after covering direct costs. When a business understands gross profit, it can see how its core activities drive profit. Gross profit helps owners and managers find ways to raise profit and improve business success. A strong focus on gross profit guides smart choices that support lasting profit growth.
Gross Profit Basics
What Is Gross Profit?
Gross profit stands as a core measure of a company’s ability to generate profit from its main activities. It shows how much money remains after subtracting the cost of goods sold from revenue. The cost of goods sold includes direct costs such as materials and labor. Gross profit does not include operating expenses, taxes, or other indirect costs. The standard formula is:
Gross Profit = Revenue – Cost of Goods Sold
This formula appears near the top of the income statement, right after revenue and cost of goods sold. For example, if a business earns $50,000 in revenue and spends $30,000 on direct costs, the gross profit equals $20,000. This calculation helps managers see how efficiently the company produces and sells its goods or services. Gross profit serves as a foundation for understanding total gross profit, net profit, and other financial metrics.
Different industries define and report gross profit based on their unique operations. Manufacturing companies include raw materials and direct labor in the cost of goods sold. Service businesses focus on direct labor and materials. Each industry must follow accounting standards, such as GAAP or IFRS, to ensure consistency. Gross profit always reflects the money left from revenue after covering only direct costs, making it a key financial health indicator.
Why Gross Profit Matters
Gross profit plays a vital role in measuring business performance. It acts as a financial health indicator by showing if a company can cover its variable costs and contribute to fixed costs and net profit. Gross profit highlights the efficiency of production and pricing strategies. A strong gross profit margin signals lean operations and well-managed costs.
- Gross profit margin reveals competitive advantage. It shows how much customers value a product and how efficiently the company manages production.
- A high gross profit margin means the business controls costs and maintains sustainable profit.
- Tracking gross profit over time helps managers spot operational problems or confirm successful strategies.
Gross profit influences many business decisions. It guides pricing, resource allocation, and cost management. Companies use gross profit to monitor production efficiency and optimize labor and material costs. Gross profit also supports financial modeling and valuation, helping investors and leaders assess company value. When businesses track gross profit, they can respond quickly to market changes and protect profit margins.
Note: Gross profit’s significance in income statement analysis comes from its position as the first measure of profit after revenue. It sets the stage for understanding overall profitability and guides strategic planning.
Gross profit serves as a compass for financial planning, risk management, and business growth. By focusing on gross profit, companies can improve business performance and achieve long-term success.
Calculate Gross Profit
Gross Profit Formula
Gross profit measures how much money a business keeps after paying for the direct costs of making or selling its products. To calculate gross profit, subtract the cost of goods sold from total revenue. This formula helps businesses see how much profit comes from their main activities before considering other expenses.
Gross Profit = Revenue – Cost of Goods Sold
For example, if a company earns $500,000 in revenue and spends $300,000 on the cost of goods sold, the gross profit is $200,000. This calculation shows how much money remains to cover other expenses and generate net profit.
A real-world example makes this clearer:
- A clothing retailer has gross sales of $150,000.
- Refunds and discounts total $ 50,000, so net sales revenue is $ 100,000.
- The cost of goods sold is $ 50,000.
- Gross profit is $ 100,000 minus $ 50,000, which equals $ 50,000.
- The gross profit percentage is ($ 50,000 / $ 100,000) × 100 = 50%.
This example shows how to calculate gross profit and gross profit margin in a retail business. A higher gross profit means the company keeps more money from each sale after covering direct costs.
Cost of Goods Sold Explained
The cost of goods sold includes all direct costs needed to produce or buy the products a business sells. These costs can include raw materials, direct labor, and factory overhead. For retail companies, the cost of goods sold often means the price paid for items to resell, plus shipping and storage. For manufacturers, it covers raw materials, parts, direct labor, and production overhead.
Common components of cost of goods sold:
- Raw materials used in production
- Items purchased for resale
- Direct labor costs for workers making the product
- Freight-in and shipping costs
- Factory overhead, such as utilities and equipment maintenance
- Storage costs for inventory
The cost of goods sold does not include selling expenses, office rent, advertising, or management salaries. These are indirect costs and appear elsewhere on the income statement.
Companies in different industries calculate cost of goods sold in ways that fit their operations. Retailers focus on the cost of buying finished goods and changes in inventory. Manufacturers include raw materials, direct labor, and production overhead. The basic formula for cost of goods sold is:
COGS = Beginning Inventory + Purchases – Ending Inventory
| Sector | Beginning Inventory | Purchases (including direct labor/materials) | Ending Inventory | COGS Calculation Formula | Example COGS Value |
|---|---|---|---|---|---|
| Retail | Inventory at period start | Purchases of goods for resale | Inventory at period end | Beginning Inventory + Purchases – Ending Inventory | $11,000 |
| Manufacturing | Raw materials inventory start | Purchases including materials and direct labor | Inventory at period end | Beginning Inventory + Purchases – Ending Inventory | $30,000 |
Fluctuations in raw material prices can change the cost of goods sold. If raw material costs rise, the cost of goods sold increases, which lowers gross profit if revenue stays the same. If raw material costs fall, the cost of goods sold decreases, and gross profit rises.
For example, if a company’s revenue is $1,000,000 and the cost of goods sold increases from $600,000 to $700,000, gross profit drops from $400,000 to $300,000. This change also lowers the gross profit margin.
Tip: Tracking cost of goods sold helps businesses manage costs, set prices, and protect profit margins.
Automating and Visualizing Gross Profit with FanRuan and FineBI
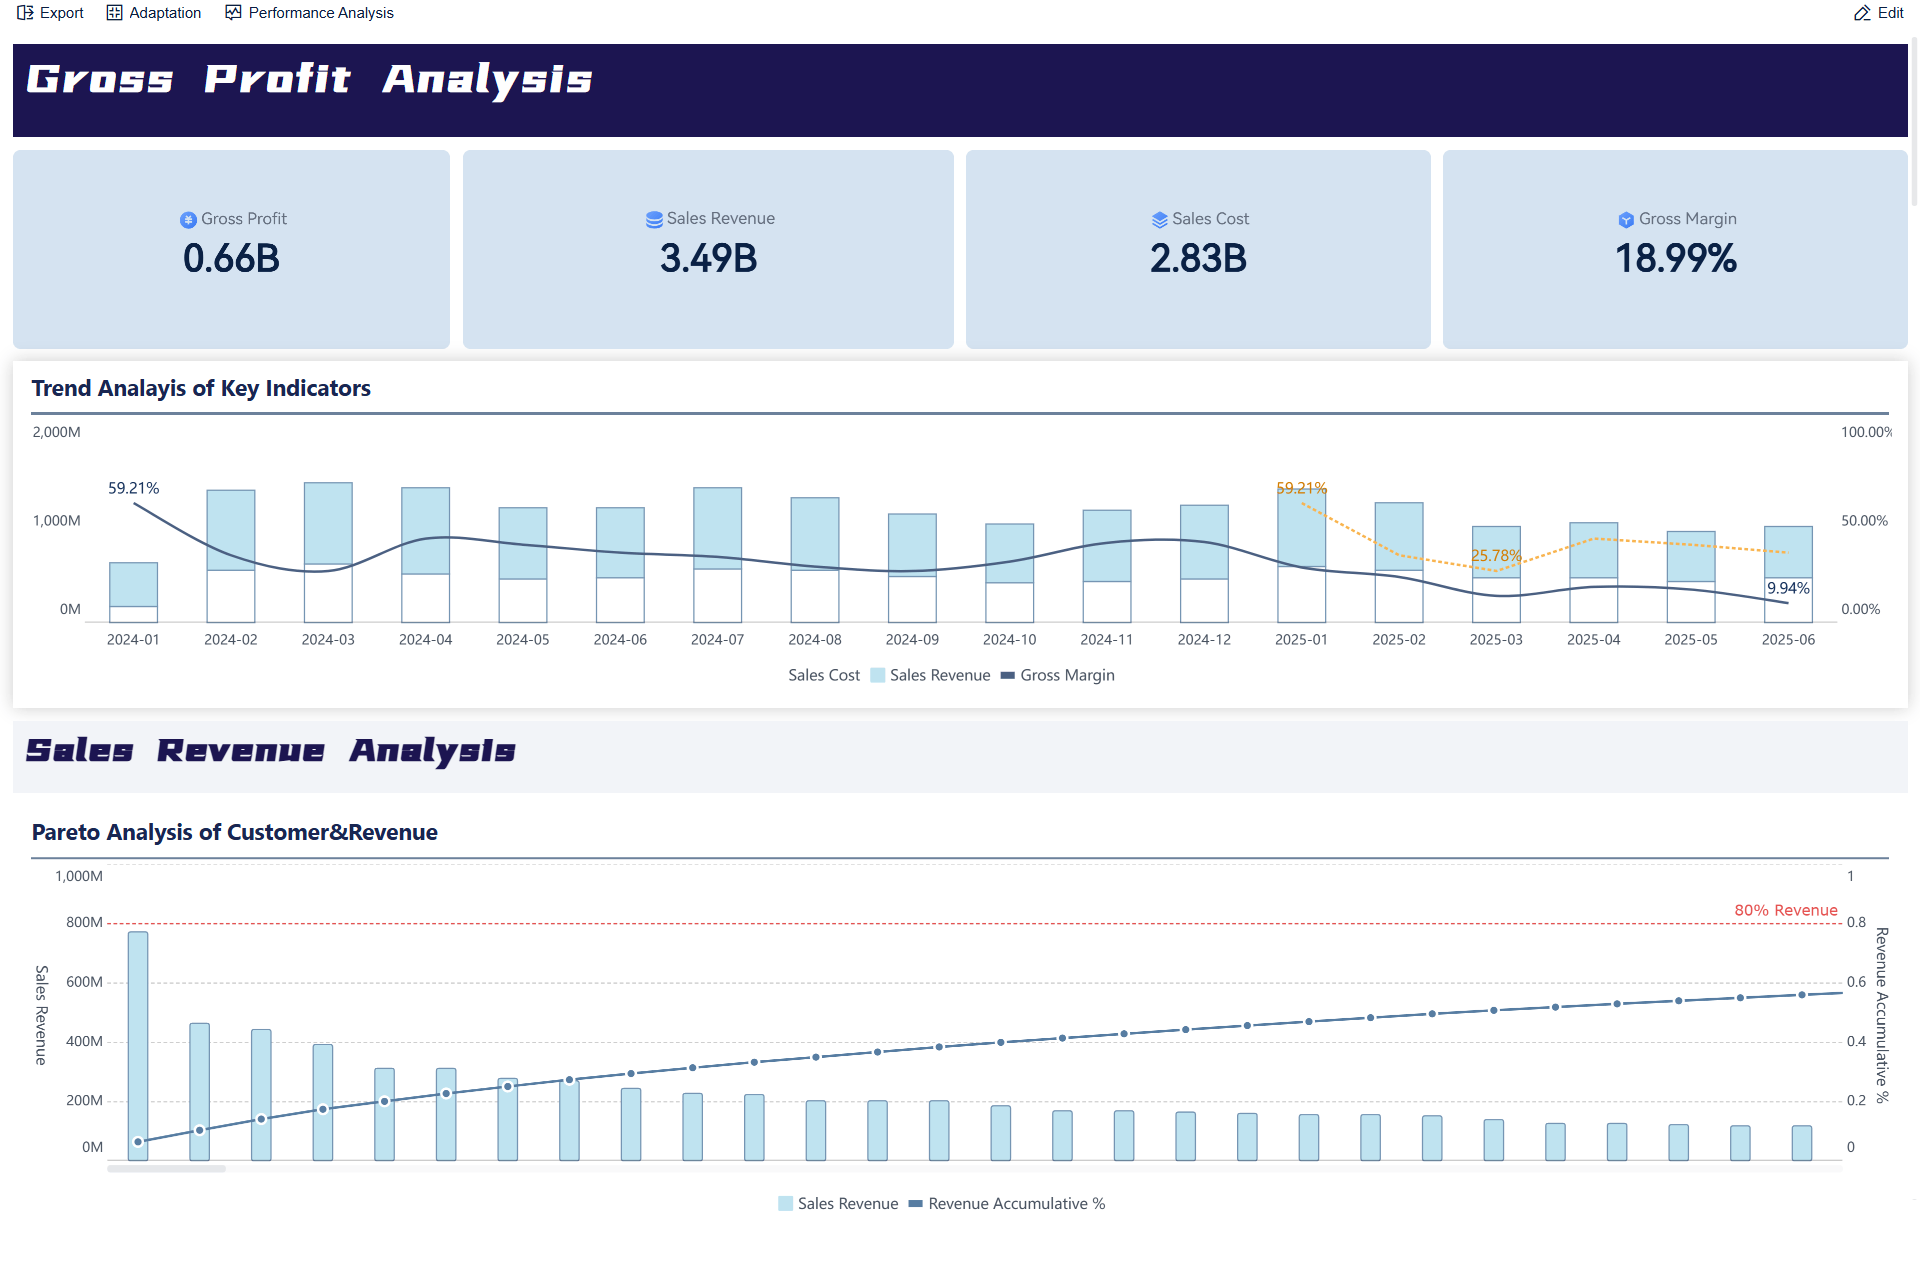
Modern businesses need accurate and timely information to make smart decisions. Manual calculations of gross profit and cost of goods sold can take time and lead to mistakes. FanRuan offers FineBI, a self-service business intelligence tool that helps automate these calculations and visualize results in real time.
FineBI connects to many data sources, including sales systems and inventory databases. It pulls data automatically, calculates gross profit, and displays results in easy-to-read dashboards. Users can track revenue, cost of goods sold, and profit trends over time. FineBI also allows users to drill down into details, compare different periods, and spot changes in gross profit margins.
With FineBI, finance teams and managers can:
- Monitor gross profit and cost of goods sold without manual spreadsheets
- Visualize profit trends and identify areas for improvement
- Respond quickly to changes in raw material costs or sales performance
- Share dashboards with team members for better collaboration
By using FineBI, businesses gain a clear view of their financial health. This helps them make informed decisions, control costs, and improve overall profitability.
Gross Profit vs. Gross Profit Margin

Gross profit and gross profit margin both measure profitability, but they serve different purposes in financial analysis. Gross profit shows the absolute dollar amount left after subtracting the cost of goods sold from revenue. This figure highlights how much money remains to cover other expenses and generate net profit. Gross profit margin, on the other hand, expresses gross profit as a percentage of revenue. This percentage reveals how efficiently a company manages production costs compared to sales.
Gross profit margin focuses only on direct production costs. It helps compare companies within the same industry and assess operational efficiency. A higher gross profit margin means a company keeps more profit from each sales dollar after covering direct costs. This metric allows analysts to evaluate cost management and pricing strategies. While gross profit gives the raw figure, gross profit margin provides a relative measure that makes it easier to compare performance across businesses and industries.
Margin Calculation
To calculate gross profit margin, subtract the cost of goods sold from revenue to find gross profit. Then, divide gross profit by revenue and multiply by 100 to get a percentage. The formula looks like this:
Gross Profit Margin = (Gross Profit ÷ Revenue) × 100
For example, if a retailer earns $200,000 in revenue and has a cost of goods sold of $100,000, the gross profit is $100,000. The gross profit margin is ($100,000 ÷ $200,000) × 100 = 50%. This means the company keeps 50% of its revenue as profit after direct costs.
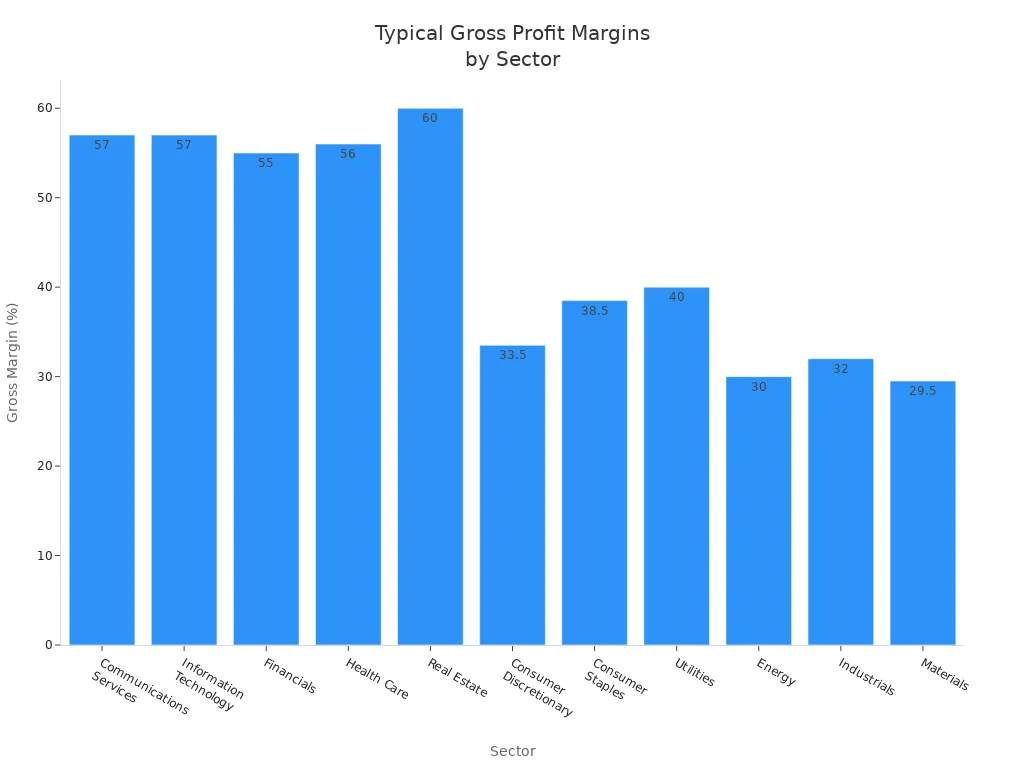
Profit margins vary by industry. Retail businesses often have gross profit margins around 50-53%, while capital-light sectors like information technology and health care can see margins above 55%. Capital-intensive sectors, such as energy or manufacturing, usually have lower profit margins, sometimes near 30% or less.
Tracking gross profit margin over time helps businesses spot trends and respond to changes in costs or pricing. A declining margin may signal rising costs or pricing pressures, while a stable or rising margin suggests strong cost control and pricing power.
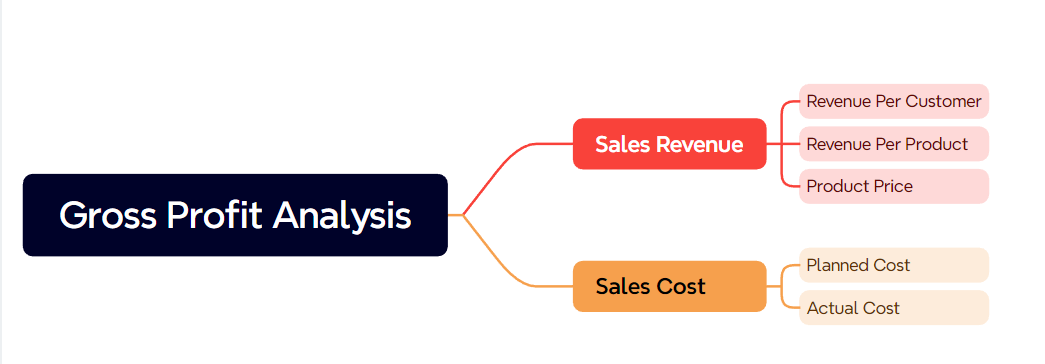
Improving Business Success with Gross Profit Analysis
Using Gross Profit Insights
Understanding and tracking gross profit gives companies a powerful tool for improving business profitability. Gross profit analysis helps leaders set prices that cover costs and support profit goals. By reviewing gross profit data, managers can choose the best pricing strategy for their market. The table below shows how different pricing strategies affect profit margins:
| Pricing Strategy | Description | Impact on Gross Margins |
|---|---|---|
| Cost-Based Pricing | Adds a set margin to production cost. Simple but may miss market demand. | Ensures cost recovery but may limit profit if higher prices are possible. |
| Value-Based Pricing | Sets price based on customer value and benefits. | Can increase profit by matching price to what customers will pay. |
| Competitor-Based Pricing | Prices set in relation to competitors. | May lower profit if competitors cut prices; ignores unique value. |
| Dynamic Pricing | Adjusts prices using real-time data and demand. | Maximizes profit by changing prices as market shifts. |
Gross profit data also guides cost control. Companies can use several methods to manage costs and boost profitability:
- Review income statements and direct costs often for accuracy.
- Track gross profit trends to spot changes in profitability.
- Compare gross profit across products or channels to focus on high-margin items.
- Use graphs to visualize profit performance for better decisions.
- Streamline product lines and renegotiate supplier contracts to lower costs.
- Upsell to existing customers and improve operational efficiency.
Tracking gross profit supports business growth. It helps leaders set realistic sales targets and plan for expansion. Historical gross profit data allows companies to forecast future performance and attract investors by showing strong financial planning. These insights help businesses reinvest wisely and support long-term growth.
Tip: Regularly monitoring gross profit and related metrics helps companies respond quickly to market changes and protect their profitability.
Role of FineBI in Profit Analysis
FineBI plays a key role in improving business profitability. This self-service business intelligence tool connects to many data sources and automates gross profit calculations. FineBI provides real-time dashboards that display revenue, cost of goods sold, and profit trends. Managers can drill down into details, compare periods, and spot changes in gross profit margin.
FineBI enables teams to:
- Monitor gross profit and profitability without manual spreadsheets.
- Visualize profit trends and identify areas for improvement.
- Respond quickly to changes in costs or sales performance.
- Share dashboards for better teamwork and decision-making.
Tracking gross profit gives business owners clear insight into core profitability and operational efficiency. Companies that use BI tools like FineBI can overcome common challenges, improve profit margins, and set a strong foundation for business success.

FanRuan
https://www.fanruan.com/en/blogFanRuan provides powerful BI solutions across industries with FineReport for flexible reporting, FineBI for self-service analysis, and FineDataLink for data integration. Our all-in-one platform empowers organizations to transform raw data into actionable insights that drive business growth.
FAQ
Gross profit measures money left after direct costs. Net profit shows what remains after all expenses, including taxes and overhead. Net profit gives a complete view of a company’s earnings.
Businesses should track gross profit monthly or quarterly. Regular tracking helps managers spot trends, control costs, and make better decisions.
FineBI works well for small businesses. It automates calculations, connects to many data sources, and creates easy-to-read dashboards. This helps owners understand profit trends quickly.
Industries have different cost structures. Manufacturing often faces higher material and labor costs. Technology or service companies usually have lower direct costs. These differences affect gross profit margins.
Companies can raise prices, lower direct costs, or improve production efficiency. Reviewing supplier contracts and focusing on high-margin products also helps. FineBI can highlight which actions work best.


