A comprehensive data analysis framework is crucial for extracting valuable insights from raw data. It provides a structured method that guides you through the entire data journey, ensuring consistency and accuracy. By implementing such a framework, you can enhance your decision-making process, leading to improved products and services. Tools like FineDataLink streamline data integration, while FineReport and FineBI facilitate visualization and reporting. These tools empower you to make informed, data-driven decisions, maximizing the return on your data assets and boosting confidence in your strategic choices.
Understanding Data Analysis Framework
Definition and Importance of Data Analysis Framework
What is a Data Analysis Framework?
A data analysis framework is a comprehensive, structured methodology for examining data. Think of it as a detailed roadmap that guides you through the intricate process of transforming raw data into meaningful insights. This framework establishes a systematic approach to data analysis, ensuring that you consistently derive accurate and actionable results. By adhering to a well-defined framework, you can streamline your analytical efforts, enhance productivity, and make informed decisions grounded in reliable data.
Why is it Important?
The significance of a data analysis framework is profound. It fosters consistency and accuracy throughout the data analysis process, mitigating the risks associated with ad-hoc analysis techniques that often lead to errors. A well-constructed framework empowers you to make data-driven decisions that can significantly enhance products and services, driving innovation and improvement. Additionally, it encourages collaboration and knowledge sharing within your organization by providing a common structure that all team members can follow. This collective approach not only enhances the quality of insights but also cultivates a culture of data literacy and informed decision-making across the enterprise.
Key Components of Data Analysis Framework
step1.Data Collection
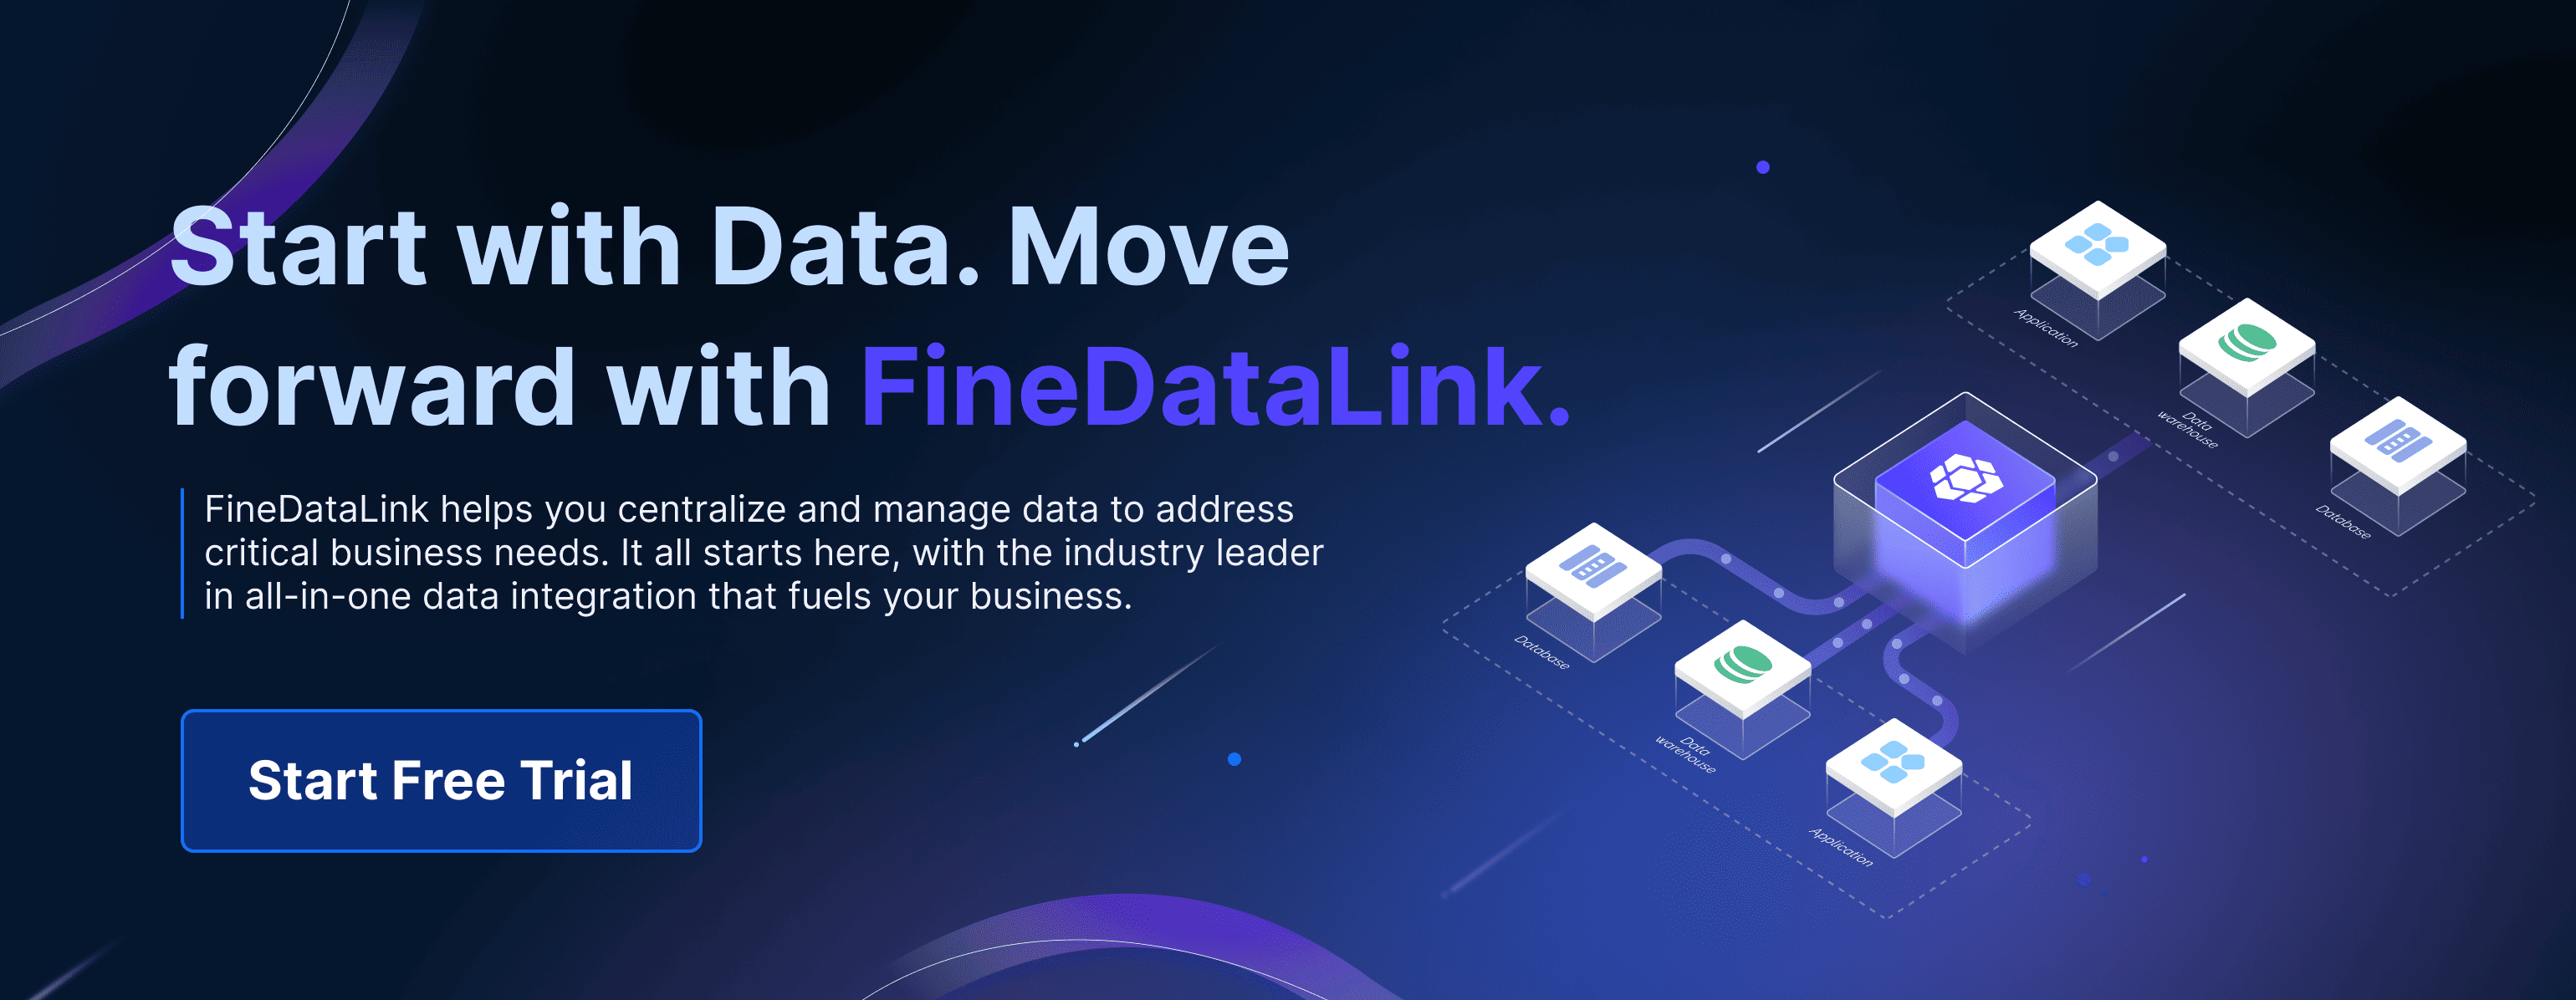
Data collection is the cornerstone of any effective data analysis framework. Gathering relevant data from diverse sources is essential for conducting a comprehensive analysis. This initial step involves clearly identifying the specific data required and determining the most efficient methods for its collection. Leveraging both internal and external data sources can yield valuable insights, while tools like FineDataLink facilitate seamless integration of data across various systems, ensuring a robust foundation for your analysis.
step2.Data Processing
Following data collection, the next critical phase is data processing. This step focuses on cleaning and transforming the data to ensure its suitability for analysis. Effective data processing guarantees that your dataset is accurate, consistent, and devoid of errors. Key techniques such as data transformation and integration are pivotal at this stage. By utilizing advanced tools, you can automate many of these processes, significantly saving time and minimizing the potential for human error, thus enhancing the reliability of your analysis.
step3.Data Visualization
Data visualization is a vital component of a data analysis framework, as it enables the presentation of data in visually engaging and easily comprehensible formats. Utilizing visualization tools like FineReport and FineBI allows you to craft dynamic reports and dashboards that effectively highlight key insights. Effective data visualization not only enhances your comprehension of complex datasets but also aids in clearly communicating findings to stakeholders, fostering informed decision-making and strategic planning.
Setting Objectives and Goals of Data Analysis Framework
1.Identifying Business Needs
To establish a successful data analysis framework, the first critical step is identifying your business needs. This process ensures that your analytical efforts are closely aligned with your overall business strategy and objectives, allowing for a targeted approach that addresses the most pressing challenges and opportunities within your organization.
2.Aligning with Business Strategy
Aligning your data analysis framework with your overarching business strategy is essential. This alignment guarantees that the insights derived from your data analysis directly contribute to achieving your strategic goals. For instance, if your strategy prioritizes customer satisfaction, your data analysis should focus on metrics related to customer feedback and engagement levels. By prioritizing relevant data, you empower your organization to make informed decisions that propel business growth and enhance overall performance.
3.Defining Clear Objectives
Defining clear objectives is paramount for effective data analysis. Knowing precisely what you aim to achieve with your analytical initiatives provides direction and focus, facilitating accurate measurement of success. For example, if your objective is to improve customer retention, you might set a specific target to reduce churn rates by a defined percentage within a predetermined timeframe. Establishing these clear objectives not only enables you to track progress but also allows for strategic adjustments as needed, ensuring your data analysis remains relevant and impactful.
Establishing Key Performance Indicators (KPIs)
Once you have identified your business needs and defined your objectives, the next crucial step is establishing Key Performance Indicators (KPIs). KPIs are quantifiable metrics that enable you to evaluate the effectiveness of your data analysis framework and gauge progress toward your strategic goals.
1.Selecting Relevant KPIs
Choosing the right KPIs is essential for aligning with your business objectives. These indicators should provide meaningful insights into the areas that are most critical to your organization’s success. For example, if your goal is to enhance customer satisfaction, consider selecting KPIs such as the Net Promoter Score (NPS) or Customer Satisfaction (CSAT) scores. By concentrating on relevant KPIs, you ensure that your data analysis efforts are directly supporting your strategic aims, fostering a clearer path to achieving your desired outcomes.
2.Measuring Success
Measuring success involves the ongoing tracking of your selected KPIs over time. Regularly monitoring these indicators allows you to assess the effectiveness of your data analysis framework and make informed adjustments as necessary. Leverage the insights gained to drive data-driven decisions that enhance your products and services. For instance, analyzing customer feedback through NPS or CSAT surveys can illuminate user sentiment and highlight specific areas for improvement. By continuously measuring success, you remain agile in adapting your strategies to meet evolving business needs and effectively achieve your objectives.
Data Collection and Management of Data Analysis Framework
Sources of Data
To construct a robust data analysis framework, it is essential to gather data from a diverse range of sources. This multifaceted approach ensures a comprehensive understanding of the information necessary for effective analysis.
Internal Data Sources
Internal data sources originate within your organization and are critical for informing your analysis. These sources include databases, customer relationship management (CRM) systems, and financial records. By leveraging internal data, you can gain valuable insights into operational efficiency and customer behavior. For instance, analyzing sales data allows you to discern purchasing patterns and identify your top-performing products, providing a solid foundation for strategic decisions that drive business growth.
External Data Sources
In contrast, external data sources are derived from outside your organization and play a crucial role in broadening your analytical perspective. These sources encompass market research reports, social media platforms, and public databases. Utilizing external data enriches your analysis by providing context regarding industry trends and customer preferences. By integrating this external information, you can enhance your strategic decision-making process, enabling you to adapt to market dynamics and better meet the needs of your target audience. This holistic approach to data collection fosters a deeper understanding of the landscape in which your business operates, ultimately leading to more informed and impactful decisions.
Data Management Techniques
Effective data management techniques are essential for ensuring data quality and accessibility. By implementing the right practices, you can maintain the accuracy and reliability of your data, which is critical for informed decision-making.
Data Cleaning
Data cleaning is a fundamental process that involves identifying and rectifying errors and inconsistencies within your dataset. This crucial step enhances data accuracy and reliability. You must address issues such as duplicate entries, missing values, and formatting discrepancies. By meticulously cleaning your data, you significantly improve the integrity of your analysis. Tools like FineDataLink can automate many aspects of the data cleaning process, saving valuable time and reducing manual effort, allowing your team to focus on deriving insights rather than getting bogged down by errors.
Data Storage Solutions
Selecting the right data storage solutions is vital for efficient data management and accessibility. Your storage system should ensure data security while allowing for easy retrieval when needed. Options include cloud storage, data warehouses, and on-premises servers, each offering distinct advantages. Cloud storage provides scalability and flexibility, making it ideal for organizations looking to expand their data storage capacity without significant upfront investment. Conversely, on-premises servers offer enhanced control over data security and compliance, which can be crucial for businesses handling sensitive information. By carefully choosing the appropriate storage solution, you can guarantee that your data remains both accessible and secure, supporting your organization’s analytical needs and strategic goals.
Data Processing and Data Analysis Framework
In the world of data analysis, efficient data processing is paramount. This section will guide you through essential methods and techniques to transform raw data into actionable insights, ensuring that your analysis yields meaningful results.
Data Processing Methods
Data processing encompasses the preparation of your data for analysis, ensuring that it is clean, consistent, and primed for deeper examination.
Data Transformation
Data transformation involves converting data from its original format into a more suitable structure for analysis. This may include changing data types, normalizing values, or aggregating data. This step is vital as it enhances the quality and usability of your dataset. By transforming your data, you ensure that it aligns with your analytical requirements, making it significantly easier to draw insightful conclusions and make informed decisions.
Data Integration with FineDataLink
Data integration refers to the process of consolidating data from various sources into a unified view. FineDataLink is instrumental in this process, allowing for seamless integration of data from diverse systems. By utilizing FineDataLink, you can automate data synchronization, which not only reduces manual effort but also minimizes the risk of errors. This tool supports real-time data integration, ensuring that your dataset remains current and relevant, crucial for effective analysis.
Analytical Techniques
Once your data has been processed, you can employ various analytical techniques to extract valuable insights. These methodologies help illuminate patterns, trends, and relationships within your dataset.
Descriptive Analysis
Descriptive analysis focuses on summarizing the main characteristics of your data, providing an overview through metrics such as mean, median, and mode. This technique enables you to understand the fundamental features of your dataset and identify patterns and trends that inform decision-making. It serves as a crucial foundation for more advanced analyses.
Predictive Analysis
Predictive analysis takes a step further by leveraging historical data to forecast future outcomes. This technique employs statistical models and machine learning algorithms to predict trends and behaviors. By utilizing predictive analysis, you can anticipate changes and make proactive decisions. This capability allows you to identify potential opportunities and risks, equipping you to strategize effectively in a dynamic environment.
Incorporating these data processing methods and analytical techniques into your framework will significantly enhance your ability to derive valuable insights from your data. Tools like FineDataLink streamline the integration process, ensuring that your data is fully prepared for analysis. By mastering these techniques, you empower yourself to make informed, data-driven decisions that drive organizational success.
Data Analysis Framework: Data Visualization and Reporting
Data visualization and reporting play a crucial role in your data analysis framework. They transform complex data into understandable insights, making it easier for you to make informed decisions.
Importance of Visualization
Enhancing Data Understanding
Visualization enhances your understanding of data by presenting it in a graphical format. Charts, graphs, and dashboards allow you to see patterns and trends that might not be obvious in raw data. This visual representation helps you grasp complex information quickly and effectively. By using visualization, you can identify outliers, spot trends, and make comparisons with ease.
Tools for Visualization with FineReport
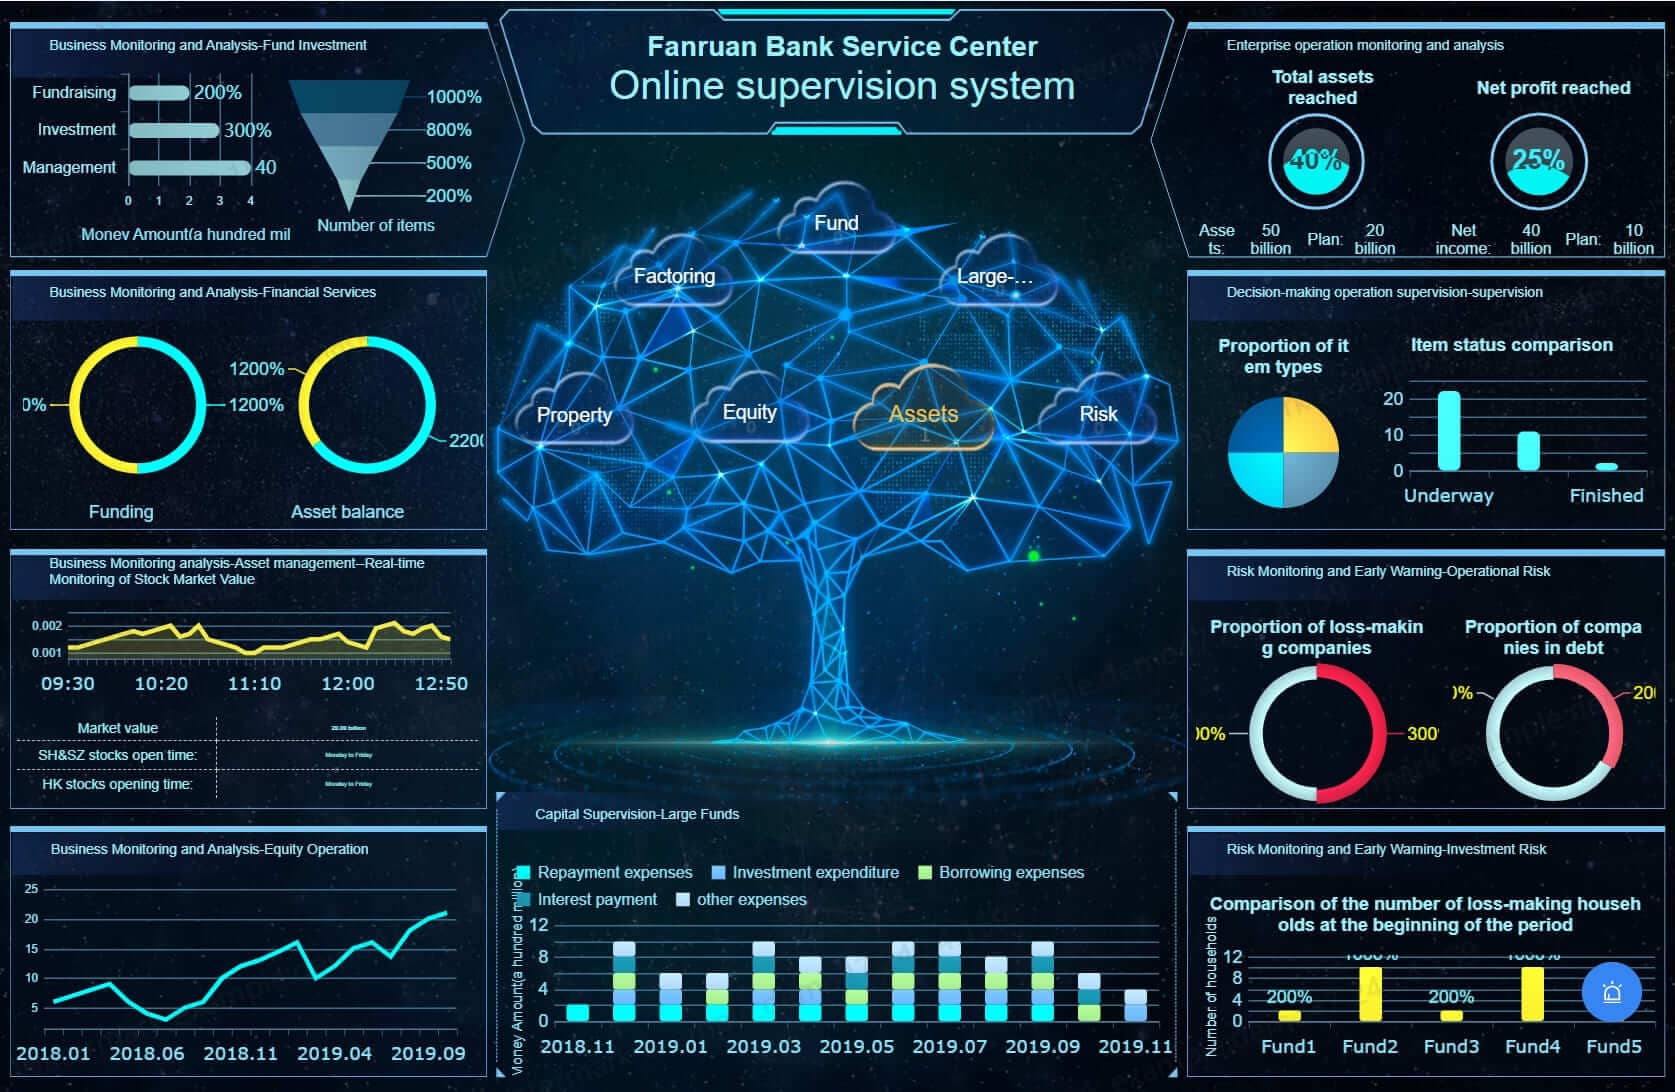
FineReport serves as an excellent tool for data visualization. It offers a zero-code design interface, enabling you to create professional and visually appealing reports without any coding knowledge. With FineReport, you can design interactive dashboards that provide real-time insights. Its drag-and-drop functionality simplifies the process, allowing you to focus on analyzing data rather than struggling with technical complexities. FineReport's versatility makes it suitable for various visualization needs, from simple charts to complex data presentations.
Reporting Insights
Creating Effective Reports
Creating effective reports involves presenting data in a clear and concise manner. You should focus on highlighting key insights that are relevant to your audience. FineReport allows you to customize reports to meet specific requirements. You can choose from a variety of templates and visualization options to create reports that effectively communicate your findings. By tailoring your reports, you ensure that your audience receives the most pertinent information.
Communicating Findings
Communicating your findings effectively is essential for driving action. Use reports to convey insights in a way that resonates with your audience. FineReport's dynamic reporting capabilities enable you to present data in an engaging format. You can include interactive elements that allow stakeholders to explore data further. By using FineReport, you enhance your ability to communicate complex data insights clearly and persuasively.
Incorporating data visualization and reporting into your framework empowers you to make data-driven decisions confidently. FineReport provides the tools you need to visualize data effectively and create impactful reports. By leveraging these capabilities, you can transform raw data into actionable insights that drive success.

Implementing the Data Analysis Framework
Implementing a data analysis framework requires careful planning and execution. By following a structured approach, you can ensure that your framework operates efficiently and effectively.
Step-by-Step Implementation
Planning and Preparation
- Define Your Objectives: Start by clearly defining what you want to achieve with your data analysis framework. This step sets the foundation for all subsequent actions.
- Gather Resources: Identify the tools and technologies you need. Consider using platforms like FineDataLink for data integration and FineReport for visualization.
- Assemble Your Team: Bring together a team of skilled professionals. Ensure that each member understands their role in the implementation process.
- Develop a Timeline: Create a realistic timeline for each phase of the implementation. This helps keep the project on track and ensures timely completion.
- Conduct a Risk Assessment: Identify potential risks and develop strategies to mitigate them. This proactive approach minimizes disruptions during implementation.
Execution and Monitoring
- Execute the Plan: Begin implementing your framework according to the plan. Ensure that each step aligns with your objectives.
- Monitor Progress: Regularly check the progress of the implementation. Use key performance indicators (KPIs) to measure success and identify areas for improvement.
- Adjust as Needed: Be flexible and ready to make adjustments. If something isn't working, don't hesitate to revise your approach.
- Document Everything: Keep detailed records of the implementation process. This documentation serves as a valuable resource for future reference.
Overcoming Challenges
Implementing a data analysis framework can present challenges. By anticipating these obstacles, you can develop effective solutions.
Common Obstacles
- Data Quality Issues: Inaccurate or incomplete data can hinder analysis. Ensure data quality by implementing robust data cleaning processes.
- Resistance to Change: Team members may resist new processes. Address this by providing training and emphasizing the benefits of the framework.
- Technical Limitations: Outdated technology can impede progress. Invest in modern tools and platforms to overcome these limitations.
Solutions and Best Practices
- Invest in Training: Equip your team with the necessary skills. Training ensures that everyone can effectively use the framework.
- Foster a Collaborative Environment: Encourage open communication and collaboration. A supportive environment enhances problem-solving and innovation.
- Leverage Expert Insights: As Intone Experts suggest, investing in a framework and the expertise to use it positions you well to conquer the business landscape.
- Adopt Best Practices: Stay informed about industry best practices. Implementing proven strategies enhances the effectiveness of your framework.
By following these steps and addressing challenges proactively, you can successfully implement a comprehensive data analysis framework. This structured approach empowers you to make informed decisions and drive business success.
Evaluating and Improving the Data Analysis Framework
To maintain the effectiveness of your data analysis framework, you must focus on continuous evaluation and improvement. This ensures that your framework remains relevant and adapts to changing business needs.
Continuous Improvement
Feedback Mechanisms
Implementing feedback mechanisms is crucial for the ongoing enhancement of your data analysis framework. By gathering input from users and stakeholders, you can identify areas that require improvement. Automated tools can streamline this process by offering detailed analysis of feedback, which helps in quantifying issues for reliable decision-making. Regularly soliciting feedback ensures that your framework evolves in line with user expectations and business objectives.
Iterative Enhancements
Iterative enhancements involve making gradual improvements to your framework based on feedback and performance metrics. This approach allows you to refine processes and tools incrementally, ensuring that changes are manageable and effective. By adopting an iterative mindset, you can continuously optimize your framework, enhancing its efficiency and effectiveness over time. This method also fosters a culture of innovation and adaptability within your organization.
Future Trends in Data Analysis
Emerging Technologies
The landscape of data analysis is rapidly evolving, with emerging technologies playing a significant role. Automation and artificial intelligence (AI) are becoming integral components of modern data analysis frameworks. These technologies enable more efficient data processing and analysis, reducing manual effort and increasing accuracy. Additionally, the rise of real-time analytics and edge computing allows for faster decision-making and improved responsiveness to market changes.
Scientific Research Findings: Studies indicate that frameworks are becoming more modular, with automation and AI playing a bigger role. This trend highlights the importance of staying updated with technological advancements to maintain a competitive edge.
Adapting to Change with FineBI
FineBI stands out as a powerful tool for adapting to these technological changes. It empowers users to leverage emerging technologies effectively, facilitating independent and efficient data analysis. FineBI's self-service capabilities democratize data science, allowing users across the organization to access and analyze data without relying heavily on IT departments. This democratization enhances productivity and fosters a data-driven culture.

FineBI also supports real-time analytics, enabling you to make informed decisions quickly. Its robust data integration capabilities streamline the process of combining data from various sources, ensuring a comprehensive view of your business landscape. By incorporating FineBI into your framework, you can stay ahead of industry trends and adapt to the ever-changing data analysis environment.

A comprehensive data analysis framework is essential for extracting actionable insights and making informed decisions. By implementing such a framework, you can optimize operations and enhance strategic planning. Embrace this structured approach to harness the full potential of your data. As technology evolves, stay adaptable and open to new tools and methodologies. The future of data analysis promises even greater opportunities for innovation and growth. Equip yourself with the right framework today to lead in tomorrow's data-driven world.
Continue Reading About Data Analysis
Understanding Descriptive Analytics: What It Is and How It Works


FAQ

The Author
Lewis
Senior Data Analyst at FanRuan
Related Articles

What Recruiters Look for in a Data Analysis Portfolio: 10 Criteria to Score Yours Fast
A $1 is not judged like a school assignment. It is judged like a hiring shortcut. Recruiters, hiring managers, and analytics leads use it to answer one question fast: Can this person solve business problems with data in
Lewis Chou
May 29, 2026

What Is Data Analytics Consulting? Beginner’s Guide to Services, Deliverables, and Business Value
$1 helps organizations turn raw data into decisions they can trust. For many business leaders, the challenge is not a lack of data. It is a lack of clarity. Reports conflict, teams track different KPIs, dashboards are un
Lewis Chou
Jun 03, 2026

Data Analyst Job Description [+2026 Guide]: Compare Responsibilities, Skills, and Salary by Industry
A strong $1 does more than list tasks. It defines how a company turns raw data into business decisions, which teams the analyst supports, and what measurable outcomes the role is expected to influence. For employers, tha
Lewis Chou
Jun 02, 2026