MIS reporting is the process of turning scattered operational, financial, and compliance data into structured, decision-ready dashboards that managers can actually use. For enterprise teams, the business value is straightforward: less time chasing numbers, fewer disputes over whose spreadsheet is correct, and faster decisions on performance, risk, and resource allocation. If you are an IT manager, operations director, finance lead, or data analyst, the real pain is not lack of data. It is fragmented systems, inconsistent metrics, manual reporting cycles, and dashboards that show activity without telling people what to do next.
All reports in this article are built with FineReport.
MIS reporting (Management Information System reporting) is the process of collecting, validating, standardizing, and delivering structured reports that support management decision-making. It is not a single document or a software product — it is an organizational workflow that turns raw operational data into decision-ready information.
The "MIS" in MIS reporting refers to the system layer that aggregates data from multiple business functions — finance, sales, operations, HR, compliance — into a unified reporting framework. The "reporting" refers to the recurring cycle of extraction, transformation, formatting, validation, distribution, and review.
Key characteristics of effective MIS reporting
Recurring cadence: Daily, weekly, monthly, or quarterly — not ad hoc.
Standardized format: Consistent structure, definitions, and calculations across periods.
Multi-source integration: Data drawn from ERP, CRM, HRIS, billing, production, and other systems.
Role-based distribution: Different stakeholders receive different views based on their responsibilities.
Governed and auditable: Data lineage, access controls, and change tracking ensure trust.
MIS reporting answers the question: "What is happening across the organization, and what should management do about it?"
MIS Reporting vs MIS Report vs Business Reporting
These terms are frequently used interchangeably, but they describe different things. Confusing them leads to misaligned expectations and poorly scoped projects.
Term
Meaning
Best Use
MIS reporting
The process of collecting, standardizing, and delivering management reports
MIS reporting vs MIS report: MIS reporting is the process; an MIS report is the output. You design an MIS reporting system to produce MIS reports. One is a workflow; the other is a deliverable.
MIS reporting vs business reporting: Business reporting is a broader category that includes any report used in business — from marketing campaign summaries to project status updates. MIS reporting specifically refers to standardized, recurring management reports that integrate cross-functional data for operational and strategic decisions.
MIS reporting vs BI dashboards: MIS reporting traditionally produces formatted, static or scheduled reports (PDF, Excel, email). BI dashboards provide interactive, real-time visualizations with drill-down capability. Modern organizations use both: MIS reports for formal periodic reviews and regulatory submissions; BI dashboards for daily monitoring and self-service exploration. They are complementary, not competing.
MIS reporting is not optional for organizations operating at scale. Its absence creates measurable operational damage:
Delayed decisions. When managers wait days for manually compiled reports, they react to last week's problems instead of preventing this week's.
Inconsistent numbers. When finance, sales, and operations each maintain their own spreadsheets, meetings devolve into debates about whose numbers are correct rather than what to do.
Compliance risk. Regulators, auditors, and boards require standardized, timely reports. Manual processes introduce errors and miss deadlines.
Wasted analyst time. Skilled analysts spending 80% of their time compiling reports have only 20% left for actual analysis. Automation reverses this ratio.
Strategic blind spots. Without integrated cross-functional reporting, leadership cannot see how operational changes affect financial outcomes or how HR trends impact service delivery.
Effective MIS reporting creates a single source of truth that aligns departments, accelerates decisions, ensures compliance, and frees analytical talent for higher-value work.
MIS Reporting Process: From Raw Data to Decision-Ready Reports
A strong mis reporting process is less about chart design and more about disciplined transformation. Enterprise teams typically move through three stages: define the question, build a trusted pipeline, and present metrics in a way that drives action.
Start with clear business questions and reporting goals
The first mistake many teams make is building dashboards before agreeing on the decisions those dashboards should support. A decision-ready dashboard begins with a business question.
Examples include:
Are we on track to hit quarterly revenue targets?
Which plants are missing service-level commitments?
Where are compliance exceptions rising?
Which facilities carry the highest maintenance risk?
What operational bottlenecks are increasing cost or delay?
From there, define three things:
Audience: Executive team, department heads, frontline managers, compliance officers, or analysts
Decision type: Operational, financial, compliance, strategic, or cross-functional
Cadence: Real-time, daily, weekly, monthly, quarterly, or annual
Every metric on the dashboard should map to a business objective. For example:
Operational objective: Reduce turnaround time
Financial objective: Improve gross margin
Compliance objective: Maintain audit readiness
Strategic objective: Allocate capital to high-performing units
If a metric has no decision attached to it, it probably does not belong on the dashboard.
Source system identification: ERP, CRM, MES, HRIS, finance tools, APIs, Excel, or external datasets
Data extraction: Pull data on a fixed schedule or in near real time
Standardization: Align naming, units, date logic, organizational hierarchies, and business definitions
Cleaning: Remove duplicates, fill or flag missing values, correct format errors
Validation: Confirm totals, balances, relationships, and completeness
Ownership: Assign responsibility for each data domain and metric
Refresh schedules: Define how often each report updates and who monitors failures
This is where many enterprise reporting programs break down. Teams rely on disconnected spreadsheets, inconsistent exports, and unowned transformations. The result is low trust. Once trust is lost, even accurate dashboards get ignored.
A mature pipeline creates a unified data foundation. That means one reporting language across the business, not separate versions of “revenue,” “headcount,” or “utilization” by department.
Turn metrics into dashboards people can act on
Once the data is reliable, the dashboard must be designed for action, not decoration. The purpose of MIS reporting is not to show every available number. It is to surface the right signals at the right time.
Effective dashboards usually include:
KPI cards for headline performance
Trend lines to show movement over time
Threshold indicators to flag underperformance or risk
Breakdowns by business unit, region, product, or facility
Exception views to highlight outliers quickly
Drill-down paths to investigate causes
Commentary or recommended actions to support decision-making
The best dashboards answer three questions immediately:
What is happening?
Why is it happening?
What should we do next?
Without those answers, a dashboard is just a screen full of charts.
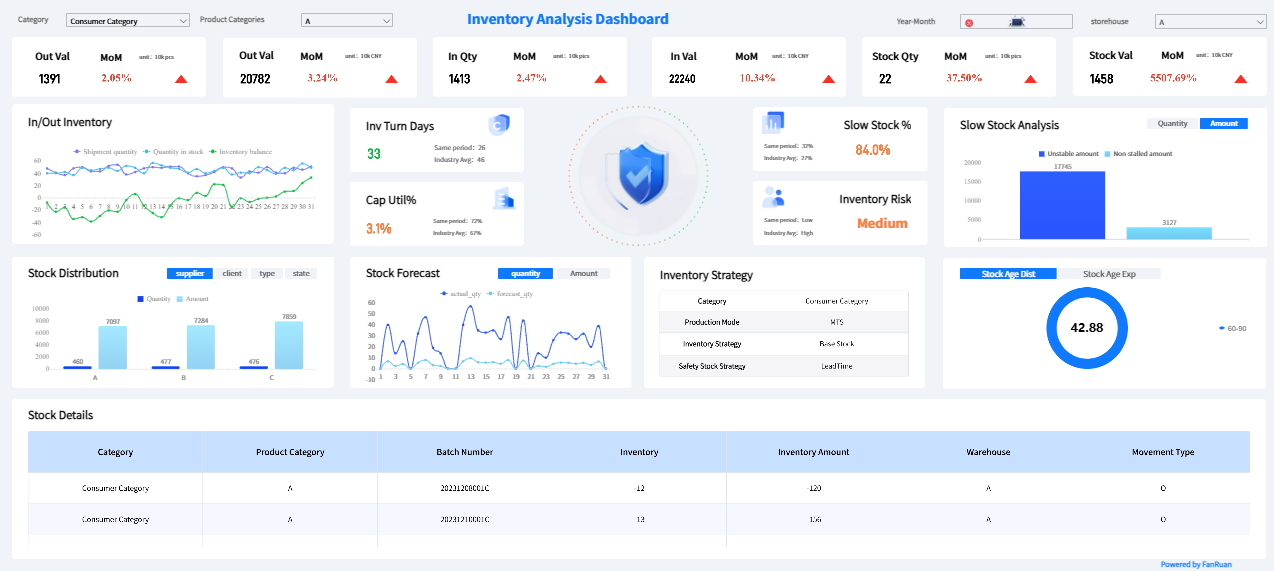
Operational reports track process-level metrics: order fulfillment cycle time, production yield, SLA adherence, backlog volume. They enable frontline managers to identify and resolve issues within hours.
Financial reports
Financial reports consolidate revenue recognition, expense tracking, budget variance, cash flow, and profitability by segment. They support both internal management and external regulatory obligations.
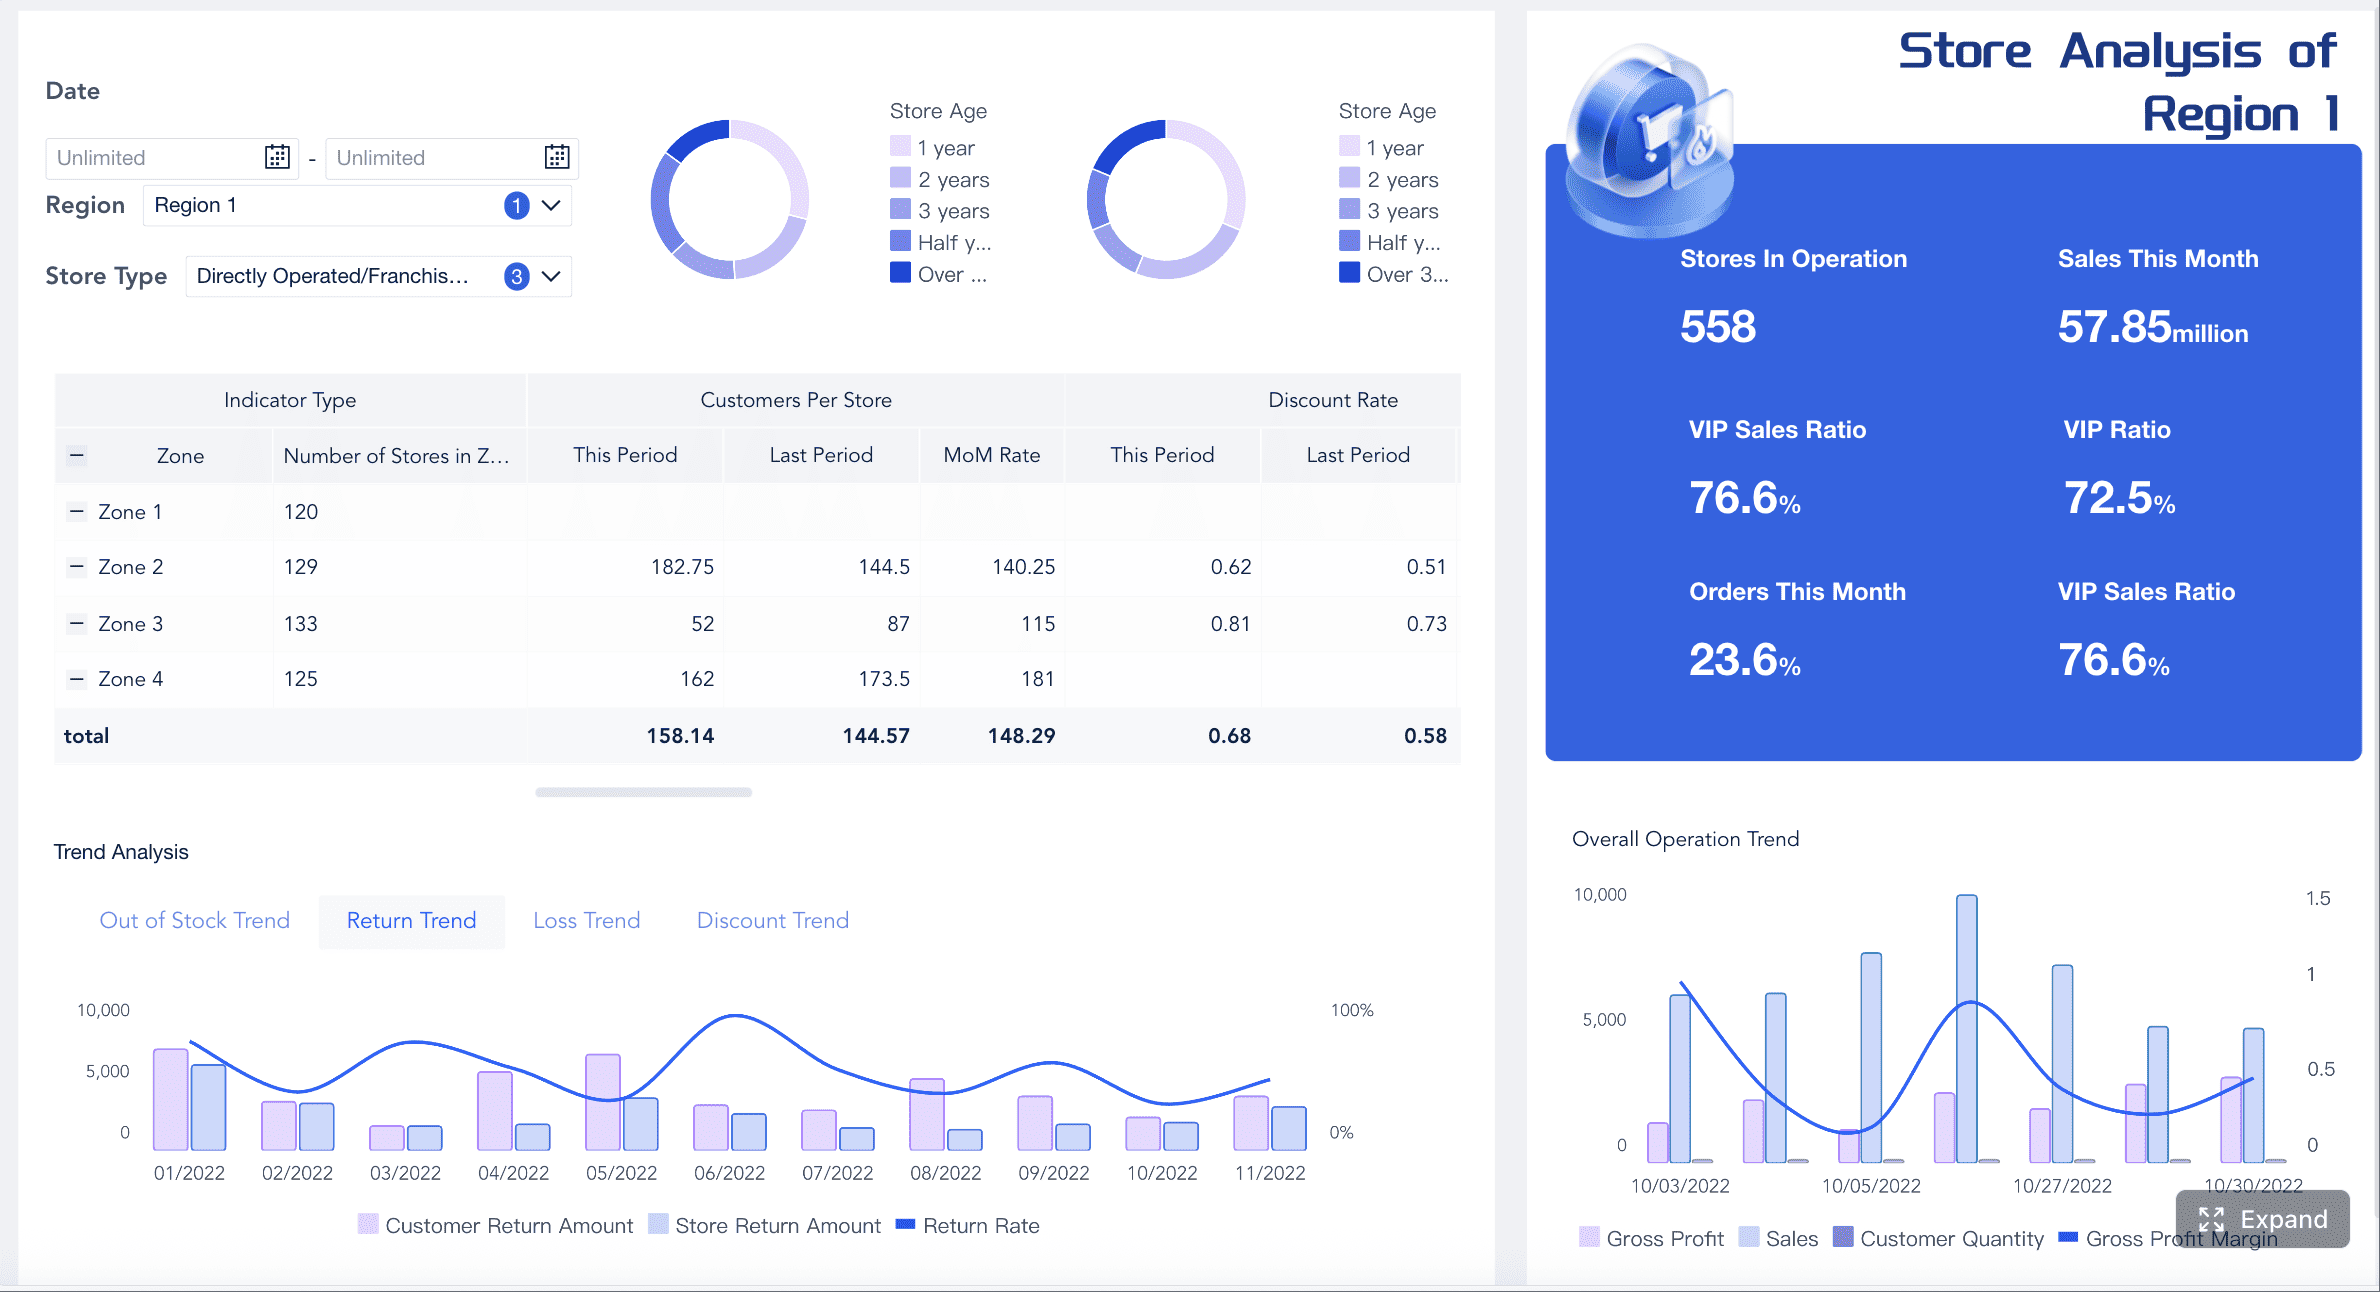
Sales reports
Sales reports provide visibility into pipeline health, conversion rates, forecast accuracy, and territory performance. They inform resource allocation and quota setting.
HR reports
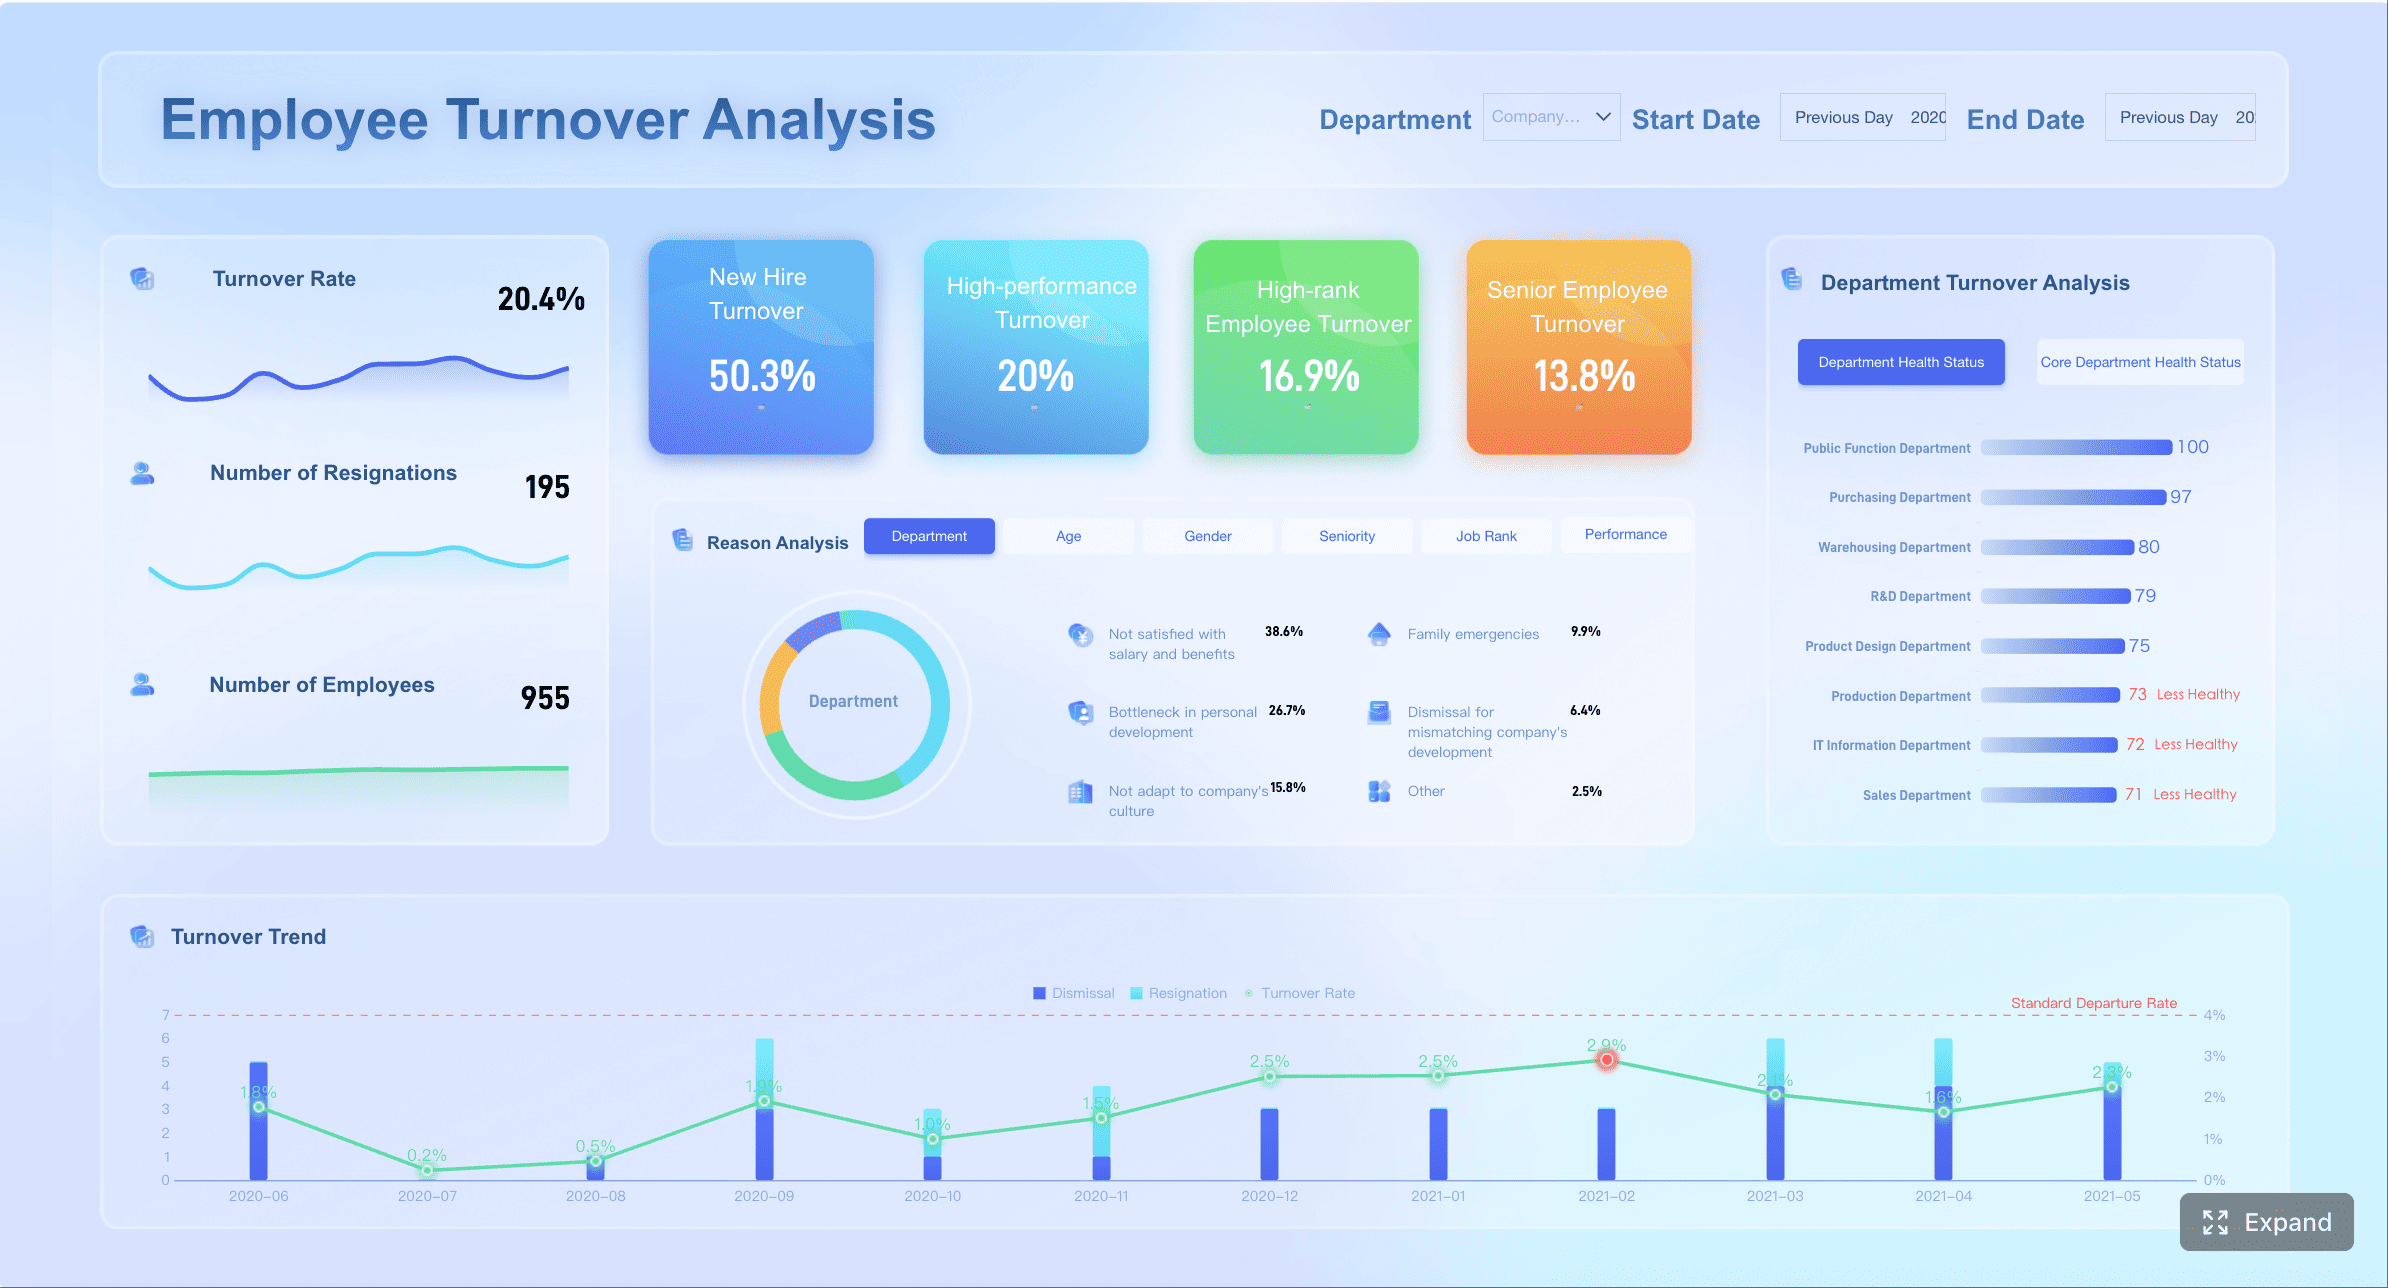
HR reports monitor workforce dynamics: headcount changes, absenteeism, turnover rates, training completion, and diversity metrics. They support workforce planning and organizational health assessment.
Compliance reports
Compliance reports document adherence to regulatory requirements, internal policies, and audit findings. They protect the organization from legal and reputational risk.
MIS Reporting Examples
Concrete examples clarify what MIS reporting looks like in practice:
Example 1: Monthly Financial Performance Report
Consolidates P&L by business unit, compares actuals to budget and prior year, highlights variances exceeding 5%, and includes narrative commentary from finance leadership. Distributed to executives and board members via scheduled PDF on the 3rd business day of each month. Built with FineReport; data integrated from ERP via FineDataLink.
Example 2: Weekly Sales Pipeline Dashboard
Shows pipeline value by stage, win rate trend over 12 weeks, forecast vs. actual by region, and top 10 deals at risk. Interactive filters allow drilling into individual reps or product lines. Accessed via FineBI web portal; refreshed daily from CRM.
Example 3: Daily Operations Scorecard
Displays order cycle time, on-time delivery rate, defect rate, and backlog count by production line. Color-coded thresholds trigger alerts when metrics breach targets. Auto-emailed to plant managers at 7:00 AM; available in FineBI for ad-hoc exploration.
Example 4: Quarterly HR Workforce Report
Summarizes headcount by department, turnover rate by tenure band, open requisitions aging, and training hours per employee. Formatted for HR committee review; exported to Excel for detailed analysis. Generated by FineReport with data from HRIS.
Example 5: Annual Compliance Audit Report
Documents access control logs, data retention compliance, policy exception tracking, and remediation status. Formatted per regulatory template; submitted to auditors with supporting evidence. Produced by FineReport with audit trail metadata.
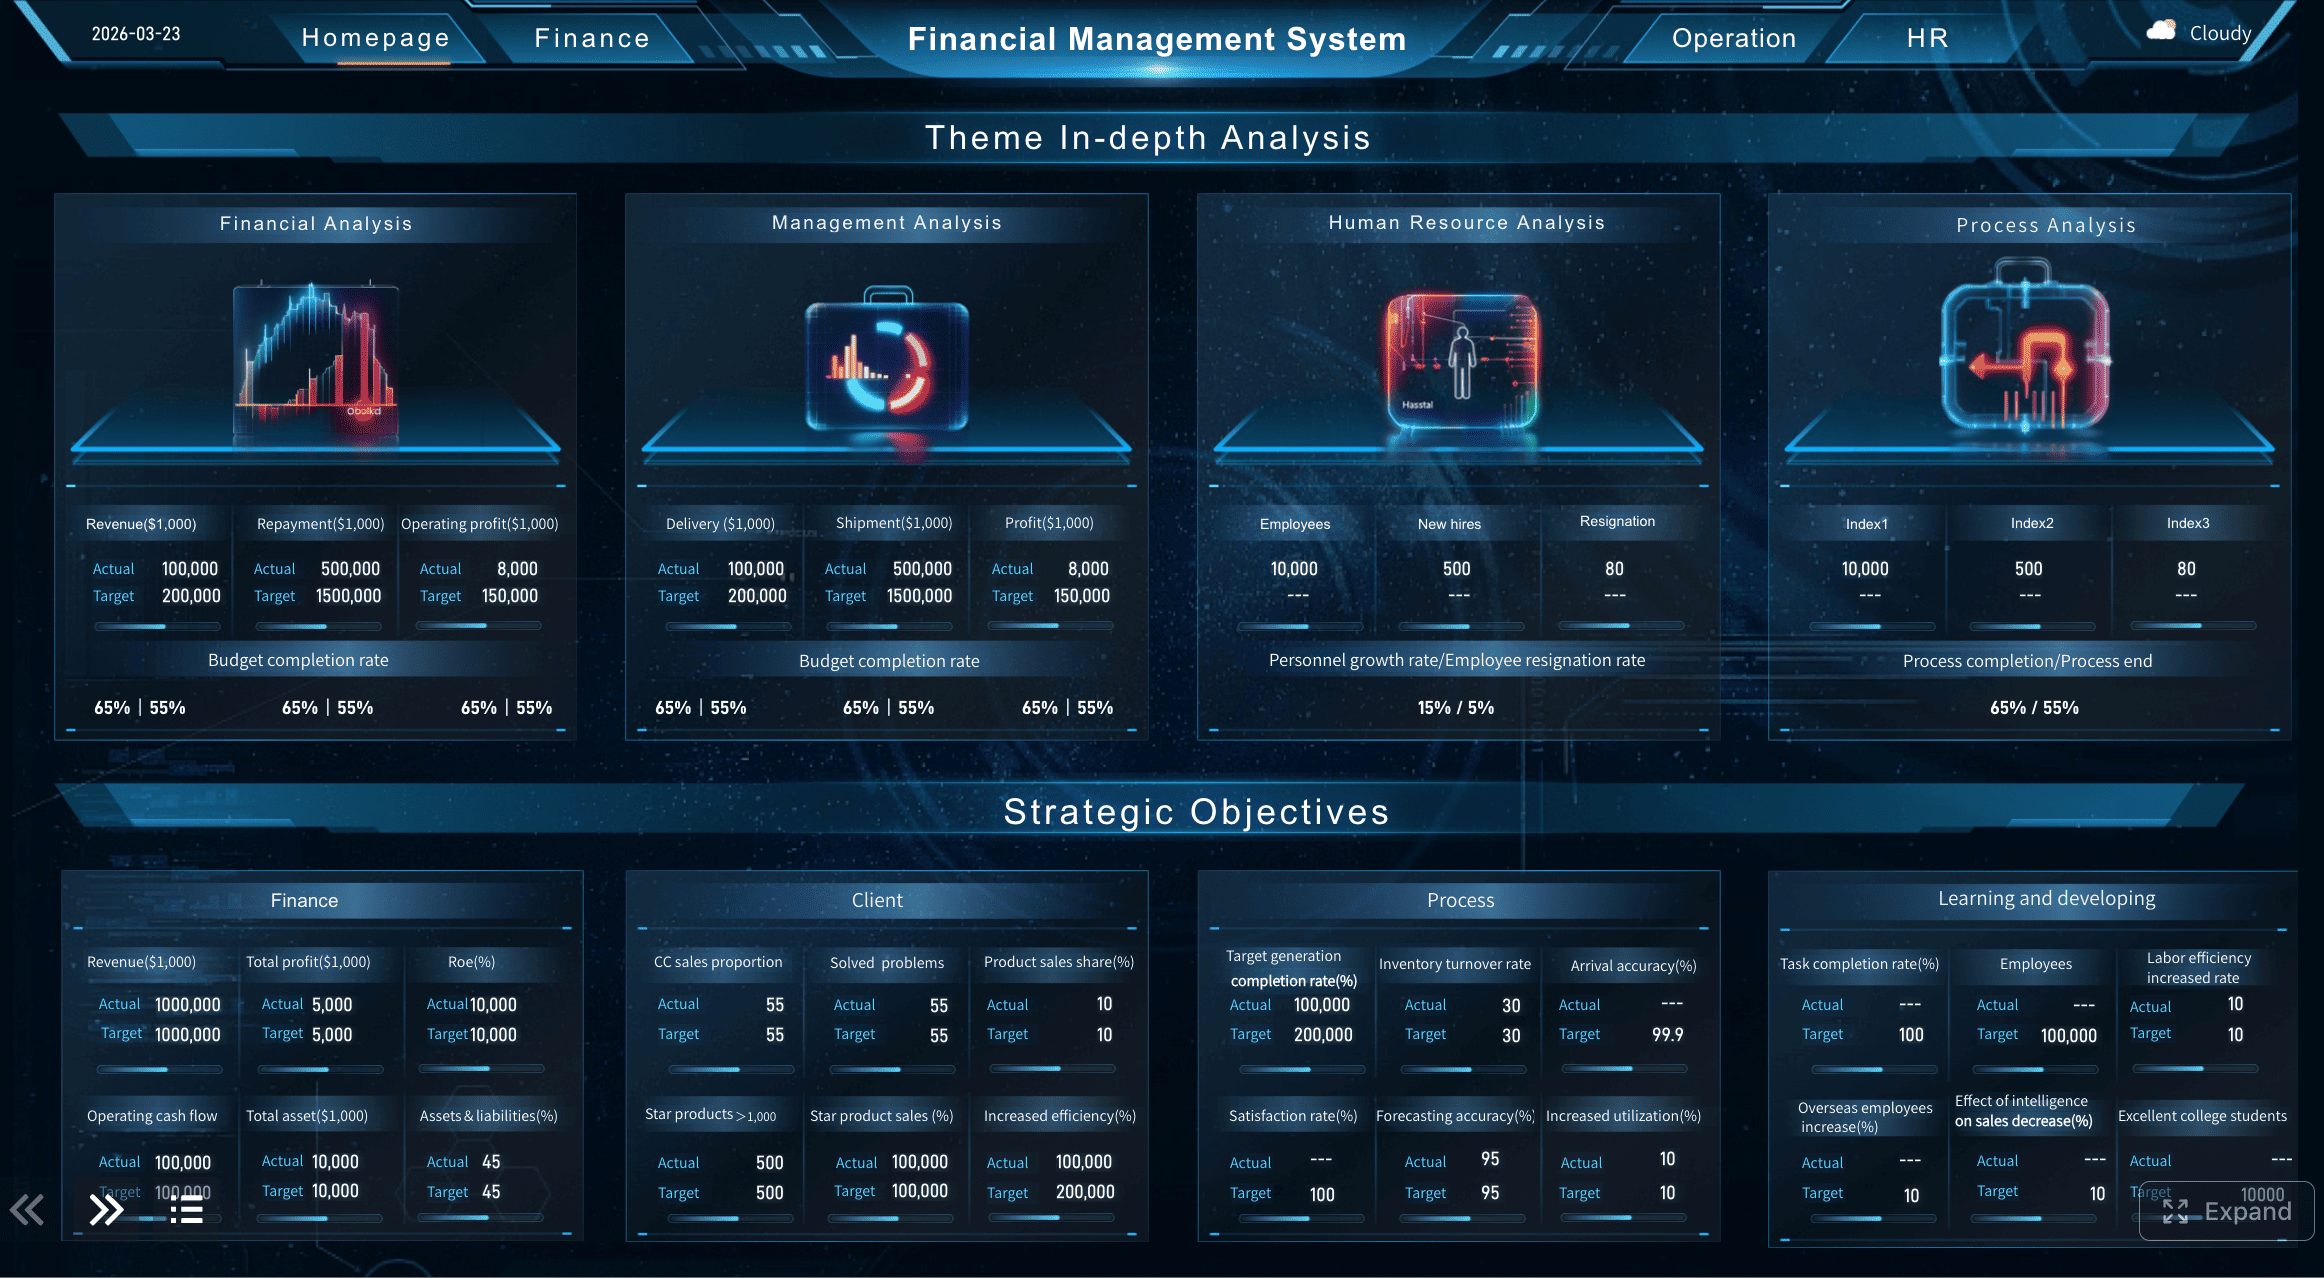
One dashboard per functional area. Avoid cramming all KPIs into a single view. Executives need a consolidated scorecard; department managers need functional depth.
Lead with exceptions. Highlight metrics that breach thresholds. Managers should see problems first, normal performance second.
Enable drill-down. Summary KPIs must link to underlying detail. A revenue number without segment breakdown is decorative, not actionable.
Show trend, not just snapshot. Current-period values lack context. Always include trend lines (week-over-week, month-over-month, year-over-year).
Respect access boundaries. Finance dashboards should not expose HR salary data. Enforce row-level and column-level security aligned with organizational roles.
MIS Reporting Tools: What to Look For
Selecting MIS reporting tools is a strategic decision that affects data accuracy, reporting speed, user adoption, and long-term maintenance cost. Evaluate candidates against these criteria:
Capability
Why It Matters
Multi-source data integration
MIS reporting requires data from ERP, CRM, HRIS, billing, and more. Native connectors reduce custom development.
Automated scheduling and distribution
Manual report compilation defeats the purpose. Tools must generate and deliver reports on schedule without human intervention.
Pixel-perfect formatting
Board reports, regulatory submissions, and client-facing documents require precise layout control that drag-and-drop BI tools cannot provide.
Interactive dashboards
Operational teams need real-time exploration, filtering, and drill-down beyond static reports.
Role-based access control
Different stakeholders see different data. Row-level and column-level security are non-negotiable.
Audit trails and governance
Every report generation, access event, and data change must be logged for compliance and troubleshooting.
Mobile accessibility
Managers need access outside the office. Responsive design or native mobile apps extend reach.
AI-assisted analysis
Natural language Q&A and automated summarization extend reporting value to non-technical users.
No single tool excels at everything. Many organizations combine a formatted reporting engine (for scheduled, pixel-perfect reports) with a BI platform (for interactive dashboards) and a data integration layer (to connect sources). FanRuan's stack covers all three: FineDataLink for integration, FineReport for formatted reporting, and FineBI for interactive dashboards.
MIS Reporting Best Practices
Implement these practices to maximize MIS reporting effectiveness and avoid common pitfalls:
Start with decisions, not data. Define what decisions each report supports before building anything. Reports without decision linkage become shelfware.
Standardize metric definitions enterprise-wide. Create and maintain a metric dictionary. Resolve disputes about calculation methodology before automating.
Automate everything repeatable. If a report is generated more than twice manually, automate it. Human effort should focus on analysis, not compilation.
Enforce data governance from day one. Access controls, audit trails, and data lineage are not optional add-ons. They are foundational requirements.
Design for the audience. Executives need summaries with exception highlighting. Analysts need detail with export capability. Frontline managers need real-time operational views. One format does not fit all.
Review and retire regularly. Unused reports consume maintenance resources and create noise. Conduct quarterly usage reviews and sunset reports that no longer serve decisions.
Validate against source systems. Periodically reconcile report outputs with source system data. Trust erodes instantly when numbers are wrong, and recovery takes months.
Invest in change management. New reporting systems change workflows. Train users, document processes, establish feedback channels, and measure adoption.
How FineReport Automates MIS Reporting
FineReport is FanRuan's enterprise reporting platform designed specifically for the demands of MIS reporting. It addresses the gaps between generic BI tools and the structured, formatted, governed reporting that enterprises require:
MIS Reporting Need
FineReport Capability
Pixel-perfect formatted reports
Drag-and-drop designer with precise layout control for board packs, regulatory submissions, and client-facing documents
Automated scheduling and distribution
Built-in scheduler delivers reports via email, FTP, web portal, or API on any cadence
Multi-source data integration
Native connectors to databases, APIs, and files; integrates with FineDataLink for complex ETL/CDC pipelines
Role-based access and security
Row-level, column-level, and parameter-level permissions; LDAP/SSO integration
Audit trails
Complete logging of report generation, access, and export events
Parameterized and dynamic reports
Users filter and customize reports at runtime without IT involvement
Print-ready and export formats
PDF, Excel, Word, HTML, image output with print optimization
Mobile viewing
Responsive report rendering for smartphones and tablets
FineReport does not replace BI dashboards. It complements them. Use FineReport for formal, recurring, formatted MIS reports that require precision and governance. Use FineBI for interactive exploration and real-time monitoring. Together, they cover the full spectrum of enterprise reporting needs.
From MIS Dashboards to Dora AI Data Agent
MIS dashboards show managers what is happening across finance, operations, sales, HR, and compliance. Dora helps business users ask follow-up questions, summarize weekly changes, detect unusual KPI movements, and receive role-based briefings based on governed reports, dashboards, and trusted business data.
How Dora extends MIS reporting value
Natural language Q&A: "What was our claim denial rate last month compared to the prior quarter?" answered instantly from governed dashboard data, without building a new report.
Automated weekly summaries: Executive briefing auto-generated from key MIS dashboards, highlighting notable variances, trend shifts, and exceptions requiring attention.
Anomaly detection and explanation: Alert when budget variance exceeds threshold or turnover rate spikes, with contextual analysis of contributing factors.
Role-based briefings: Department heads receive personalized summaries relevant to their KPIs, replacing generic all-staff reports.
Follow-up analysis: After reviewing a financial MIS report, ask "Which business unit drove the largest margin decline?" without requesting a new custom report from IT.
Integration with FanRuan's reporting stack
Dora connects to the same governed data layer that powers FineReport and FineBI. It does not access raw source systems directly. This ensures that AI-generated insights are consistent with official MIS reports and subject to the same access controls and audit trails. The progression is: FineDataLink integrates data → FineReport produces formatted reports → FineBI enables interactive dashboards → Dora adds AI-assisted Q&A and summarization on top of trusted, governed outputs.
FAQs
MIS reporting is the process of turning data from systems like ERP, CRM, finance tools, and spreadsheets into structured reports and dashboards for management decisions. Its goal is to give leaders a consistent, trusted view of performance, risk, and operations.
Raw data is unprocessed transactional information, while MIS reporting organizes and summarizes that data into decision-ready metrics and dashboards. Analytics usually goes a step further by exploring causes, patterns, and forecasts in more depth.
A strong MIS dashboard should include clearly defined KPIs, standardized business definitions, relevant filters, and thresholds that show when action is needed. It should be tailored to the audience, decision type, and reporting cadence.
The most common challenges are fragmented source systems, inconsistent metric definitions, poor data quality, and too much manual reporting work. Without governance and a reliable data pipeline, teams often end up debating numbers instead of acting on them.
Teams can improve MIS reporting by standardizing KPIs early, automating data collection, cleaning and validation, and using a single source of truth for shared metrics. Tools like FineReport can also help reduce manual effort and speed up dashboard delivery.
Product Trial
FineReport
Pixel-perfect reports · Interactive dashboards · Easy data entry · Digital twins

 FineReport's Data Connection
 FineReport's Mobile Accessibility


