You rely on a summary report to transform overwhelming data into clear insights that drive smart choices. A summary distills complex figures, trends, and details, helping you see what matters most. As more organizations demand fast, accurate reporting, tools like FineReport have become essential for creating effective summaries.
- Over the past five years, companies have rapidly increased their use of reporting tools.
- In 2024, almost half of businesses use BI analytics, and by 2025, most will depend on SaaS-based summary solutions.
Summary Report Basics
What Is a Summary Report
You often encounter a summary report when you need to understand large amounts of information quickly. A summary report condenses complex data or lengthy documents into a clear, concise format. This type of business report helps you focus on the most important points, making it easier to identify trends, issues, and solutions. FineReport allows you to create summary reports that present essential details in a visually appealing and organized way.
Here is a quick overview of what defines a summary report:
| Definition | Description |
|---|---|
| Summary Report | A concise synthesis of larger documents or datasets, presenting significant information in a digestible format. |
| Purpose | To distill the essence of content for quick understanding by decision-makers. |
| Structure | Includes goals, performance analysis, key issues, and potential solutions, often using visual aids. |
| Key Features | Contains key points, main ideas, and important details from longer documents, ensuring clarity and accessibility. |
| Goal | To present crucial details in a concise and understandable format. |
Key Features
A high-quality summary report stands out because it organizes information in a way that supports quick decision-making. You will notice that effective summary reports use a structured format tailored to your audience. They present information in a logical sequence, making it easy for you to follow the flow of data. Consistency in layout and style ensures that every summary report maintains professionalism and clarity.
Summary reports are essential in business because they help you communicate findings, track progress, and highlight key issues. FineReport enhances these features by letting you design summary reports with pixel-perfect formatting, interactive charts, and real-time data integration. This means you can deliver business reports that are both informative and visually engaging.
Executive Summary
You might wonder how an executive summary differs from a summary report. An executive summary is a brief section at the beginning of a business report. It highlights the main findings, recommendations, and conclusions, allowing busy executives to grasp the core message without reading the entire document. In contrast, a summary report covers the main points of a larger dataset or document, often including more detailed analysis and supporting visuals.
FineReport gives you the flexibility to create both summary reports and executive summaries. You can use its drag-and-drop designer to ensure each summary is clear, concise, and visually consistent. Whether you need a detailed summary report or a short executive summary, FineReport helps you communicate your message effectively.
Summary Report Benefits

Decision-Making
You make better choices when you have access to a clear summary report. This type of summary helps you focus on key points and trends, allowing you to act quickly and confidently. When you use a summary report, you see the most important information at a glance. You avoid getting lost in details and can spot issues before they become problems.
FineReport supports your decision process by providing real-time data, automated updates, and interactive dashboards. These features help you respond faster to changes and reduce negative surprises. The table below shows how organizations improve their decision-making with summary reports:
| Improvement Area | Percentage Improvement |
|---|---|
| Negative surprises | 17% fewer |
| Response time to issues | 23% faster |
Companies that rely on summary reports often see their revenue growth rate more than double and their employment growth rate increase four times faster. When you embrace informed decision-making, you replace guesswork with data-driven actions. You also shorten development cycles and improve success rates for new projects.
The SAMOA customer story shows how a summary report can transform business operations. SAMOA unified its data and automated reporting with FineReport. As a result, managers now make decisions based on accurate, timely summaries. This change led to faster performance reviews and more reliable bonus calculations.
Communication
A summary report improves communication across your team. You share key points and findings in a format everyone understands. This summary reduces miscommunication and helps your team stay aligned. When you present a summary report, you make it easier for others to see what matters most.
Project teams often struggle with miscommunication. Studies show that 31% of project failures come from poor communication. A well-crafted summary report enhances transparency and collaboration. You use predictive intelligence in your summary to help your team make clear decisions and avoid confusion.
FineReport makes communication easier by letting you design summary reports with pixel-perfect formatting and interactive charts. You can share these summaries with your team in real time, using dashboards and scheduled email notifications. The financial management solution from FineReport helps companies present complex financial data in a summary that non-financial managers can understand. This approach improves cross-department collaboration and ensures everyone works toward the same goals.
Efficiency
You save time and resources when you use a summary report. Automation and real-time data integration help you reclaim hours each week. On average, organizations save 8 hours per week with automated summary reporting tools like FineReport. Some companies report saving up to 20 hours per week, which adds up to over 1,000 hours each year for small teams.
Here are some of the most significant efficiency gains:
- Automation reduces data discrepancies by over 50%, making your analytics more reliable.
- Real-time analytics improve campaign responsiveness by up to 40%.
- Retailers using automation cut costs by 22%, compared to 8% for those who do not.
- Staff can focus on higher-value work, speeding up processes and improving customer experiences.
- 36.6% of companies report a cost reduction of at least 25% due to automation.
- 48.6% of companies indicate that automation has improved efficiency by 25% or more.
FineReport helps you achieve these gains with features like drag-and-drop report design, scheduled reporting, and mobile dashboards. You create summary reports that deliver key points quickly and accurately. The SAMOA case and the financial management solution both show how summary reports streamline operations and free up time for strategic work.
When you use a summary report, you improve decision-making, enhance communication, and boost efficiency. You focus on key points, act faster, and help your organization grow.
Create Summary Report
Steps to Create
You can approach summary report creation with a clear process that ensures your summary is both effective and easy to understand. Start by reading the full document or dataset. Identify the main points and key data. Organize your findings in the same order as the original content. Keep your summary short—ideally one or two pages. Use language that matches your audience and highlight the most important issues. End with a clear next step or recommendation. Many experts suggest you write the summary last, after you have a full understanding of the material.
Tip: Always check your summary for structure and formatting. A well-organized summary helps readers find information quickly.
Best Practices
To create a summary that stands out, focus on clarity and relevance. Use simple language and avoid complex terms. Present information in a logical order. Make sure your summary has a clear structure, with headings and bullet points if needed. Keep your presentation simple so you do not overwhelm your audience. Use visuals like charts or graphs to make complex data easier to understand. Always validate your data to ensure accuracy. Tailor your summary to your audience and highlight key benefits. Avoid writing the summary before the main document, making it too long, or omitting a clear next step.
Remember: Research shows that people remember 42% more when you use visual materials. Visual aids help your audience grasp ideas quickly and retain information longer.
FineReport Tools
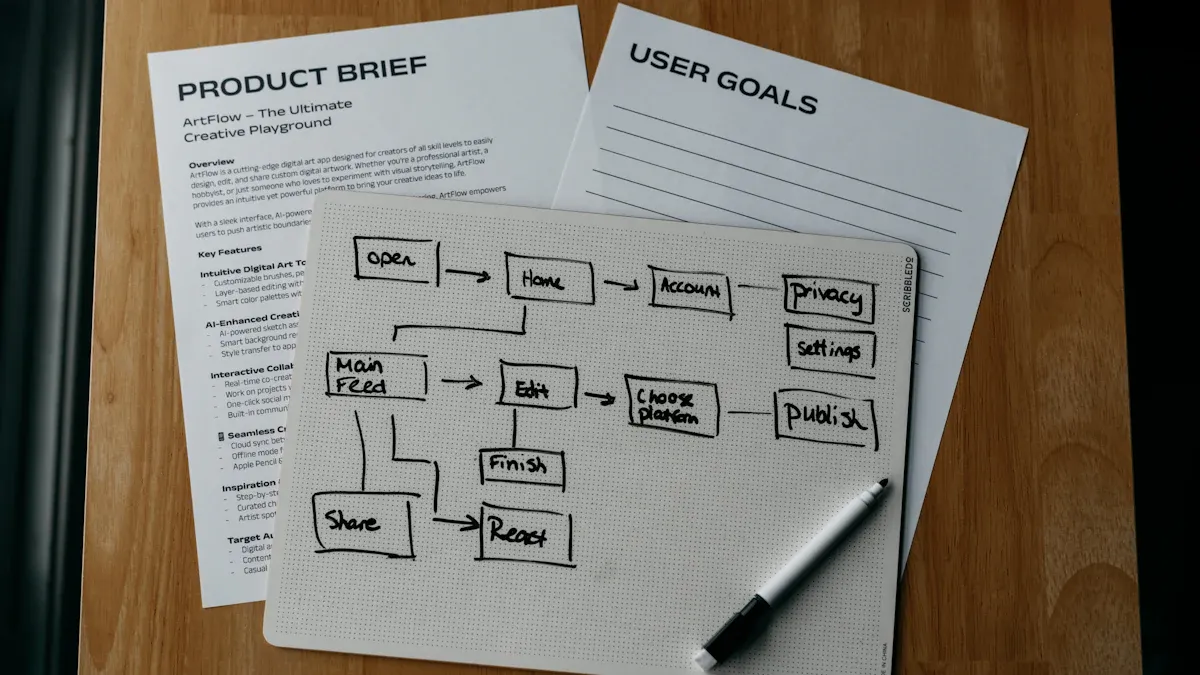
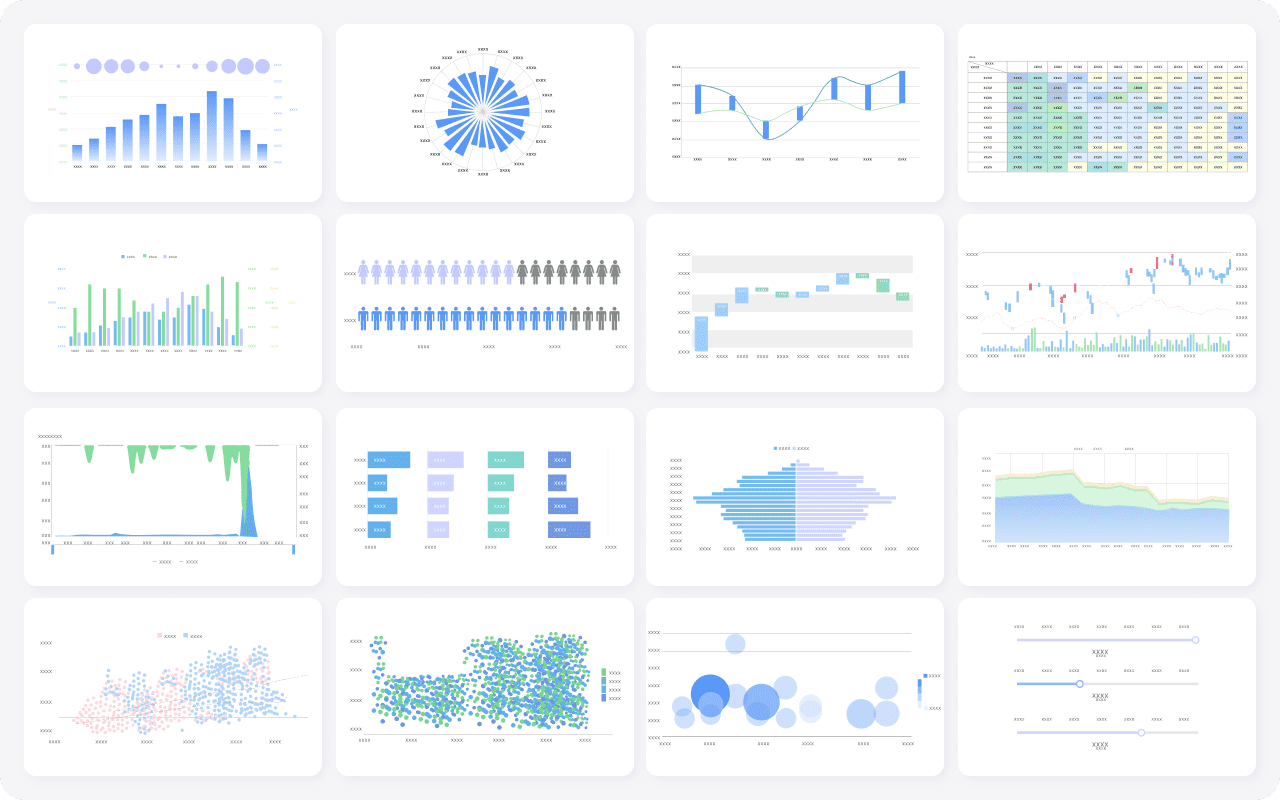
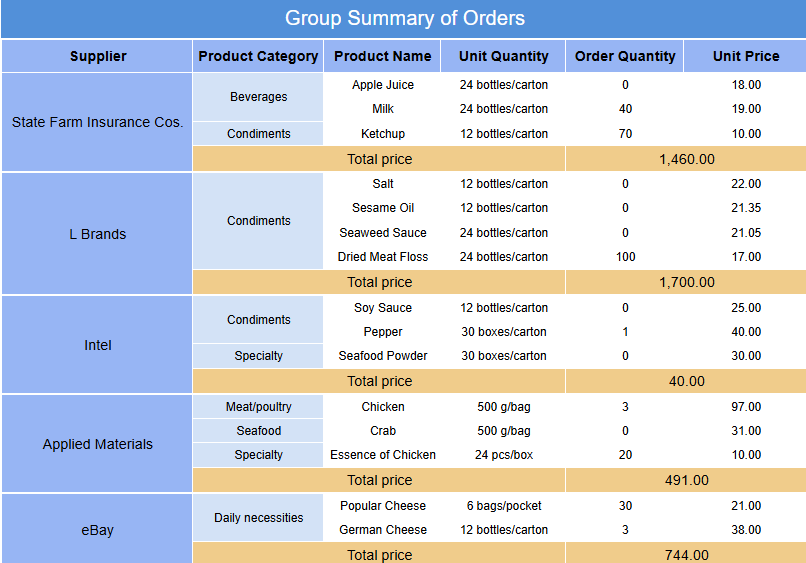
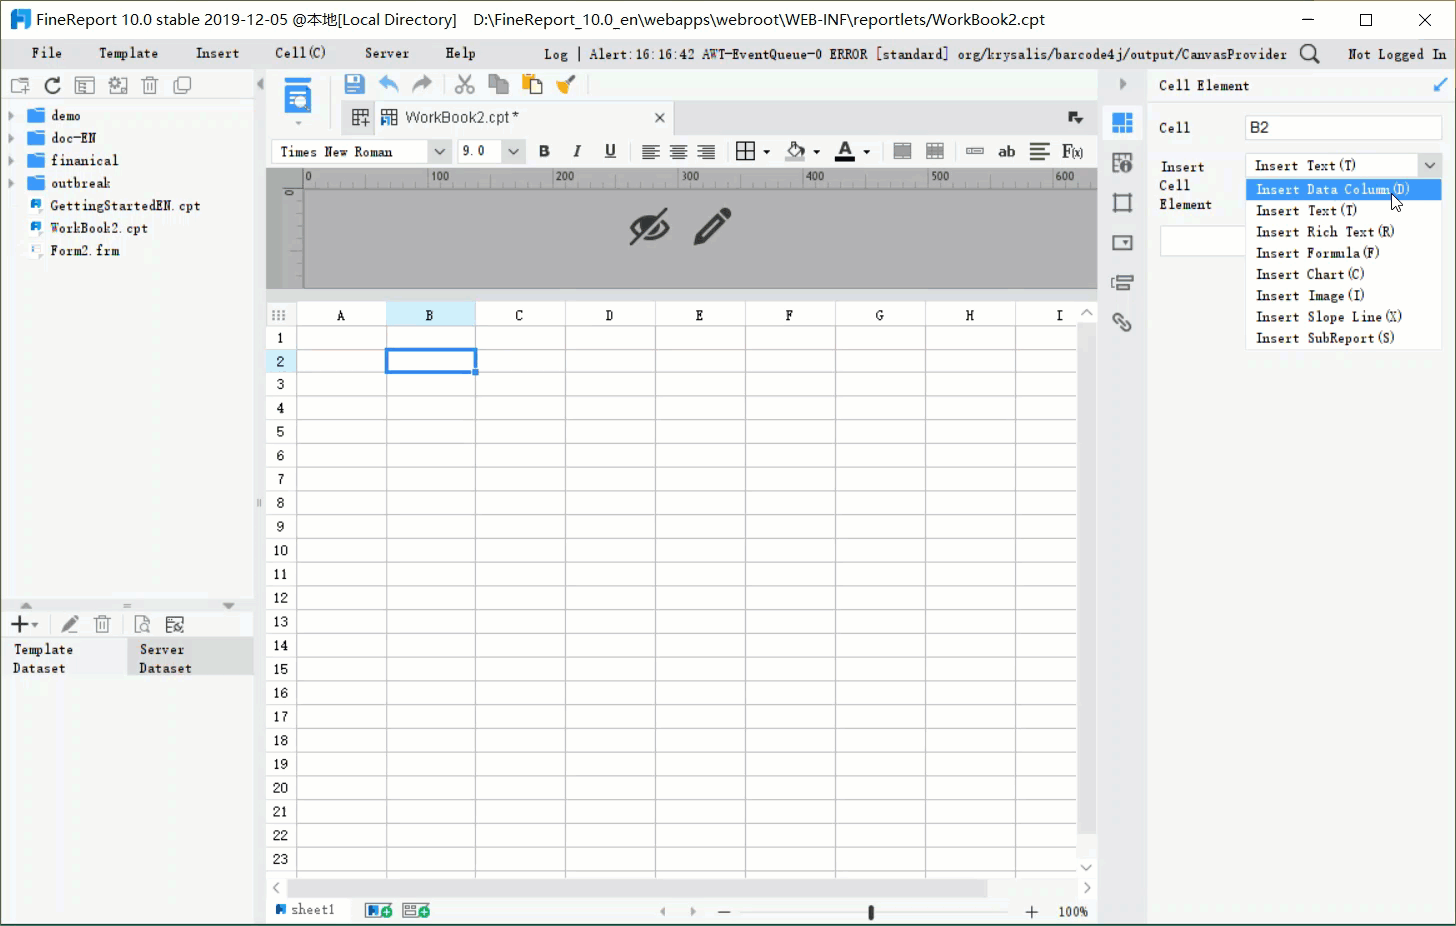
FineReport streamlines summary report creation with a flexible report designer and drag-and-drop features. You can choose from templates like normal reports, aggregation reports, and dashboards. These templates help you present a concise synthesis of your data. FineReport offers diverse visualization types, interactive analysis, and real-time data entry. You can integrate data from multiple sources and deploy reports across different platforms. Dashboards in FineReport allow you to filter, drill down, and customize views for specific business needs. Scheduled reporting ensures your summary reaches the right people on time. The decision-making platform supports you in turning your summary into actionable insights.
| Feature | Description |
|---|---|
| Flexible Report Designer | Drag-and-drop creation of reports and dashboards |
| Visualization Types | Charts, graphs, and other visuals for better data presentation |
| Interactive Analysis | Dynamic data exploration and filtering |
| Templates | Normal, aggregation, and dashboard layouts |
| Scheduled Reporting | Automated delivery of summary reports |

You rely on a summary to make sense of complex business data and drive better decisions. Research shows that a summary helps you share information efficiently, save time, and improve comprehension. When you use a summary, you clarify goals, boost competitiveness, and prepare for future challenges. FineReport empowers you to create impactful summary and executive reports with interactive dashboards and strong data connectivity. You can apply best practices by structuring your summary logically, customizing it for your audience, and using compelling visualizations. A clear summary sets the foundation for growth and innovation.
| Key Takeaway | Description |
|---|---|
| Audience Analysis | A summary lets you tailor information for your readers, making it easy to find what matters. |
| Management Info | A summary condenses findings for management, ensuring clarity and focus. |
Remember: When you master summary reporting, you unlock the power to communicate, plan, and lead with confidence.

Continue Reading About Summary Report
What Is a Quarterly Report and Why Investors Should Care
How to Use Inventory Report for Better Business Decisions
How to Build a Service Report Template for Your Business
What Is a Research Report and Why Does It Matter


FAQ

The Author
Lewis
Senior Data Analyst at FanRuan
Related Articles

Financial Reporting Valuation Explained: A Practical Guide to ASC 820, ASC 805, ASC 350, and ASC 718
$1 valuation is the process companies use to measure assets, liabilities, equity instruments, and reporting units for compliant $1. For CFOs, controllers, finance directors, and audit facing accounting teams, the challen
Yida Yin
Jun 25, 2026

Best Ad Reporting Tool in 2026: 8 Options Compared for Marketers and Analysts
$1 is an $1 and dashboard platform that helps teams unify ad data, build highly customized reports, and automate distribution at scale. 8 ad reporting tool options compared 1. DashThis One sentence overview: DashThis is
Yida YIn
Jun 25, 2026
Office 365 Reporting Tool Guide: Track Usage, Security, and License Waste in One Dashboard
An office 365 $1 should do more than generate static usage charts. For IT managers, operations leaders, and Microsoft 365 administrators, the real value is operational visibility: who is actually using the platform, wher
Yida Yin
Jun 25, 2026