A report serves as a structured way to communicate information clearly and effectively. Whether in professional or academic settings, it helps you present data, analysis, and conclusions in an organized manner. A standard report writing format includes essential sections like the Title Page, Abstract, Table of Contents, Introduction, Body, Conclusion, References, and Appendices. Tools likeFineReport enhance this process by offering intuitive features for creating polished and professional reports, saving you time and effort.
Key Takeaways
A good report has parts like Title Page, Abstract, Body, and References. Each part has a job and makes the report clear.
Tools like FineReport help make writing reports easier. Templates and automation save time and make reports better.
Clear and simple writing is very important for reports. Use easy words and focus on key ideas to keep readers interested.
Adding visuals like charts and graphs helps explain hard data. Pictures make reports more interesting and easier to remember.
Checking and fixing mistakes is very important. Careful editing makes sure your report looks good and has no errors.
Key Components of a Report Writing Format
Title Page
The title page is the first impression of your report. It provides essential information about the document, including the title, author, and submission date. A well-designed title page sets the tone for professionalism and clarity. To create an effective title page:
Include a clear title: Summarize the main idea and scope of the report in a concise and informative manner.
Add essential details: Include your name, the recipient's name, the submission date, and any necessary identifiers.
Incorporate visual elements: Use relevant graphics or colors to enhance readability without cluttering the page.
Follow guidelines: Adhere to organizational or industry-specific templates for layout and style.
Best Practice
Description
Clear Title
Summarizes the main idea and scope of the report, being concise and informative.
Visual Elements
Enhances readability with relevant graphics and colors.
Essential Information
Includes author name, recipient name, submission date, and report identifiers.
Adherence to Guidelines
Follows specific rules or templates for layout and style.
A well-crafted title page not only introduces your report but also reflects your attention to detail and professionalism.
Abstract
The abstract is a concise summary of your report. It helps readers quickly understand the main points without diving into the full document. A strong abstract serves as a roadmap, highlighting the significance, methodology, and findings of your work.
To write an impactful abstract:
Distill complex information: Present the core aspects of your research, including background, objectives, methods, results, and conclusions.
Keep it concise: Use clear and straightforward language to summarize the report effectively.
Enhance visibility: In academic and professional settings, a precise abstract increases the report's impact by allowing readers to evaluate its relevance quickly.
A well-crafted abstract ensures that readers grasp the essence of your report, making it an indispensable component of professional and academic writing.
Table of Contents
The table of contents acts as a navigation tool for your report. It lists all major sections and sub-sections along with their corresponding page numbers, enabling readers to locate specific information effortlessly.
To design an effective table of contents:
Organize headings and subheadings: Ensure logical flow and clarity in the structure.
Include page numbers: Provide accurate page references for each section.
Use formatting tools: Utilize software features to create a visually appealing layout.
A well-structured table of contents improves navigation and enhances the reader's understanding of your report's organization.
Introduction
When you begin writing a report, the introduction serves as the gateway to your content. It sets the stage for the reader, offering a glimpse into the purpose and scope of your assignment report. A strong introduction not only grabs attention but also provides clarity on what to expect in the subsequent sections.
Crafting a compelling hook is essential. It sets the tone for the entire report and influences reader interest.
A well-crafted introduction significantly impacts your ability to captivate and retain audience interest in Malaysia.
Setting a vivid scene at the beginning creates a mental image, making the topic relatable and engaging.
For example, if you are writing a report on environmental sustainability, you might start with a striking statistic or a thought-provoking question. This approach immediately draws the reader in and establishes the relevance of your topic.
Your introduction should also outline the objectives of your report and briefly mention the methodology used. This helps readers understand the structure and flow of your report writing format. By providing this roadmap, you ensure that your audience in Malaysia remains engaged and informed throughout the document.
Body
The body of your report is where you present your findings, analysis, and supporting details. A well-organized body section contributes significantly to better information retention and comprehension.
A structured format improves readability.
Enhanced comprehension leads to better retention of information.
To achieve this, divide the body into clear sections and subsections. Each section should focus on a specific aspect of your topic, supported by data, examples, or visuals. For instance, if your report is about market trends, you can organize the body into sections like "Current Trends," "Emerging Opportunities," and "Challenges."
Use headings and subheadings to guide readers through your content. Incorporate tables, charts, or graphs to present complex data in an easily digestible format. Visual aids not only enhance understanding but also make your report writing more engaging.
When writing the body, always keep your audience in Malaysia in mind. Use simple language and avoid jargon unless necessary. If technical terms are required, provide explanations to ensure clarity. This approach ensures that your report remains accessible to a wider audience in Malaysia, including those unfamiliar with the subject matter.
References
References are an essential part of any report. They provide credibility to your work by acknowledging the sources of information, data, or ideas you have used. Including references ensures transparency and allows readers to verify the accuracy of your content.
To create a proper reference section:
List all sources: Include books, articles, websites, or any other materials you consulted while writing your report.
Follow a citation style: Use a consistent format like APA, MLA, or Chicago, depending on the requirements of your assignment report.
Organize alphabetically: Arrange the references by the author's last name or the title if no author is available.
Provide complete details: Include the author's name, publication year, title, and source link or publisher information.
Tip: Use citation tools or software to streamline the process of creating and formatting references. These tools help you avoid errors and save time.
For example, if you referenced a book, your citation might look like this in APA format: Smith, J. (2020). The Art of Report Writing. New York: Academic Press.
A well-organized reference section not only enhances the professionalism of your report but also demonstrates your commitment to ethical writing practices.
Appendices
The appendices section is where you include supplementary materials that support your report but are too detailed or lengthy for the main body. This section ensures that your report remains concise and focused while still providing all necessary information for readers who wish to explore further.
Here’s why appendices are important:
Including detailed data in the main text may disrupt the flow of your assignment report.
Lengthy or complex information, such as raw data or technical details, fits better in a separate section.
Appendices allow you to include additional insights, like study designs or cohort details, without exceeding word limits.
Presenting supplementary data in an independent format makes it easier for readers to understand.
They offer a space for visual aids, such as charts, graphs, or tables, that enhance the overall clarity of your report.
When creating appendices:
Label each appendix clearly: Use titles like "Appendix A: Survey Questions" or "Appendix B: Data Tables" for easy navigation.
Reference them in the main text: Direct readers to the appendices when discussing related content. For instance, you might write, "See Appendix A for detailed survey results."
Organize logically: Arrange the appendices in the order they are mentioned in the report.
Note: Appendices should only include information that adds value to your report. Avoid including irrelevant or redundant materials.
For example, if your report involves a market analysis, you might include raw data tables, detailed calculations, or additional charts in the appendices. This approach keeps the main body concise while ensuring that all relevant information is accessible to readers.
A well-structured report ensures that your ideas flow logically and your readers can easily follow your analysis. To achieve this, focus on organizing your content into distinct sections with clear headings and subheadings. Each section should serve a specific purpose, guiding the reader through your findings and conclusions.
Start with a strong introduction: Outline the objectives and methodology of your report. This sets the stage for what follows.
Dedicate sections for findings and analysis: Present your data in a logical sequence, ensuring each point builds on the previous one.
Use visuals effectively: Charts, graphs, and tables can simplify complex data and make your report more engaging.
Conclude with actionable insights: Summarize your key takeaways and provide recommendations where applicable.
Step
Description
Introduction
Start with a concise introduction outlining objectives and methodology.
Findings
Present dedicated sections for findings and analysis, ensuring logical flow.
Visuals
Incorporate charts and tables to illustrate complex data effectively.
Conclusion
Summarize insights and suggest actionable recommendations.
Tailoring
Tailor reports to the audience to enhance engagement and understanding.
Structured guides, such as the Evidence Documentation Guide, have proven to enhance clarity and organization in professional settings. They ensure logical structuring of findings, promote accuracy, and improve the overall quality of reports. By following these principles, you can present your data clearly, boosting your credibility and helping readers make informed decisions.
Writing with the Audience in Malaysia in Mind
Understanding your audience in Malaysia is crucial when learning how to write a report. Tailoring your content to their needs ensures that your message resonates and achieves its intended purpose.
Identify your audience: Determine whether your report is for academic peers, business stakeholders, or a general audience in Malaysia.
Adjust your tone and language: Use formal language for professional reports and simpler terms for broader audiences in Malaysia.
Highlight key points early: Busy readers often skim reports. Present your main findings and recommendations upfront.
Provide context: Explain technical terms or background information to ensure clarity for all readers.
For example, a case study involving Smartling and Omniscient Digital demonstrated the importance of audience-focused strategies. By optimizing content and using visuals to engage readers, they achieved a 118% increase in organic blog traffic and a $3.7 million pipeline. Similarly, tailoring your report to your audience in Malaysia can significantly enhance its impact and effectiveness.
Case Study
Key Results
Strategies Used
Smartling & Omniscient Digital
118% increase in organic blog traffic, $3.7 million in pipeline
Product-led SEO strategy, content optimization, high-value backlinks
Porch & Fractl
23K+ monthly visitors, 3,500+ press mentions
Visual engagement, key results highlighted at the beginning, use of analytics screenshots
By adapting your content to your audience in Malaysia, you ensure that your report remains relevant, engaging, and impactful.
Formatting Tips for Professional Reports
Professional formatting enhances the readability and visual appeal of your report. It also reflects your attention to detail and commitment to quality.
Use consistent fonts and styles: Choose a professional font like Arial or Times New Roman and stick to it throughout the document.
Incorporate headings and subheadings: Break your content into sections for better navigation.
Follow numerical standards: Use numerals for numbers 10 and above, and words for numbers below 10.
Include visuals with labels: Add descriptive titles to charts and tables to clarify their purpose.
Maintain alignment and spacing: Ensure uniform margins, line spacing, and text alignment for a polished look.
Table Example
Description
Table 1
Prototypical table format in APA style with label and name before data.
Table 2
Contains label and name before data with boxes around sections.
Table 3
Minimal formatting with only a horizontal line between header and data.
Professional formatting not only improves the aesthetics of your report but also enhances its readability. For instance, using a leading zero for decimals less than one and rounding means to one decimal place ensures numerical clarity. These small details make a big difference in how your report is perceived.
Tip: Tools like FineReport simplify formatting by offering pre-designed templates and drag-and-drop features. This saves time and ensures consistency across your document.
By applying these formatting tips, you can create a report that is both visually appealing and easy to navigate, leaving a lasting impression on your readers.
Leveraging FineReport for Report Writing Efficiency in Malaysia
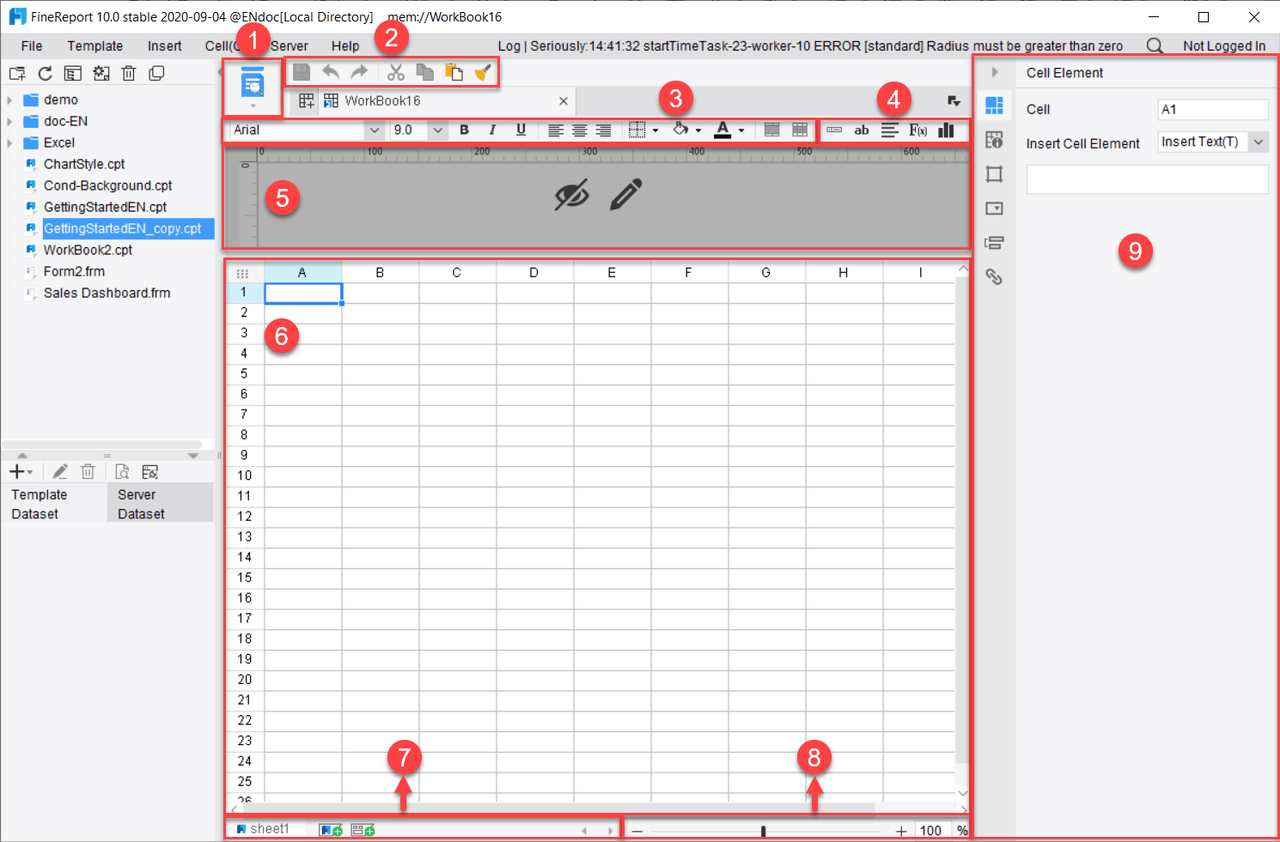
Creating professional reports can be time-consuming, especially when you need to manage large datasets or complex formatting. FineReport simplifies this process by offering tools that enhance productivity and streamline your workflow. Whether you're learning how to write a report or refining your skills, this software provides features that make report writing faster and more efficient.
One of FineReport's standout features is its user-friendly interface. You can easily navigate its Excel-like design, which reduces the learning curve for new users. This interface empowers you to create reports independently, even if you're not an IT expert. Additionally, FineReport's dynamic reporting capabilities allow you to generate real-time reports with just a few clicks. This feature eliminates the need for repetitive manual tasks, saving you valuable time.
Automation is another key advantage of FineReport. The software automates tasks like data integration, report generation, and distribution. For example, you can schedule reports to be sent to stakeholders at specific times, ensuring timely delivery without manual intervention. This automation not only reduces errors but also frees up your time for more critical tasks.
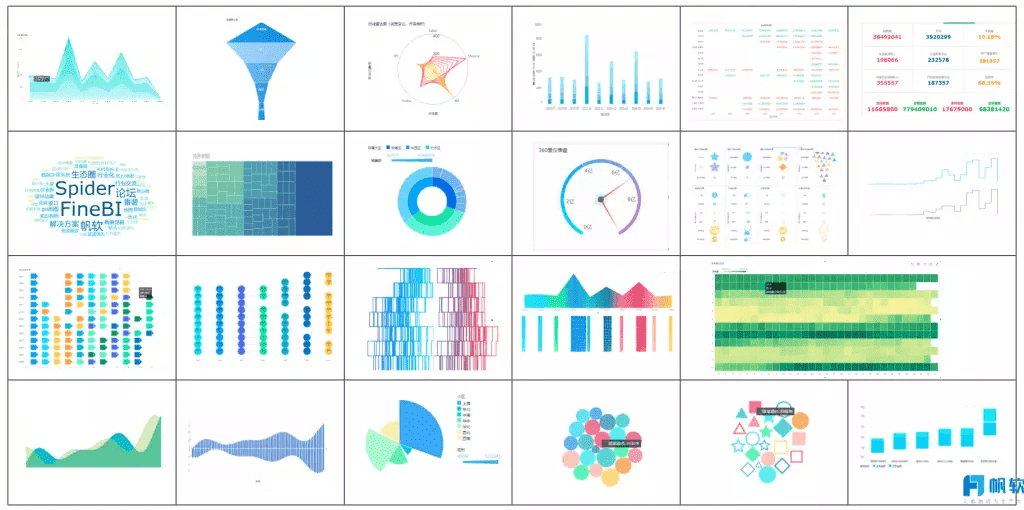
The built-in funnel models in FineReportsimplify complex data analysis. These models help you visualize data trends and patterns, making it easier to draw actionable insights. Whether you're analyzing sales performance or tracking project progress, these tools enhance your decision-making process.
FineReport also supports collaboration by allowing multiple users to work on the same report. This feature is particularly useful for team projects in Malaysia, where input from different departments is required. You can assign permissions to ensure data security while enabling seamless teamwork.
If you're looking for a writing guide to improve your reports, FineReport offers pre-designed templates that align with professional standards. These templates provide a solid foundation, helping you focus on content rather than formatting. By using these templates, you can learn how to write a report that is both polished and impactful.
FineReport's ability to integrate with various data sources further enhances its versatility. You can connect to databases, spreadsheets, and other platforms to gather all your data in one place. This integration ensures consistency and accuracy, which are crucial for professional reporting.
Clarity and conciseness are the cornerstones of effective report writing format. When your report is clear, readers immediately understand its purpose. Using straightforward language avoids confusion and ensures your message is easily grasped. Conciseness, on the other hand, keeps your report focused. By eliminating unnecessary details, you allow readers to concentrate on the main points without distraction.
Each paragraph in your report should begin with a topic sentence that introduces the main idea. Follow this with supporting details that reinforce your point. For example, if you are presenting research findings, summarize the key results first, then provide relevant data or examples. This structure not only informs but also engages your audience in Malaysia.
Present information in a style that facilitates comprehension.
Use simple, direct language to avoid ambiguity.
Avoid excessive detail that could obscure your main points.
Studies show that reports written with clarity and precision enhance communication. A well-developed narrative and cohesive structure make your content easier to read and understand. By focusing on these principles, you ensure your report achieves its purpose effectively.
Proofreading and Editing for Perfection
Proofreading and editing are essential steps in creating a polished report. Errors in grammar, spelling, or formatting can distract readers and undermine your credibility. A thorough review ensures your content is error-free and professional.
For instance, a university study revealed that students who used proofreading services improved their submission quality by 40%. Similarly, a survey found that 85% of readers disengage from content riddled with errors. These findings highlight the importance of meticulous editing in Malaysia.
To proofread effectively:
Read your report aloud to catch awkward phrasing or inconsistencies.
Use tools like grammar checkers to identify common mistakes.
Take breaks between writing and editing to approach your work with fresh eyes.
Tip: Collaborate with a colleague or use professional editing services for an objective review. A second pair of eyes often catches errors you might overlook.
By dedicating time to proofreading, you enhance the quality of your report and leave a positive impression on your audience in Malaysia.
Using Visual Tools for Enhanced Readability
Visual tools play a vital role in making complex reports more accessible. Charts, graphs, and tables simplify data presentation, allowing readers to grasp key points quickly. Combining visuals with text engages both visual and verbal processing systems, improving comprehension and retention.
Evidence Type
Description
Cognitive Processing
Human cognition is divided into visual and verbal processing systems.
Visual Aid Benefits
Combining text with visuals allows simultaneous engagement of both processing systems.
Comprehension Impact
This combination makes complex ideas more manageable and aids in encoding and recalling information.
Well-designed visuals enhance readability and make your report more engaging. For example, use pie charts to show proportions or line graphs to illustrate trends. Always label your visuals clearly and provide brief explanations to ensure they complement your text.
Visual aids improve comprehension of complex information.
Readers find it easier to interpret data when visuals are included.
Incorporating visuals not only enhances the aesthetic appeal of your report but also ensures your audience in Malaysia understands your message effectively.
How FanRuan’s FineReport Enhances Report Writing in Malaysia
FineReport transforms the way you create reports by simplifying complex tasks and improving efficiency. Its features empower you to produce professional-quality documents with less effort and greater precision.
One of FineReport’s standout capabilities is automation. You can schedule reports to generate automatically, saving time and reducing manual work. This feature ensures consistency and eliminates errors caused by repetitive tasks. Templates further enhance your workflow. They standardize report formats, allowing you to focus on content rather than design.
Batch reporting is another powerful tool. It lets you produce multiple reports simultaneously, boosting productivity. Whether you need daily summaries or monthly analyses, this feature ensures timely delivery without extra effort.
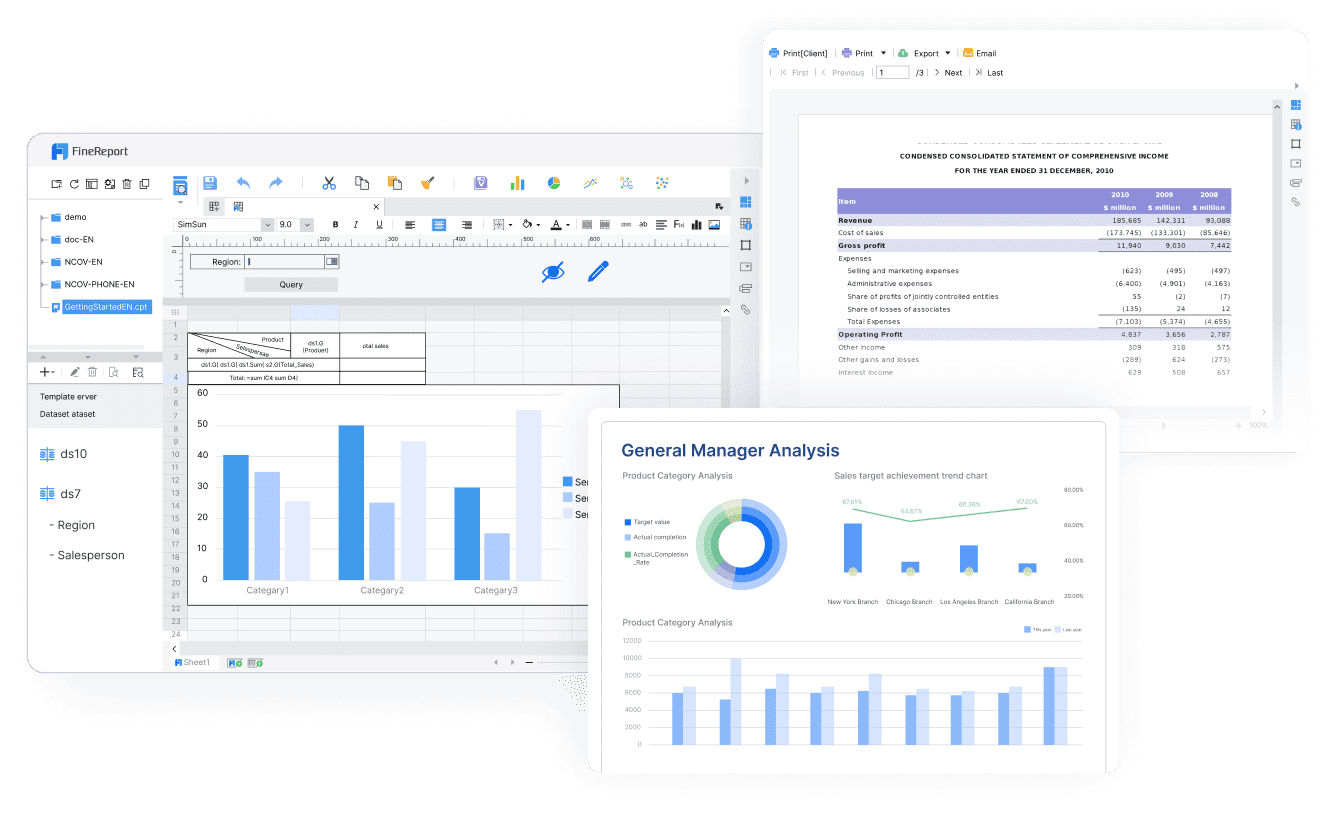
Data visualization takes your reports to the next level. FineReport offers advanced tools to create charts, graphs, and dashboards. These visuals make complex data easier to understand and more engaging for your audience in Malaysia. You can also query and filter data effortlessly. This ensures your reports include only the most relevant and accurate information.
Feature
Benefit
Automation of report generation
Reduces manual effort and time spent on report creation.
Use of templates
Minimizes repetitive tasks and standardizes report formats.
Batch reporting
Enhances efficiency by allowing multiple reports to be generated simultaneously.
Increases accuracy and relevance of reports by allowing precise data selection.
FineReport’s user-friendly interface makes it accessible even if you’re new to report writing. Its drag-and-drop functionality simplifies the process, letting you create reports quickly and efficiently. By leveraging these features, you can produce polished, impactful documents that meet professional standards.
Mastering the basics of report writing format ensures your work is clear, professional, and impactful. Key components like the title page, abstract, and body provide structure, while references and appendices add credibility and depth.
A well-organized report reflects your attention to detail and helps readers follow your ideas effortlessly.
Focus on clarity, concise language, and audience needs to make your reports stand out. Tools like FineReport simplify the process, offering templates, automation, and dynamic visuals. Explore its features to create polished, professional reports that leave a lasting impression.
Click the banner below to try FineReport for free and empower your enterprise to transform data into productivity!
Real-time insights to optimize production, logistics, and decisions.
FAQ
What is the most important part of a report?
Every section plays a role, but the body is the most critical. It contains your findings, analysis, and supporting details. Organize it well with headings and visuals to ensure clarity and engagement.
How can FineReport help with report writing?
FineReport simplifies report creation with features like drag-and-drop design, automation, and pre-designed templates. It saves time, reduces errors, and enhances the visual appeal of your reports.
What is the best way to proofread a report?
Read your report aloud to catch errors. Use grammar tools for additional checks. Take breaks before editing to approach your work with fresh eyes. Collaborating with a colleague can also provide valuable feedback.
Why are visuals important in a report?
Visuals like charts and graphs simplify complex data. They improve comprehension and make your report more engaging. Always label visuals clearly and ensure they align with your content.
Can FineReport handle large datasets?
Yes, FineReport integrates with multiple data sources and handles large datasets efficiently. Its automation and visualization tools ensure accurate and professional reporting, even for complex data.