Retention analysis, an analysis model, is used to analyze users' engagement/activeness, examining customer behaviors (such as login and consumption) that still exists after a certain period of time among customers who have initial behaviors. Retention is an indicator that not only reflects customer stickiness, but also reflects the attractiveness of a product to users.
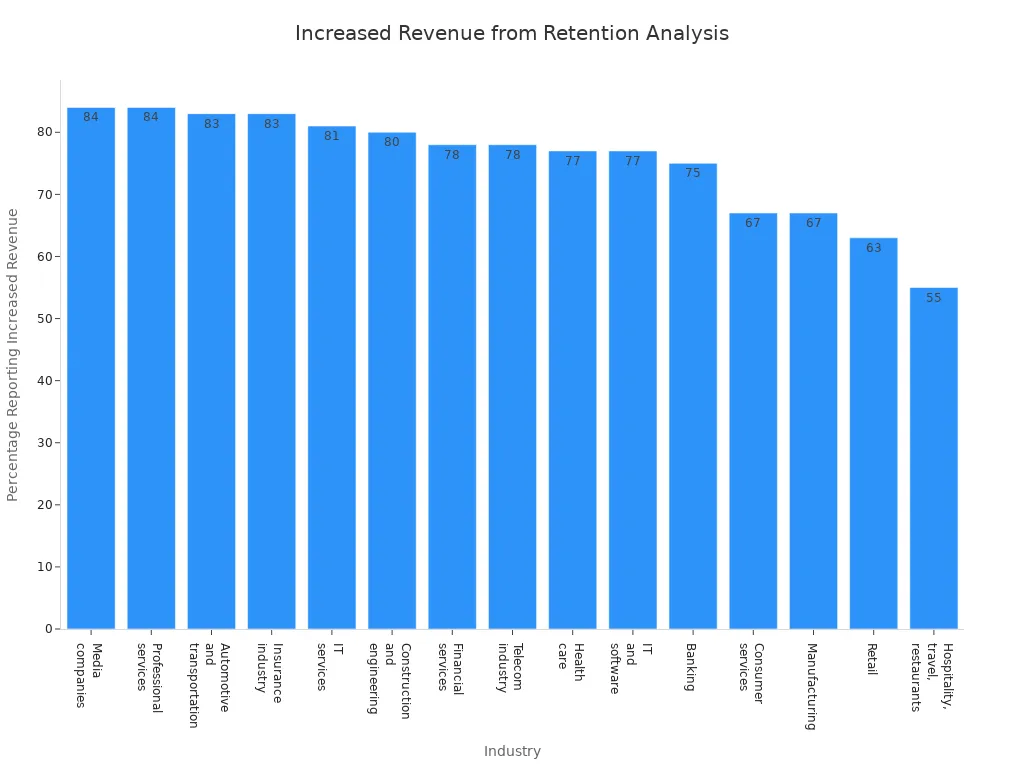
Retention analysis starts with collecting user data, segmenting customers, and tracking their behaviors over time. This process helps companies spot why users leave and how to keep them engaged. Many businesses see real results—media companies and professional services report up to 84% increased revenue after customer retention analysis.
What Is Retention Analysis
Retention analysis helps businesses understand how well they keep their customers over time. Companies use this process to measure how many customers stay loyal and how many leave. By tracking customer behaviors, businesses can spot patterns, find out why people stop buying, and make changes to keep more customers coming back. Retention analysis looks at important data like repeat purchases, churn rate, and revenue from returning customers. This information shows how well a company’s retention strategies work and helps guide future decisions.
Why Customer Retention Matters
Customer retention plays a huge role in business success. When companies keep more customers, they build a stable base that supports long-term growth. Studies show that even a small increase in retention can boost profits by as much as 25% to 95%. Loyal customers often spend more, give helpful feedback, and recommend the brand to others. They also make revenue more predictable, which helps with planning and forecasting. Retaining customers costs less than finding new ones, so strong retention strategies save money and create a competitive edge. Businesses that focus on customer retention often see better brand reputation and more referrals.
FanRuan stands out as a leader in data analytics, helping organizations track and improve customer retention. With tools like FineBI, companies can easily monitor retention metrics, spot trends, and take action to keep customers engaged.
Key Metrics for Retention
To measure customer retention, businesses rely on several key metrics. The retention rate shows the percentage of customers who stay with a company over a set period. Churn rate tracks how many customers leave. Other important retention metrics include repeat purchase rate and revenue growth from returning customers. By watching these numbers, companies can see how well their retention strategies work and where they need to improve. Both small businesses and large enterprises use these metrics, but their focus may differ. Small businesses often rely on personal relationships, while larger companies use more complex data and segmentation.
Tip: Tracking the right retention metrics helps businesses quickly spot issues and adjust their strategies for better results.
Define Retention Analysis Metrics
Defining what customer retention means for a business is the first step toward building a strong base of loyal users. Every company has its own way of measuring success, so it helps to pick the right retention metrics that match business goals. In retail, for example, the customer retention rate is a key metric. It shows how many users stick around over time. The formula looks like this:
Customer Retention Rate = ((Number of Customers at End of Period - Number of New Customers During Period) / Number of Customers at Start of Period) x 100
Tracking this number helps businesses see how well they turn one-time buyers into repeat users. Other important retention metrics include repeat purchase rate and engagement levels.
Set Retention Goals
Setting clear goals gives teams a target to aim for. Many companies use the SMART framework to make goals specific, measurable, achievable, relevant, and time-bound. For example, a business might want to increase active users by 10% in the next quarter or reduce churn below 5% by the end of the year. Teams should pick three to five core retention metrics that show real progress, like renewal rates or customer satisfaction scores. Regular check-ins help everyone stay on track and adjust quickly if needed.
Tip: Treat goals as living documents. Adjust them as business needs or user behavior changes.
FineBI makes it easy to centralize and standardize these retention metrics. With its drag-and-drop dashboards, users can track progress in real time and share results across teams. This helps everyone stay focused on the same targets.
Identify Active and Inactive Customers
Knowing who the active users are—and who is slipping away—can make a big difference. Businesses often define active users by looking at behaviors like last login date, purchase frequency, or number of interactions. For example, a user who has not logged in or made a purchase in six months might be considered inactive. Segmenting users by how long they have been inactive (like 30, 60, or 90 days) helps teams target re-engagement campaigns more effectively.
FineBI supports this process by letting users analyze engagement metrics, such as time spent on site or response to marketing emails. Teams can quickly spot trends and take action to bring inactive users back. By keeping a close eye on both active users and those at risk, businesses can boost customer retention and build stronger relationships.
Retention Analysis with FineBI

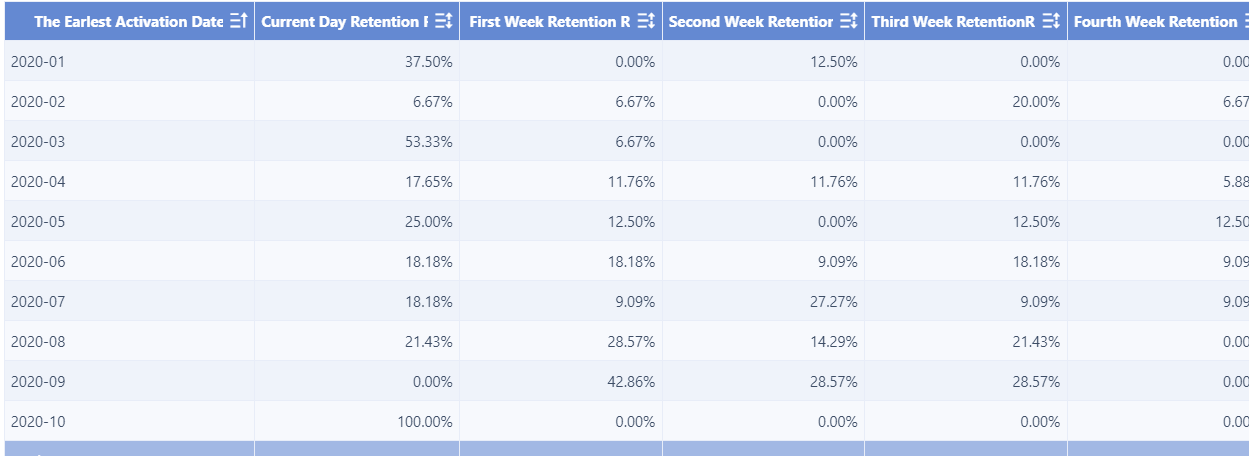
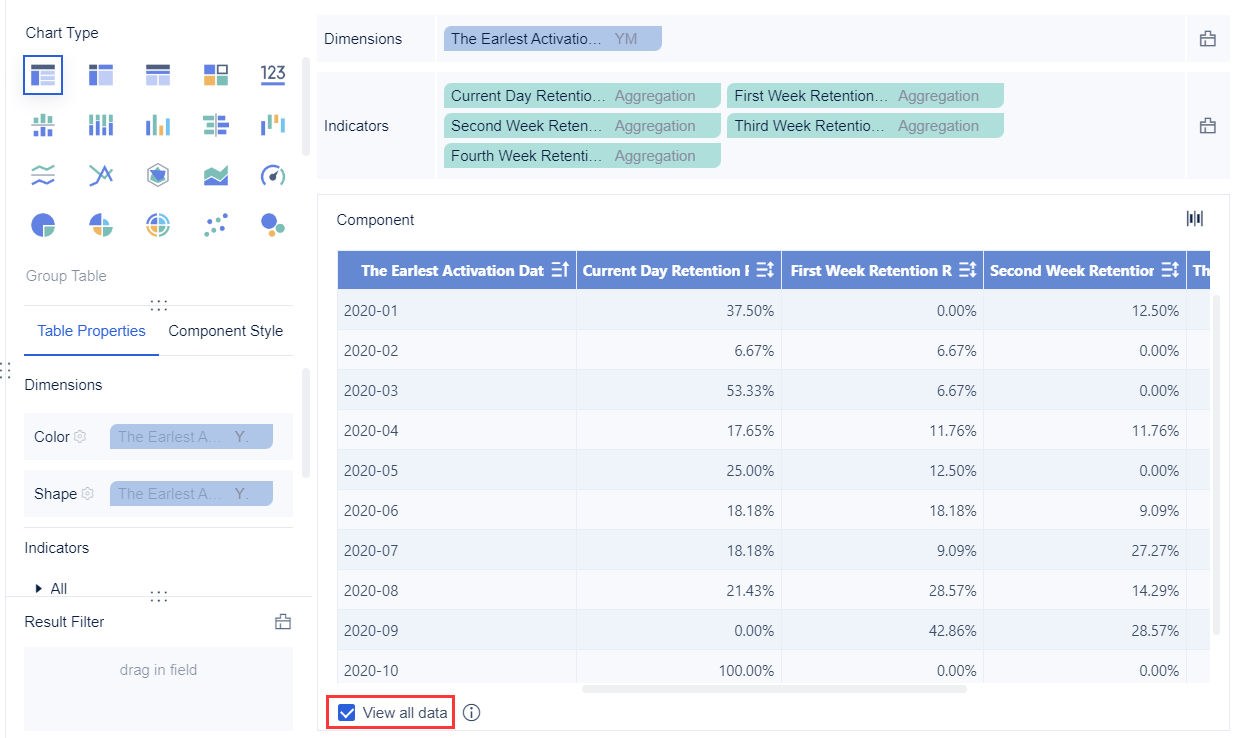
Segment Customers by Cohort
Cohort retention analysis helps businesses see how different groups of users behave over time. FineBI makes it easy to group users into cohorts based on when they joined, where they came from, or how they interact with a product. For example, a company can create a cohort of users who signed up during a holiday campaign or those who made their first purchase in January. This approach lets teams compare how each group sticks around or drops off.
Some best practices for segmenting customers into cohorts include:
- Grouping users by the date they registered or made their first purchase. This helps track how long each group stays active.
- Creating cohorts based on shared attributes, like location, device type, or subscription plan. This reveals which segments have higher retention or churn.
- Looking at acquisition channels, such as social media or email campaigns, to see which sources bring in the most loyal users.
- Segmenting by behavior, like number of logins or purchases, to find patterns in customer engagement.
FineBI supports these strategies by letting users explore retention data from different angles. Teams can quickly build and adjust cohorts to match business goals. They can also spot trends, such as which group of users becomes inactive faster or which campaign brings in the most active users.
Tip: Start with simple cohorts, like signup month, and add more layers—such as location or purchase type—as you learn more about your users.
Analyze Customer Behavior Patterns
Once users are grouped into cohorts, the next step is to analyze customer behavior patterns. FineBI’s data integration features allow companies to bring together information from many sources, like databases, spreadsheets, and cloud platforms. This unified view helps teams see the full picture of how users interact with their products or services.
FineBI’s self-service tools let business analysts process and clean data without needing advanced technical skills. They can add new columns, group users, and filter out noise to focus on what matters. The platform’s high-performance engine ensures that even large sets of retention data load quickly and stay reliable.
With FineBI, teams can:
- Track how often users return after their first visit or purchase.
- Compare engagement levels across different cohorts, such as users from different regions or signup periods.
- Use interactive dashboards to monitor key metrics, like the number of active users in each cohort or changes in customer behavior over time.
- Share insights with other teams, making it easier to act on findings and improve retention strategies.
By analyzing cohort retention and customer behavior, companies can identify what keeps users coming back and what causes them to leave. This knowledge helps teams design better products, target the right users, and boost overall retention.
Note: Cohort retention analysis is not a one-time task. Teams should revisit their cohorts and behavior data regularly to spot new trends and adjust their strategies.
For more information about how to use FineBI to do retention analysis, refer to the Help Document.
Visualize Retention Analysis
Calculate Retention Rate
Every business wants to know how well it keeps its customers. The customer retention rate gives a clear answer. To calculate retention rate, most companies use a simple formula:[(E - N) ÷ S] × 100
Here, E stands for the number of customers at the end of a period, N is the number of new customers gained during that time, and S is the number of customers at the start. This method helps teams focus on existing customers, not just new signups. For example, if a business starts with 100 customers, ends with 100, and gains 10 new ones, the customer retention rate is 90%. This approach works for many industries, including subscription businesses, where tracking original subscribers is key.
FineBI makes calculating retention rates easy. Users can set up dashboards that pull data from different sources, apply the formula, and display results in real time. This streamlines retention reporting and helps teams spot changes quickly.
Tip: Segmenting customers by account age or subscription tier can reveal deeper insights. Different groups may have unique retention patterns.
For more details about the procedures of doing retention analysis, refer to the Help Document.
Visualize Retention Curves
Numbers tell part of the story, but visuals bring retention reporting to life. FineBI lets users create dashboards that show how retention rates change over time. Teams can build line charts to track monthly retention, cohort heatmaps to compare user groups, and funnel charts to see where users drop off.
| Visualization Technique | Purpose / Use Case | Extra Tips |
|---|---|---|
| Line Charts | Show retention trends over time | Spot dips or spikes easily |
| Cohort Heatmaps | Compare retention across user groups | Highlight differences between cohorts |
| Funnel Charts | Show conversion at each stage of the user journey | Find where users leave |
| Sankey Diagrams | Visualize user flow from sign-up to churn | Reveal drop-offs and bottlenecks |
| Churn Survival Curves | Plot how long users stay active before churning | See survival probability over time |
FineBI dashboards support interactive filters, so users can drill down by location, signup date, or other attributes. Adding annotations or callouts helps explain sudden drops or spikes in retention reporting. Teams can share these dashboards with stakeholders, making it easy to monitor trends and take action.
Start with a clear message, use color wisely, and keep visuals simple. This helps everyone understand the story behind the retention rate.
To explore more functions of FineBI, refer to the product guide.
Customer retention analysis works best as a step-by-step journey. Teams start by gathering data, segmenting users, and using FineBI to measure retention and spot trends. FineBI’s visual tools help businesses see which users stay active and why. Ongoing measurement brings real value—companies track loyalty, repeat purchases, and customer lifetime value. Anyone can get started: upload data, set up retention metrics, and explore insights with FineBI. For those ready to grow, FanRuan offers guides and a free trial to make the process even easier.

Continue Reading about Retention Analysis
What is Pareto Chart and How Does it Work
How DuPont Analysis Helps You Understand Your Business


FAQ

The Author
Lewis
Senior Data Analyst at FanRuan
Related Articles

What is Ecommerce Analytics and Why Does It Matter
Ecommerce analytics helps online stores track data, optimize sales, and enhance customer experience for better growth and profitability.
Lewis
Jan 04, 2026
What is Ad-Hoc Analysis and Why is it Important
Ad-hoc analysis lets you answer unique business questions instantly, offering flexible, real-time insights that drive smarter, faster decisions.
Lewis
Sep 16, 2025

What Is a Data Model and Why Does It Matter
A data model defines how data is structured and connected, making information easier to manage, analyze, and use for smarter business decisions.
Lewis
Aug 04, 2025