A finance dashboard gives you a real-time view of your company’s key financial metrics, making it easy to track performance and spot trends quickly. You need a finance dashboard to reduce errors, speed up reporting, and drive smarter decisions. Companies using modern finance dashboard solutions experience up to 90% fewer reporting mistakes and finish financial tasks 85 times faster. See how leading organizations achieve better results with these tools:
| Metric | Impact | Source |
|---|---|---|
| Reporting error reduction | 90% | Solvexia |
| Process speed | 85x faster | Solvexia |
| Automation time savings | 30-40% | PwC |
You gain instant access to accurate data, streamline workflows, and make confident choices. FineReport helps you overcome common financial management challenges by providing a finance dashboard that improves efficiency, accuracy, and insight. A finance dashboard empowers you to act decisively and stay ahead in 2026.
A finance dashboard is a digital tool that gives you a real-time, visual overview of your company’s most important financial data, helping you track performance, spot trends, and make informed decisions quickly.
A financial dashboard brings all your key metrics together in one place. You can see everything from revenue to expenses at a glance. The main functions include:
| Function | Description |
|---|---|
| Visual Representation | Shows clear, concise views of your financial data. |
| Real-time Insights | Gives you immediate access to current financial information. |
| Tracking KPIs | Monitors key performance indicators for financial health and progress. |
A financial reporting dashboard helps you:
You gain several measurable benefits when you use a financial reporting dashboard:
| Benefit | Description |
|---|---|
| Increased visibility | See all data in one place, in real time. |
| Faster decision-making | Spot trends and risks quickly. |
| Improved efficiency | Automate reports and reduce manual work. |
| Goal alignment | Keep teams focused on clear KPIs. |
| Cost control | Track expenses vs. budgets instantly. |
| Data-driven culture | Build accountability and transparency. |
FineReport takes a unique approach to the financial reporting dashboard. You get advanced visual data representation that makes complex numbers easy to understand. The platform supports interactive analysis, so you can explore your data and drill down into details. This approach helps you move beyond static reports and gain deeper insights for better decision-making.

A finance dashboard is a digital tool that gives you a real-time, visual overview of your company’s most important financial data, helping you track performance, spot trends, and make informed decisions quickly.
To succeed in 2026, you need financial dashboards that deliver actionable insights and support every stage of your financial planning. The right financial dashboard examples help you monitor key performance indicators, manage cash flow, and align your team with business goals. FineReport empowers you to build dashboards that adapt to your needs, scale with your business, and provide clarity for every user.

Tip: Choose financial dashboards that offer role-based views, flexible metrics, and mobile access. These features ensure your team can find the information they need, wherever they work.
Here are the essential financial dashboard examples every company should prioritize:
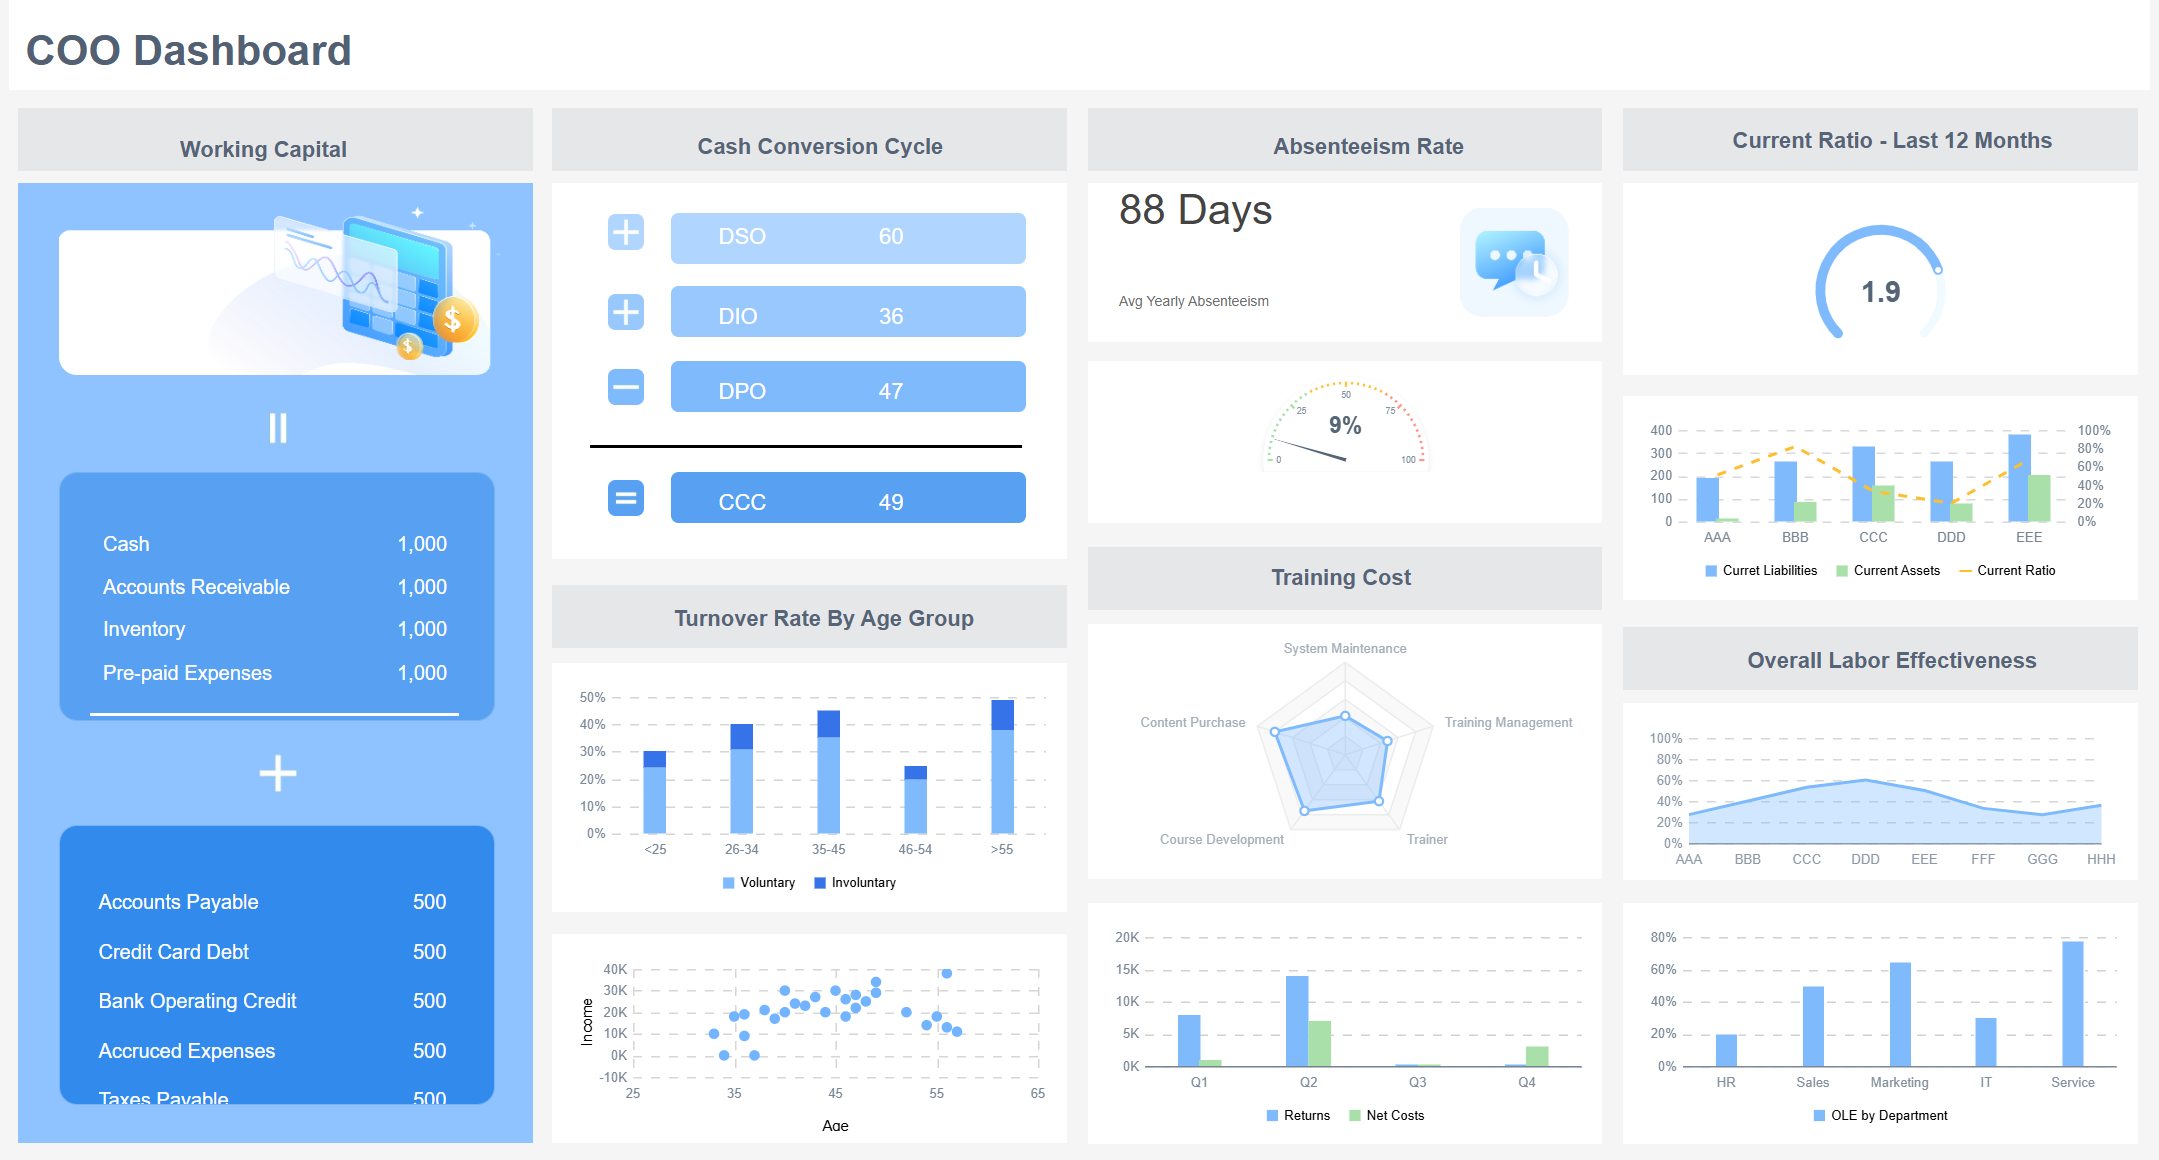
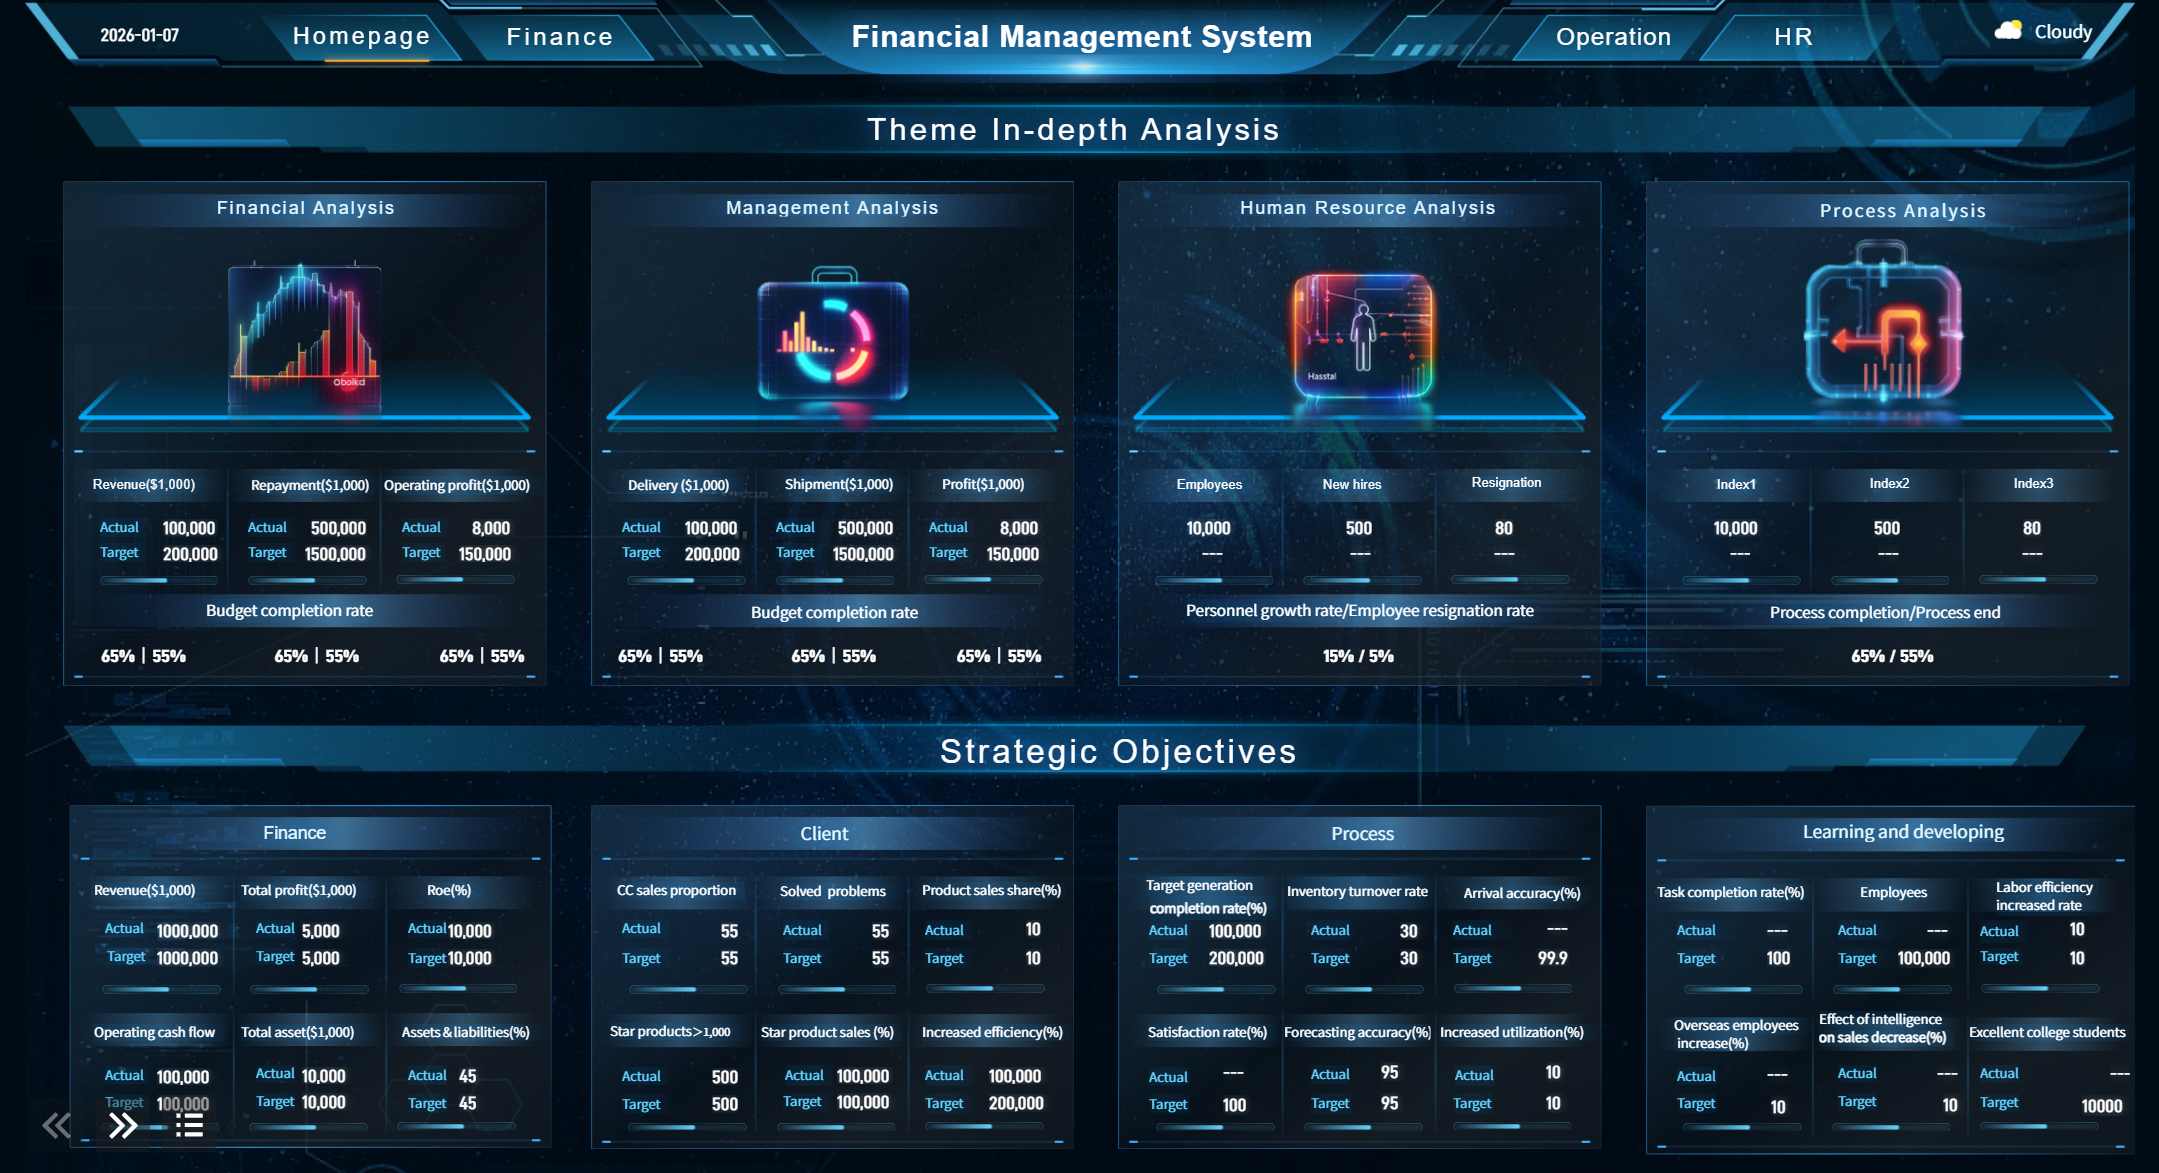
You need a CFO finance dashboard to see the big picture. This dashboard brings together data from all your financial systems, giving you a unified view for strategic planning. You can track net profit margin, quick ratio, cash conversion cycle, and revenue growth rate. The CFO dashboard supports real-time decision-making, consolidates data, and improves forecasting. You gain enhanced visibility and accountability, which helps you act fast if cash reserves drop or if spending exceeds budgets. FineReport lets you customize this dashboard for your executive team, ensuring you always have the right data for planning.
| KPI | Description |
|---|---|
| Net Profit Margin | Measures profitability as a percentage of revenue. |
| Quick Ratio | Assesses liquidity by comparing assets to liabilities. |
| Cash Conversion Cycle | Shows how fast investments turn into cash flow. |
| Revenue Growth Rate | Tracks increases in revenue over time. |
A cash flow dashboard gives you real-time visibility into your company’s liquidity. You can track cash inflows and outflows, build forecasts for daily, weekly, or yearly periods, and run scenario modeling to test your assumptions. This dashboard helps you spot trends, manage risks, and make timely adjustments to your cash flow buffers. FineReport’s intuitive visuals make it easy to understand your cash position and plan for the future. You can identify potential issues before they escalate and ensure your business stays on track.
| Feature | Description |
|---|---|
| Cash Flow Forecasting | Build forecasts for different time periods. |
| Cash Flow Tracking | Monitor cash flow changes and trends. |
| Scenario Modeling | Test different scenarios to inform decisions. |
| Clarity of Data Visuals | Use clear visuals for better understanding. |
You need a budget vs actual financial dashboard to compare your projected numbers with real results. This dashboard highlights variances between your budget and actual performance, helping you identify leaks, inefficiencies, and areas for improvement. You can analyze revenue and expense variances, understand why discrepancies occur, and adjust your planning for better outcomes. FineReport automates variance analysis and data visualization, making it easier to hold teams accountable and improve financial transparency. As your business grows, this dashboard scales with you, eliminating the need for manual spreadsheets.
A financial performance dashboard tracks your most important key performance indicators. You can monitor operating cash flow, current ratio, debt to equity ratio, days sales outstanding, and more. This dashboard gives you a clear view of your business health, highlights trends, and points out areas that need attention. FineReport’s dashboards help you forecast cash positions, model scenarios, and make proactive decisions. You position finance as a strategic partner in executive planning, supporting business growth and capital efficiency.
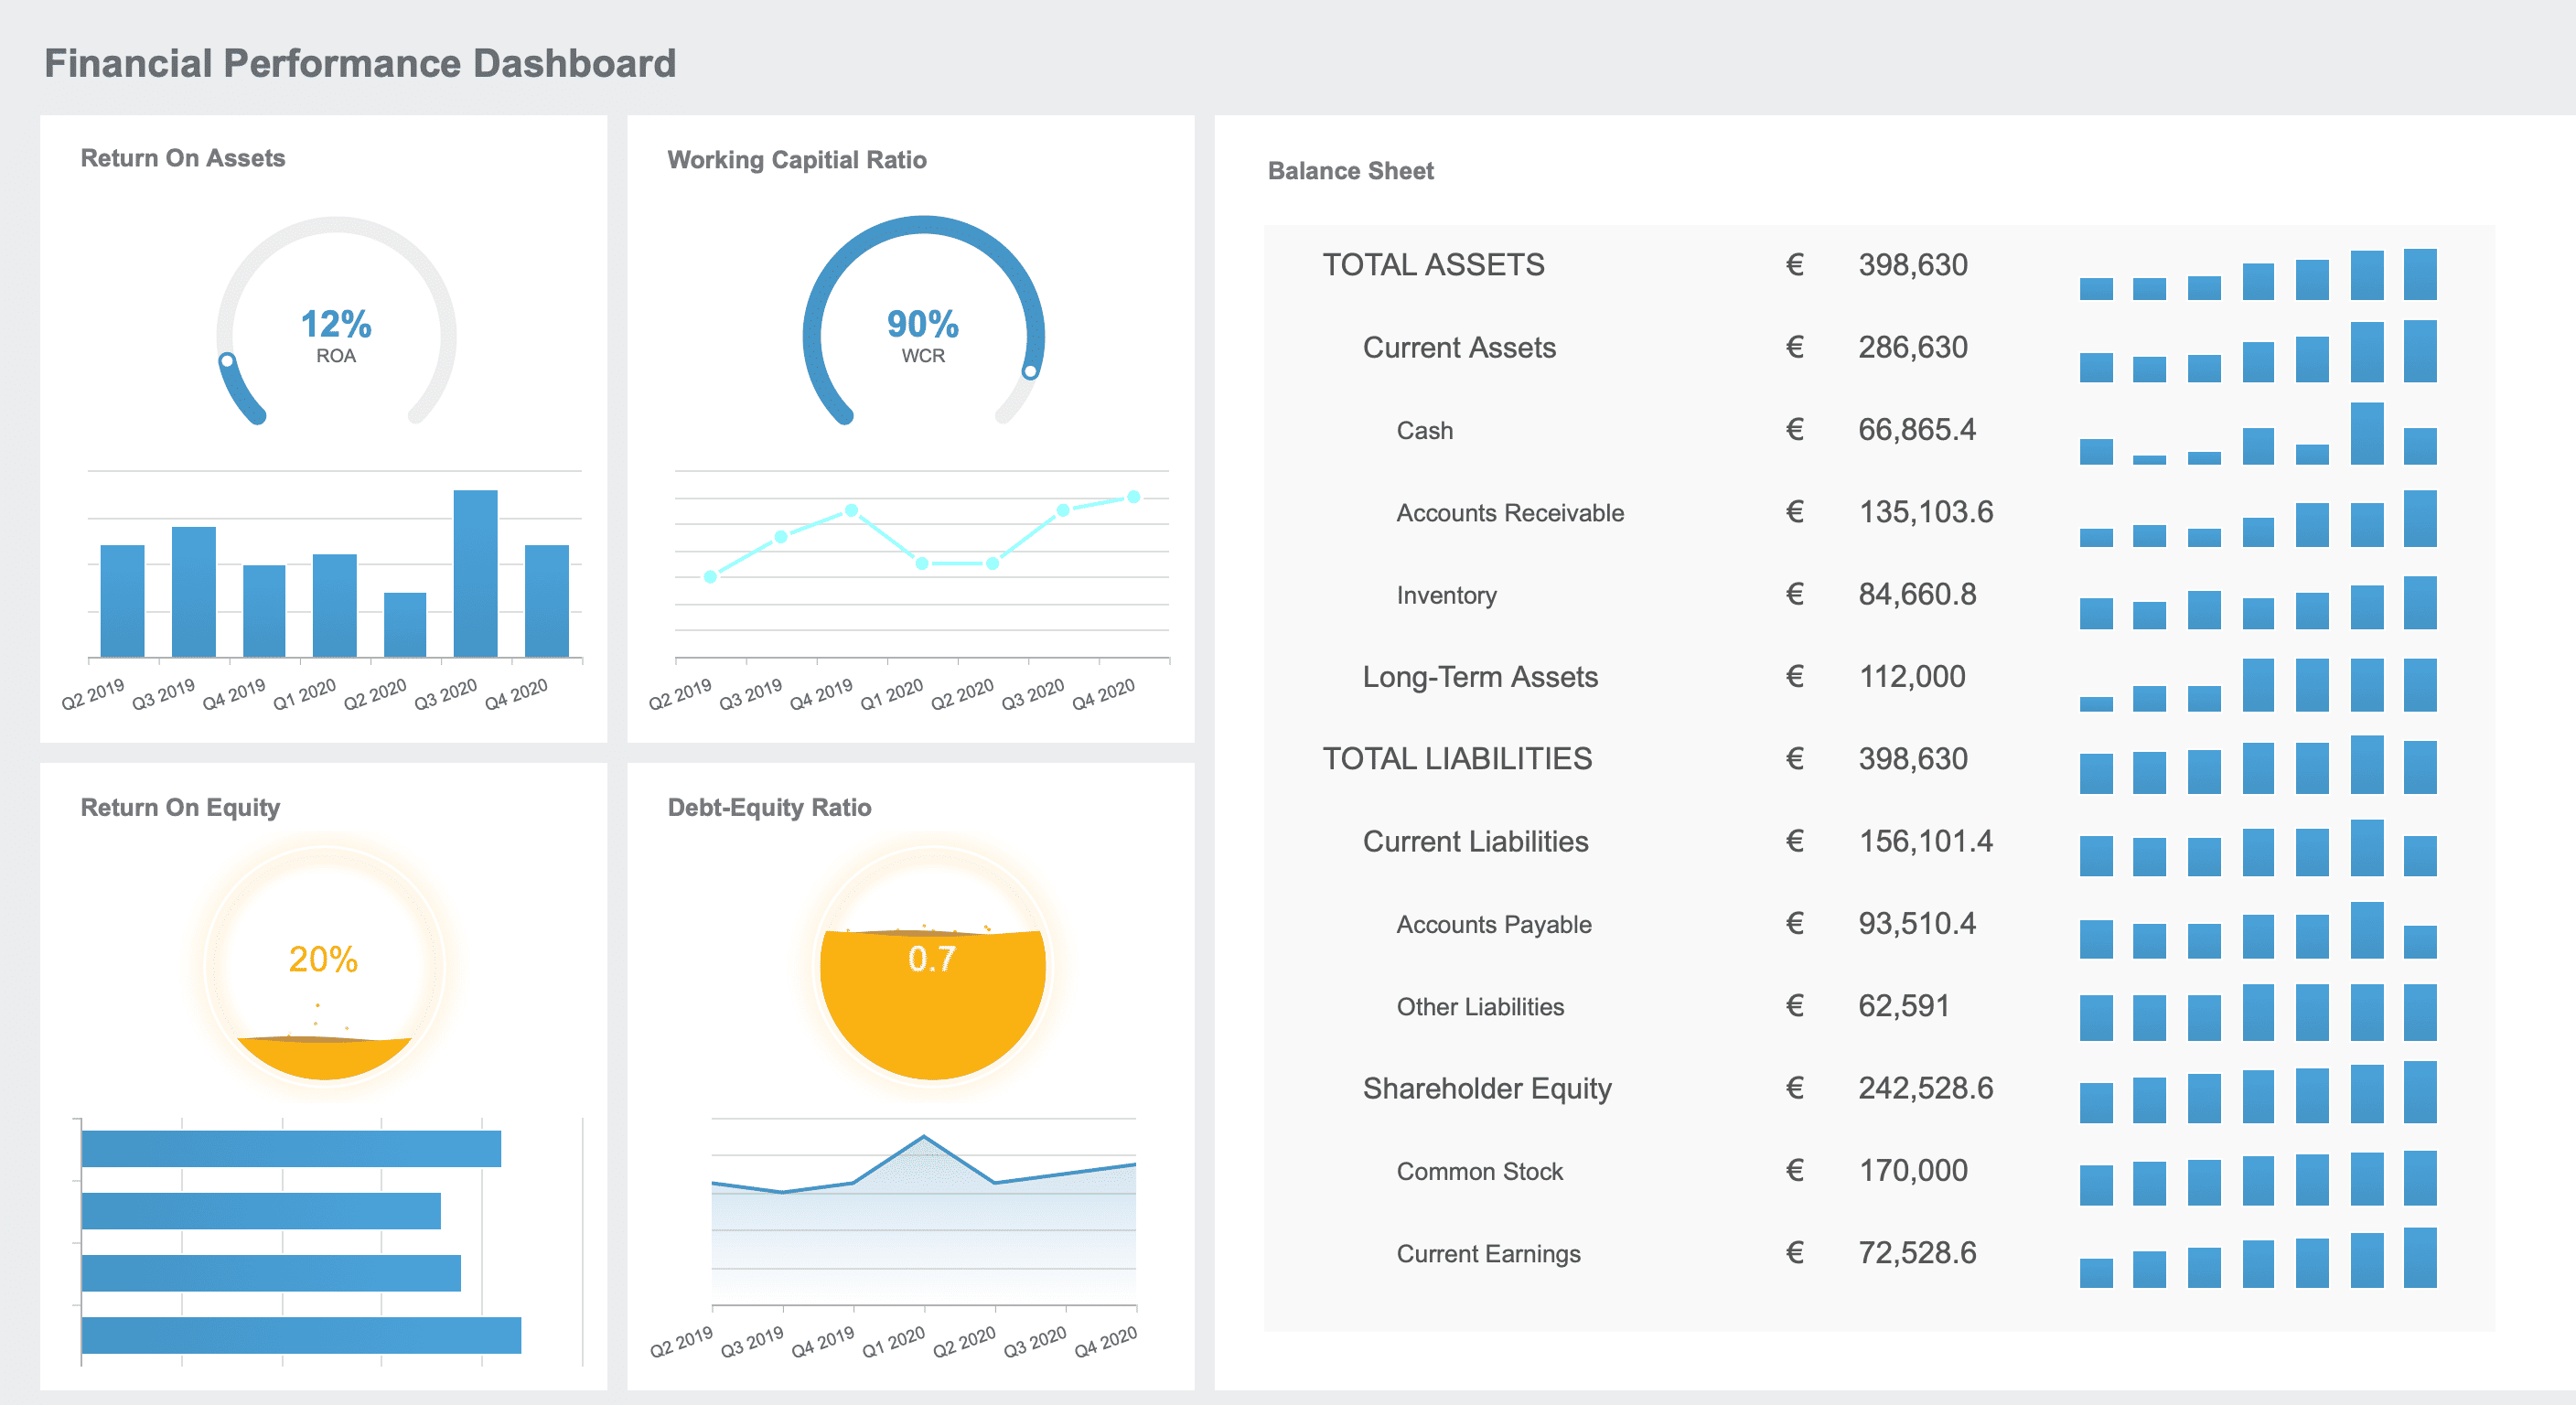
| Functionality | Description |
|---|---|
| Proactive Management | Improve capital efficiency and navigate uncertainty. |
| Strategic Partnership | Make finance a key part of executive decision-making. |
| Forecasting | Model cash flow and plan for different scenarios. |
| Monitoring | See business performance at a glance. |
You need an accounts receivable and payable dashboard to manage your cash flow cycle. This dashboard gives you real-time insights into invoice statuses, overdue payments, and vendor relationships. You can reduce operational costs, boost profitability, and improve cash flow by identifying slow-paying customers and prioritizing collections. FineReport’s dashboards streamline processes, enhance visibility, and support continuous improvement. You build stronger relationships with customers and suppliers, shorten your cash conversion cycle, and make more informed decisions.
| Benefit | Description |
|---|---|
| Shortened cash conversion cycle | Rely less on external capital and improve cash flow management. |
| Enhanced visibility | Make confident strategic decisions about payments. |
| Improved efficiency | Focus resources on high-value activities. |
| Stronger relationships with customers/suppliers | Foster timely payments and better cash cycles. |
A forecasting and planning dashboard is essential for long-term success. You can integrate headcount plans with financial forecasts, use advanced analytics for real-time insights, and create multiple scenarios to test your strategies. Centralized data ensures everyone works from the same information, improving collaboration and trust in your forecasts. FineReport automates processes, reduces errors, and streamlines workflows, making your planning more accurate and efficient. You can detect discrepancies early, adjust your plans, and drive better business outcomes.
| Feature | Description |
|---|---|
| Integrated Planning & Modeling | Link headcount and financial forecasts for accurate projections. |
| Advanced Analytics & Reporting | Get real-time insights and variance analysis. |
| Scenario Planning | Create and compare different financial scenarios. |
Note: The best financial dashboard examples combine real-time data, intuitive visuals, and flexible planning tools. FineReport gives you the power to build dashboards that grow with your business and support every aspect of your financial strategy.

A finance dashboard is a digital platform that gives you a clear, real-time overview of your business finances, helping you track performance, spot trends, and make informed decisions quickly.
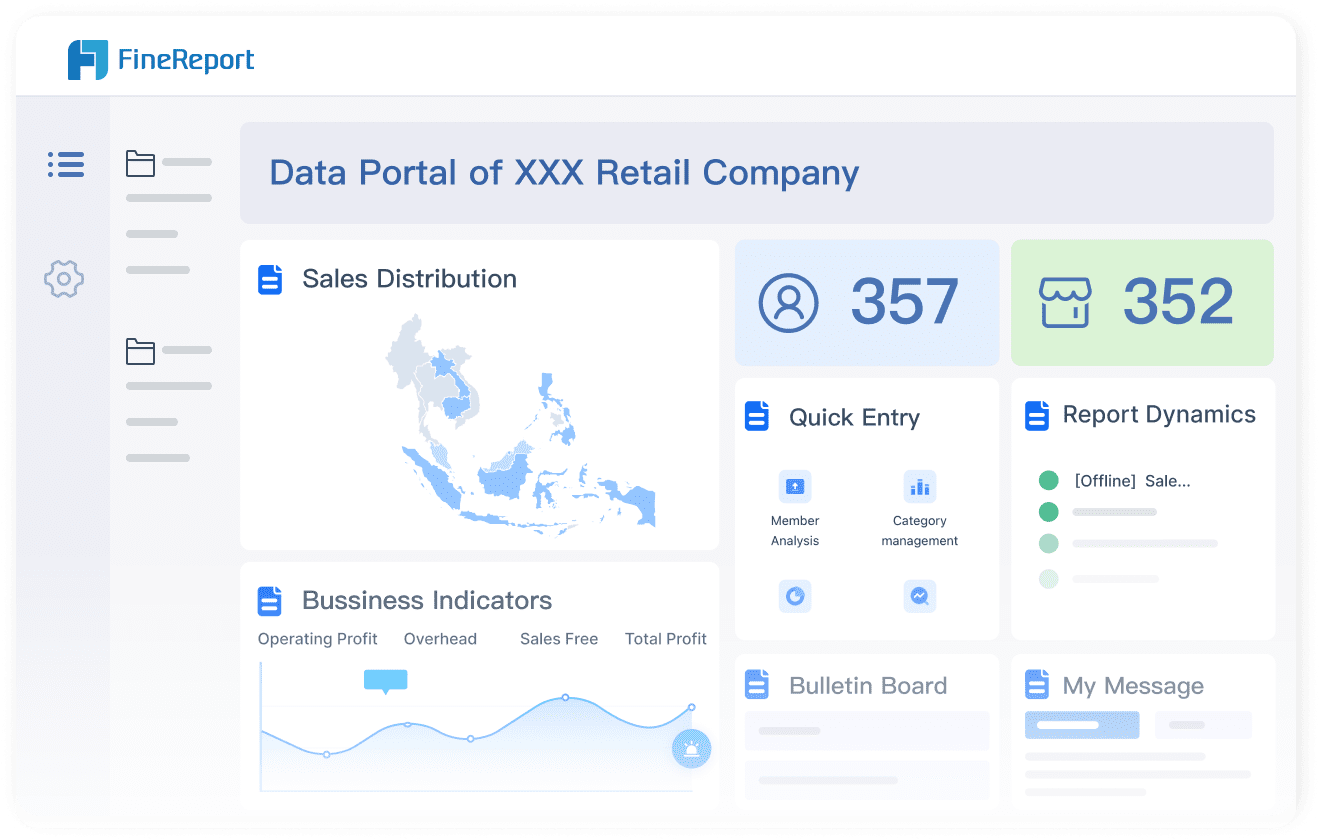
You need a financial management tool that makes financial analytics simple and effective. FineReport stands out by offering a user-friendly interface and advanced data analysis capabilities. You can access real-time insights and monitor your company financial health from any device. FineReport leverages big data technology to support complex business finances and revenue growth.
Here is how FineReport compares to other dashboard tools:
| Feature | FineReport | Other Dashboard Tools |
|---|---|---|
| User-friendly interface | Yes | Varies |
| Data analysis capabilities | Advanced | Basic to Advanced |
| Competitive intelligence | Emphasized | Less emphasis |
| Big data technology | Leveraged for real estate solutions | Not always available |
FineReport helps you solve common financial management challenges. You get real-time reporting and multi-dimensional analysis, which means you can identify trends and patterns in your business finances. The adaptability across devices lets you check key indicators and financial insights anytime, anywhere.
| Feature | Benefit |
|---|---|
| Real-time data monitoring | Enables timely decision-making by providing up-to-date information on business indicators. |
| Multi-dimensional analysis | Facilitates comprehensive insights into data, helping to identify trends and patterns. |
| Adaptability across devices | Allows users to access key indicators anytime and anywhere, optimizing time management. |
Tip: Use interactive dashboards to track revenue growth and cash flow management. This approach helps you respond quickly to changes in business performance.
You can see measurable outcomes when you use FineReport as your business intelligence tool. Companies improve project tracking and financial oversight, which builds trust with stakeholders. Real-time insights and automated compliance reporting reduce risks and foster a culture of responsibility.
| Outcome Type | Description |
|---|---|
| Project Tracking | Improved real-time tracking of project milestones and accomplishments, allowing for immediate resource reallocation. |
| Financial Oversight | Enhanced integration of financial data with project outcomes, building trust with funders and improving internal planning. |
| Compliance Reporting | Automation of compliance data collection, reducing risks and fostering a culture of safety and responsibility. |
| Stakeholder Communication | Dynamic dashboards tailored to different stakeholder needs, improving engagement and efficiency. |
| Predictive Analytics | Ability to forecast risks and challenges, enabling proactive strategy adjustments. |
| Cultural Impact | Shifted perception of reporting from a regulatory task to a continuous, interactive process that boosts morale and collaboration. |
| Enhanced Reputation | Improved credibility in the heritage conservation community, leading to new partnerships and funding opportunities. |
You gain the ability to forecast risks, adjust strategies, and improve your company financial health. FineReport supports your revenue dashboard needs and helps you achieve better financial analytics and real-time reporting. You build a stronger foundation for business performance and future revenue growth.
A finance dashboard is a digital tool that gives you a real-time, visual summary of your company’s financial health, helping you track key metrics, spot trends, and make faster, smarter decisions.
You need to compare financial dashboards based on how they display data, automate tasks, and integrate with your systems. The table below shows the main criteria and features you should look for in 2026:
| Criteria | Description |
|---|---|
| Real-time visibility | See instant updates on transactions and cash flow for quick decisions. |
| Comprehensive key metrics and KPIs | View important metrics like DSO, aging reports, and CEI at a glance. |
| Seamless integration capabilities | Connect automatically with your existing systems to keep data accurate and reduce manual work. |
| Intelligent automation features | Automate payment reminders, invoicing, and reporting to save time and focus on strategy. |
| Customization and role-based access | Give each team member the right view and permissions for their role. |
| Predictive analytics and AI insights | Use AI to forecast payment behaviors and spot high-risk accounts early. |
| Interactive visualizations | Explore data with charts and graphs for better understanding. |
| Access controls | Set permissions to keep data secure and compliant. |
| Automated reporting | Schedule and deliver reports automatically to keep everyone updated. |
Tip: Choose dashboards that let you customize views and automate routine tasks. This will help your team work smarter and respond faster to changes.
When you use advanced financial dashboards, you unlock several key benefits for your business:
Note: Financial dashboards help you move from manual processes to automated insights, making your reporting faster, more accurate, and more useful for every team member.
A finance dashboard is a digital tool that shows your company’s financial data in real time. You need the right dashboards to stay agile and make smart decisions in 2026. FineReport helps you transform financial management with automation and integration.
| Description | Reason for Importance |
|---|---|
| Agile finance leaders use technology for opportunities. | Dashboards adapt to changing financial landscapes. |
| New data processing creates concise insights. | Dashboards handle and present complex data. |
| Controllers need accurate, timely information. | Dashboards support real-time decision-making. |
| Integration with other systems is crucial. | Dashboards connect with CRM and billing systems. |
| Automation and AI free up time for strategy. | Dashboards enable strategic planning. |
You should assess your current dashboards, identify gaps, and involve stakeholders to improve selection and implementation:
Prioritize dashboards that align with your business goals for future-ready financial management.
Empower Your Business: Best Financial Reporting Tools 2025
7 Must-See Financial Dashboards for Modern Companies
How to Launch a Financial Reporting Dashboard with No Code

The Author
Lewis
Senior Data Analyst at FanRuan
Related Articles

Payment Analytics Dashboard: 12 KPIs Every Operations Leader Should Track to Cut Revenue Leakage
Losing revenue to declines? Discover 12 essential KPIs to track in your payment analytics dashboard to stop leakage and manage disputes.
Lewis Chou
May 05, 2026

SOC Dashboard Explained: 12 Essential KPIs, Views, and Workflows Security Teams Use
Learn about SOC dashboards, the 12 essential KPIs for security teams, and how they centralize alerts and workflows for faster threat detection and response.
Lewis Chou
May 05, 2026

EMR Dashboard Guide: 12 Metrics to Track for Faster Clinical and Operational Decisions
Learn the 12 essential EMR dashboard metrics to track for faster clinical and operational decisions, improving patient flow and revenue cycle management.
Lewis Chou
May 05, 2026


