A business analytics dashboard is a visual data analytics tool that brings together your most important metrics, charts, and performance indicators into a single, easy-to-understand interface for fast, actionable insights.
You use a dashboard to turn complex data into clear visuals, helping you spot trends and make data-driven decisions quickly. With real-time access to data, you can monitor key metrics, address bottlenecks, and improve communication across teams. This shared view boosts accountability and supports revenue growth by identifying inefficiencies and optimizing resource allocation. FineReport stands out as a top solution for building interactive dashboards and reports, giving you the tools to transform raw data into valuable insights.
Business Analytics Dashboard Overview
A business analytics dashboard is a visual tool that brings together your most important data from multiple sources, presenting it in charts, graphs, and tables so you can track KPIs, spot trends, and make informed decisions quickly.
What Is a Business Analytics Dashboard
You use a business intelligence dashboard to transform raw data into clear, actionable insights. An analytics dashboard aggregates information from different systems and displays it in one place. You see your KPIs, trends, and operational metrics through interactive visuals. This approach helps you understand your business performance at a glance.
- An analytics dashboard visualizes data in an understandable way.
- It combines data from various sources into a single interface.
- You view charts, graphs, and tables that summarize key information.
- The dashboard helps you identify trends, track progress, and make better decisions.

Business intelligence dashboards support both strategic and operational goals. They use advanced analytics and reporting tools to capture, integrate, and present data. You gain a clear overview of your business, which helps you act quickly and confidently.
Key Functions and Benefits
| Core Purpose | Description |
|---|---|
| Enhanced data-driven decision making | You get concise overviews of operational data for better visibility and decisions. |
| Real-time operational monitoring & optimization | You access real-time data for effective performance monitoring and optimization. |
| Proactive problem detection & prevention | The dashboard monitors critical thresholds and triggers alerts to prevent issues. |
| Improved collaboration and communication | You share a centralized platform for data access and teamwork. |
| Increased customer and user satisfaction | Real-time insights empower you and your customers to make smarter choices. |
You benefit from trend identification, increased efficiency, and accurate forecasting. Interactive data visualization and self-service features make analytics dashboards easy to use. You communicate better and respond faster to changes.
FineReport’s Role in Business Analytics Dashboards
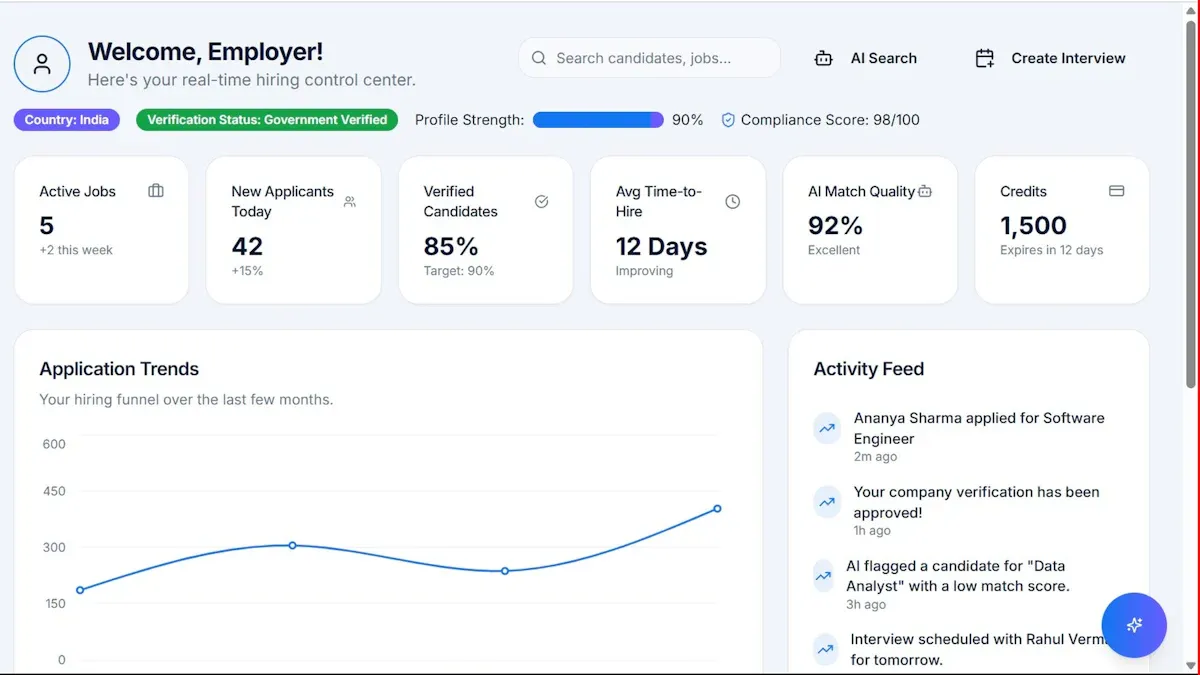
FineReport stands out as a leading business intelligence dashboard solution for large enterprises and government organizations. You can use FineReport to create dashboards that support funnel analysis, communication management, and strong data import/export capabilities. The platform offers templates, report access statistics, and active user tracking. You can visualize the top 10 reports, monitor average daily visits, and analyze user engagement with indicator cards and line charts.

FineReport’s business dashboards help you manage analytics, monitor KPIs, and gain real-time insights. You can build dashboards for sales, operations, finance, and web analytics dashboard needs. The flexible design and advanced analytics features make it easy to customize dashboards for your unique requirements.

How a Business Intelligence Dashboard Works
A business analytics dashboard is a visual platform that lets you monitor, analyze, and interact with your most important data in real time, helping you make informed decisions quickly and efficiently.
Data Integration and Connectivity
You start by connecting your business intelligence dashboard to multiple data sources. This process ensures that you always have access to the latest information. The integration follows a clear path:
- Evaluate and understand your data landscape.
- Choose the right business intelligence dashboard tool.
- Establish a robust data integration framework.
- Ensure data security and compliance.
- Train your team and build a data-driven culture.
You extract, transform, and load data from various systems. Decide which sources to use, select a data integration method, estimate extraction size, and connect to the data sources. The dashboard uses secure connections and role-based access to protect sensitive data.
| Feature | Description |
|---|---|
| Role-Based Access | Only users with the right permissions can view sensitive data. |
| Data Integration | Connects to multiple sources while following security protocols. |
| Real-Time Monitoring | Tracks data access and usage for compliance and safety. |
Visualization and Interactivity
Your business intelligence dashboard transforms raw data into clear visuals. You see charts, graphs, and tables that match your data type—bar charts for comparisons, line charts for trends. Interactive features let you zoom, filter, and drill down for details-on-demand. These tools help you uncover patterns and insights that static reports often miss.
- Interactive charts encourage you to explore data and find hidden trends.
- Customizable visuals let you tailor your dashboard to your needs.
- Drill-down capabilities reveal deeper layers of information.
Real-Time Updates and Mobile Access
A business intelligence dashboard delivers real-time updates, so you always work with the most current data. Mobile access means you can check your dashboard on any device, anywhere. This flexibility lets you respond to changes instantly and make decisions on the go.
| Benefit | Impact |
|---|---|
| Live data access | Teams act quickly and reduce downtime. |
| Mobile dashboards | Leaders respond to insights anytime, anywhere. |
| Instant decision-making | Crucial for fast-paced business environments. |
FineReport’s Dashboard Workflow
FineReport makes building a business intelligence dashboard simple. You use a drag-and-drop designer to create custom dashboards without coding. FineReport connects to over 100 data sources, supports real-time reporting, and offers mobile BI. You can integrate data from multiple channels, visualize it with interactive charts, and access insights wherever you are. FineReport’s workflow helps you save time, improve decision-making, and boost engagement across your organization.

Key Features of Analytics Dashboards
A business analytics dashboard is a visual tool that brings together your most important data, KPIs, and analytics into one place, helping you make faster, smarter decisions with clear, real-time insights.
Customizable Layouts and Visuals
You can shape your analytics dashboard to fit your business needs. Leading platforms let you use drag-and-drop tools, custom colors, and flexible layouts. You decide which KPIs and charts matter most, placing them front and center. This freedom helps you focus on what drives your business. A well-structured dashboard layout makes it easy to spot trends and act quickly. Customizable layouts also boost engagement, as you can tailor the experience for different teams or roles. You get to choose from a wide range of visualizations, such as bar charts, line graphs, and tables, making your data easy to understand.
Tip: Custom layouts help you prioritize the data that matters most, leading to better decisions and higher engagement.
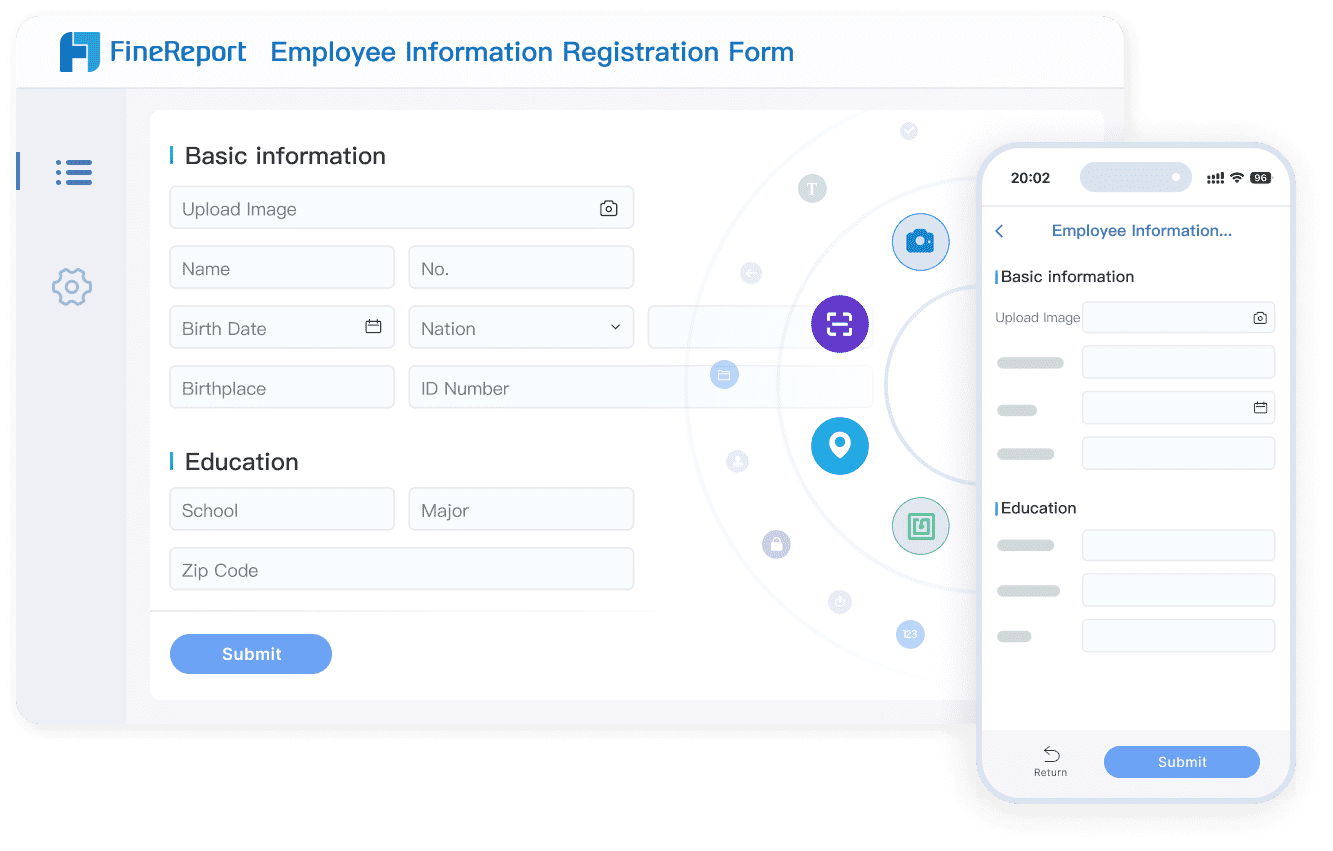
Data Entry and Validation
Your analytics dashboard should not just display data—it should help you collect and validate it, too. FineReport lets you build data entry forms for tasks like employee onboarding or customer records. You can import Excel files, use dropdowns, and set validation rules to keep your data accurate. Automated validation checks catch errors right away, so you avoid mistakes that could affect your analytics. Real-time validation at the point of entry ensures your business dashboards always show reliable information.
| Best Practice | Description |
|---|---|
| Automated Validation | Use software tools to catch errors early and keep your data accurate. |
| Clear Validation Rules | Set consistent rules for all data entry to improve quality. |
| Ongoing Monitoring | Use alerts and checks to maintain data integrity over time. |
| Real-Time Validation | Validate data as soon as it is entered to reduce later corrections. |
| Regular Audits | Check and clean your data regularly to remove errors. |
| Cross-Field Validation | Make sure related data points match up for logical consistency. |
You can restrict user input with dropdowns and predefined choices, which minimizes inconsistencies. Regular audits and cross-field validation help you maintain high-quality data across your business dashboards.
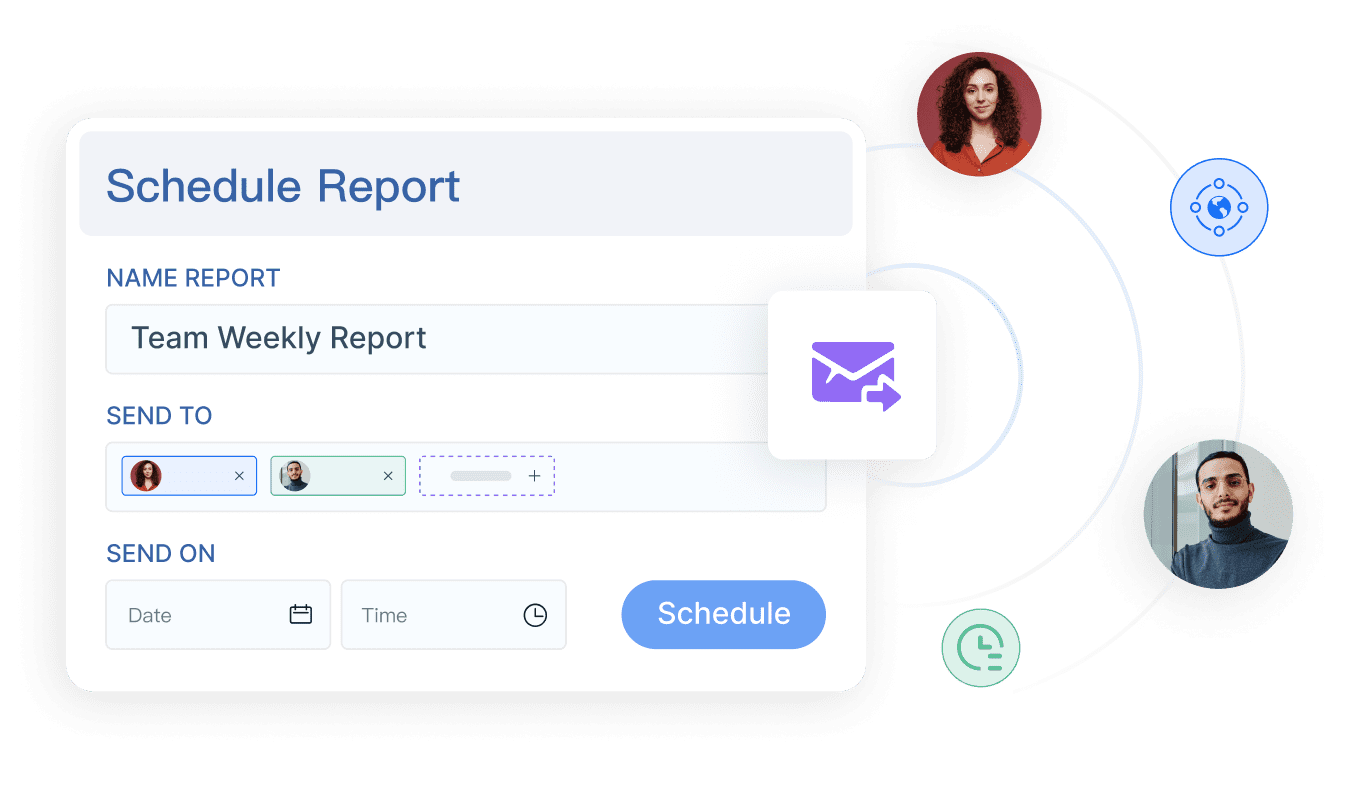
Scheduled Reporting and Automation
Automation is a game-changer for business dashboards. You can schedule reports to run daily, weekly, or monthly, so your team always has the latest insights. FineReport automates report generation and distribution, saving you hours of manual work. This means you spend less time compiling data and more time analyzing it. Scheduled reporting ensures stakeholders receive timely updates, improving communication and decision-making.
- Automation reduces repetitive manual tasks, freeing up your team for analysis.
- Scheduled reporting delivers timely insights to everyone who needs them.
- Consistent reporting improves overall data quality.
| Benefit | Description |
|---|---|
| Constant Updates | Reports update in real-time, so you always see the latest data. |
| Visual Overviews | Easy-to-read metrics help you spot trends and take action. |
| Streamlined Processes | Automation cuts down on manual data work, boosting efficiency. |
| Enhanced Collaboration | Stakeholders can access reports easily, supporting data-driven decisions. |
You also lower labor costs and reduce the need for IT support, as automated business dashboards handle routine tasks for you.
Collaboration and Permission Control
Business dashboards work best when your whole team can use them. FineReport supports collaboration by letting multiple users edit dashboards, add comments, and share insights. You can set user roles—like viewer, editor, or admin—so everyone sees only what they need. Fine-grained permission control keeps sensitive data secure, while collections and folders help you organize reports for different teams. Version control ensures everyone works with the latest data, avoiding confusion.
| Feature | Description |
|---|---|
| User Roles | Assign roles to control who can view or edit dashboards. |
| Multiple Editors | Allow several users to edit and update dashboards together. |
| Commenting/Annotations | Add notes or context directly on dashboards for better teamwork. |
| Version Control | Keep everyone on the same page with the latest dashboard version. |
| Collections/Folders Permissions | Organize dashboards and control access for different teams or projects. |
| Fine-Grained Permission Control | Set specific permissions for users or groups to protect sensitive data. |
| Collaborative Reporting | Work together to generate reports and share insights quickly. |
You can trust that your business dashboards remain secure and up to date, supporting teamwork and fast decision-making.
FineReport’s Advanced Dashboard Features
FineReport takes business dashboards to the next level with advanced features. You can create 3D dashboards that bring your data to life, making complex analytics easy to understand. The FineVis plugin adds even more data visualization options, letting you build interactive, animated dashboards. Mobile dashboards let you track KPIs and analytics on your phone or tablet, so you never miss an update. FineReport’s decision-making platform centralizes all your dashboards and reports, with strong user management and security controls.
| Feature | Description |
|---|---|
| 3D Visualization | Build 3D dashboards with zero code for smart cities, factories, and more. |
| Mobile Dashboards | Access dashboards on any device, including smartphones and tablets. |
| FineVis Plugin | Enhance your dashboards with advanced data visualization and animation. |
| Data Entry Forms | Collect and validate data directly within your dashboards. |
| Decision Platform | Manage all dashboards, users, and permissions in one secure place. |

You can use FineReport to build business dashboards for sales, operations, finance, or even a web analytics dashboard. The platform supports real-time updates, interactive visualizations, and seamless data integration, helping you turn analytics into actionable insights.
Types of Business Dashboards
A business analytics dashboard is a visual tool that brings together your most important data, KPIs, and analytics into one place, helping you make faster, smarter decisions with clear, real-time insights.
Operational Dashboards
You use operational business dashboards to monitor daily activities and performance. These dashboards focus on real-time data, helping you track KPIs like inventory levels, order status, or customer service tickets. Department teams rely on operational dashboards to spot issues quickly and keep processes running smoothly. For example, an eCommerce team might use an analytics dashboard to track inventory and shipping in real time.
Strategic Dashboards
Strategic business dashboards give you a high-level view of your organization’s progress toward long-term goals. These dashboards help you and your leadership team monitor KPIs that reflect overall business health, such as revenue growth or market share. You can use a strategic dashboard to align teams with company objectives and make informed decisions about future direction. A web analytics dashboard, for instance, can show trends in website traffic and conversions, supporting your digital strategy.
Analytical Dashboards
Analytical business dashboards help you dive deep into your data for complex analysis. You use these dashboards to compare trends, identify patterns, and make data-driven decisions. Analytical dashboards are popular in departments like sales and marketing, where you need to analyze campaign performance or customer behavior. You can use analytics to compare sales trends over time or evaluate the effectiveness of marketing strategies.
Tip: Analytical dashboards let you explore your data from multiple angles, helping you uncover hidden insights and improve your business strategies.
| Dashboard Type | Purpose | Target Audience | Examples |
|---|---|---|---|
| Operational | Performance monitoring and operations | Departmental level | Inventory tracking for eCommerce |
| Strategic | High-level business strategy | Organization-wide | Sales dashboard tracking KPIs |
| Analytical | In-depth insights for decision-making | Specific departments | Sales trends, digital marketing analytics |
3D Dashboards in FineReport
FineReport supports all major business dashboards, including advanced 3D dashboards. With 3D dashboards, you can visualize analytics in new ways. You track customer interactions, see which options users prefer, and validate future product designs. These dashboards help you personalize services and improve conversion rates. FineReport’s 3D dashboards bring your analytics to life, making it easier to understand complex data and drive continuous improvement.
| Advantage | Explanation |
|---|---|
| Enhanced Customer Insights | Track customer interactions for better understanding of preferences. |
| Better Personalization | Tailor services and recommendations using customer data. |
| Continuous Improvement | Use insights to guide product design and innovation. |
| Improved Conversion Rates | Help sales teams boost sales with data-driven support. |
You can use FineReport to build business dashboards for any scenario, from daily operations to strategic planning. The platform’s flexibility ensures you always have the right analytics dashboard for your needs.
Benefits and Use Cases of Business Analytics Dashboards
A business analytics dashboard is a visual tool that lets you track performance, analyze key metrics, and make informed decisions by bringing together data from different sources in real time.
Enhanced Decision-Making
You gain a clear advantage when you use business analytics dashboards to track performance. These dashboards help you spot trends, compare results, and make decisions faster. You see all your important data in one place, which means you do not waste time searching for information. The table below shows how dashboards improve decision-making:
| Improvement Type | Description |
|---|---|
| Improved efficiency | Automation reduces manual reporting time, letting you focus on strategy. |
| Improved insight discovery | Advanced analytics reveal hidden patterns for better planning. |
| Better communication | Visual reports make it easier to share insights with your team and stakeholders. |
Efficiency and Collaboration
You work more efficiently when everyone can see the same data and track performance together. Dashboards encourage teamwork and make it easy to share updates. Here are some ways dashboards boost efficiency and collaboration:
- Clear visibility into each person’s work builds accountability.
- Transparency motivates everyone to support team goals.
- Automatic data updates keep information consistent across departments.
- Real-time dashboards help you make quick decisions.
- Customizable views make it easy to find what you need.
- All your data appears in one place, so you do not miss important details.
Tip: When you use dashboards, you create a culture of transparency and teamwork.
Industry Applications with FineReport
You can use business analytics dashboards in many industries. FineReport supports funnel analysis, competitive intelligence, and communication management. Its dashboards help you track performance, visualize trends, and manage data with ease. FineReport’s interactive features and customizable reports make it a strong choice for any business that wants to improve decision-making.
Customer Success Story: BOE Technology Group
BOE Technology Group used FineReport to solve problems with scattered data and inconsistent metrics. By building a unified dashboard, BOE could track performance across factories and departments. The company reduced inventory costs by 5% and increased operational efficiency by 50%. FineReport’s dashboards helped BOE’s managers see real-time KPIs, compare results, and make better decisions. This success shows how the right dashboard can drive digital transformation and business growth.

A business analytics dashboard is a tool that lets you see your key data and metrics in one place for smarter decisions. You gain real-time insights, spot trends, and improve teamwork. FineReport gives you flexible dashboards and powerful reports. Try FineReport to start building your own dashboards. Begin your journey toward data-driven decision-making today.
Continue Reading About Business Analytics Dashboard
What is Sales Analytics and Why It Matters in 2025
Use Diagnostic Analytics for Smarter Business Decisions in Malaysia
How to Create a Data Analytics Strategy for Your Business


FAQ

The Author
Lewis
Senior Data Analyst at FanRuan
Related Articles

How to Build an Investment Portfolio Reporting Dashboard for Executives: KPIs, Benchmarks, and Drill-Down Views
Investment portfolio reporting for executives is not about showing every holding, transaction, and chart your investment team can produce. It is about giving CEOs, CFOs, CIOs, boards, and investment committees a fast, re
Yida YIn
Jun 25, 2026

12 KPI Reporting Examples for Executive Dashboards: What to Show in Weekly, Monthly, and Quarterly Reviews
Executive leaders do not need more data. They need decision ready $1 examples that match how often they review the business and what actions they are expected to take. A weekly $1 should surface fast moving risks and per
Yida YIn
Jun 25, 2026

How to Build a Digital Marketing Reports Dashboard: Executive Examples, KPIs, and Templates
A $1 is the control layer that helps executives and marketing leaders turn scattered channel data into fast, confident decisions. If you are a CEO, CMO, operations director, or marketing analytics lead, the real problem
Yida Yin
May 07, 2026