Popular BI tools help you collect, analyze, and visualize data from multiple sources so you can quickly turn raw information into clear, actionable business insights.You want to know which popular BI tools will help your organization stay ahead in 2025. Here’s a quick list:
- FineReport by FanRuan
- Microsoft Power BI
- Tableau
- Qlik Sense
- Looker
- SAP BusinessObjects
- Domo
- Sisense
- IBM Cognos Analytics
- Oracle Analytics Cloud
- Zoho Analytics
Business intelligence tools give you real-time data, so you can make smart moves fast and keep your data-driven business growing. Tools like FineReport empower you to spot trends, boost efficiency, and make every decision count.
What Are Business Intelligence Tools
BI Software Overview
You probably hear a lot about business intelligence tools, but what do they actually do for you? These programs help you collect, manage, and analyze your company’s data. You get to see both historical and current information, all in one place. Business intelligence software makes it easy to locate, retrieve, and document data, so you don’t have to dig through endless spreadsheets.
Here’s what leading technology research firms say about business intelligence tools:
- They use technological processes to collect, manage, and analyze organizational data for insights.
- They analyze historical and current data, then present findings in visual formats you can understand quickly.
- They help you turn unstructured data into actionable insights.
- They use ETL methods to pull together data from multiple sources.
- They let you access all types of data, whether it’s from your own systems or third-party sources.
You’ll find that business intelligence platforms often include features like self-service analytics platform access, so you can explore data without waiting for IT. Many modern solutions, such as cloud-based business intelligence, let you work from anywhere and scale as your business grows. If you want to dig deeper, a data analytics platform can help you uncover trends and patterns that drive smarter decisions.
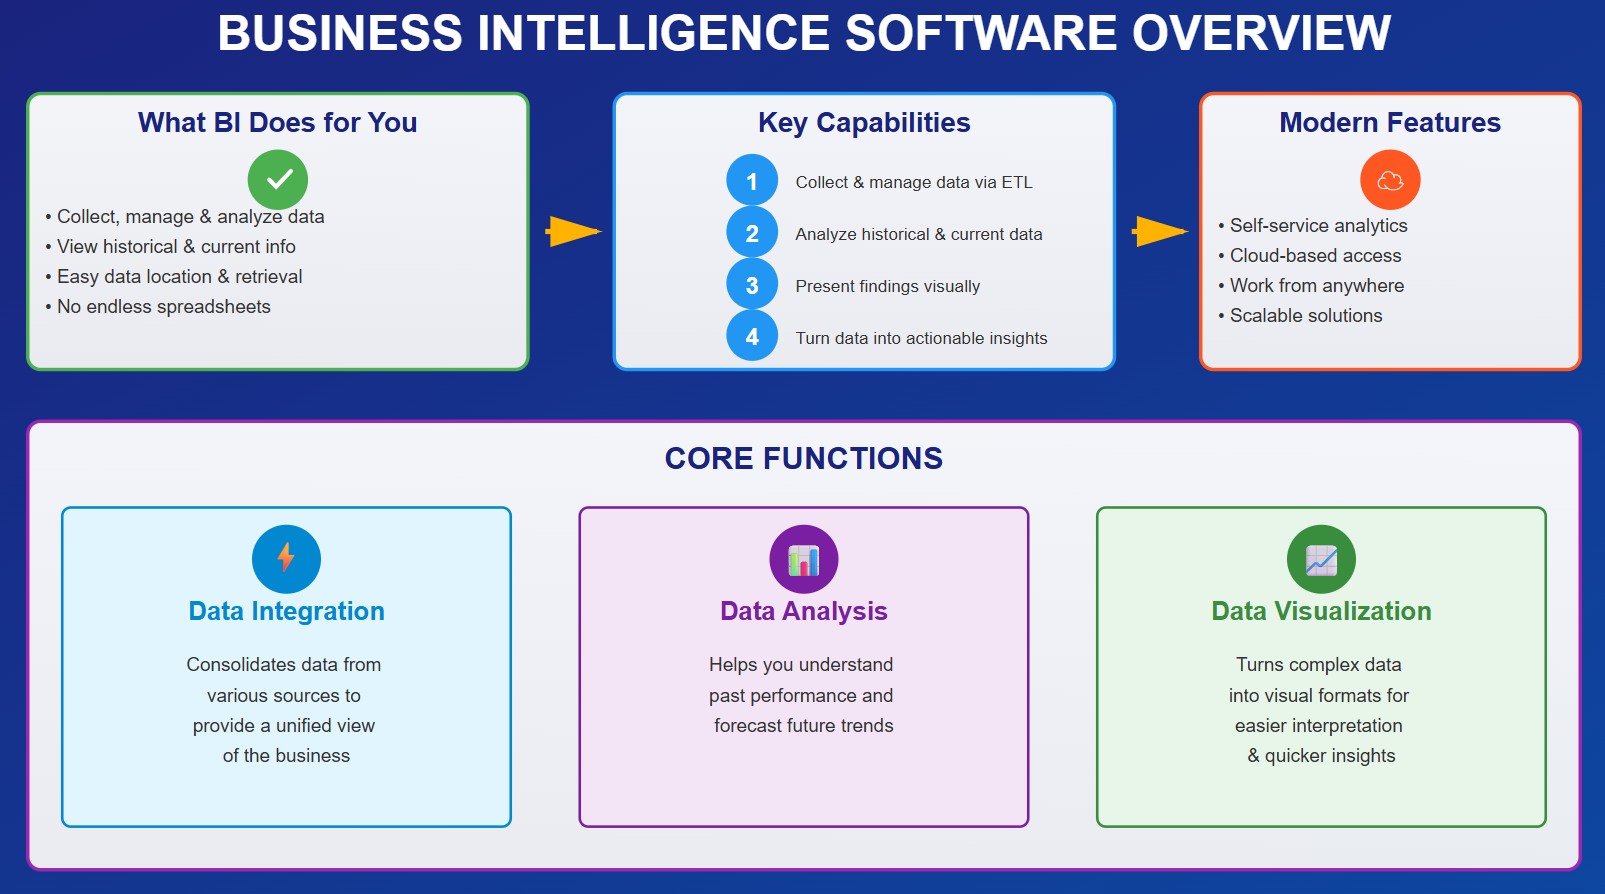
Here’s a quick look at the core functions of business intelligence software:
| Core Functionality | Description |
|---|---|
| Data integration | Consolidates data from various sources to provide a unified view of the business. |
| Data analysis | Helps you understand past performance and forecast future trends. |
| Data visualization | Turns complex data into visual formats for easier interpretation and quicker insights. |
Key Benefits for Organizations
When you use business intelligence tools, you unlock a whole new level of efficiency. You can track performance metrics in real time, which helps everyone stay accountable. Automation and custom reporting boost productivity, freeing up your team for more valuable work. You get streamlined processes because you can access diverse data and make decisions faster.
Business analytics tools give you a competitive advantage. You can analyze customer behavior and market trends, so you’re always one step ahead. Real-time analytics and real-time dashboards help you respond quickly to changes. Your support staff can resolve issues faster, thanks to comprehensive customer insights.
Here’s a table showing the benefits organizations report after using business intelligence tools:
| Benefit | Description |
|---|---|
| Traced accountability | Track performance metrics in real time and foster ownership. |
| Increased productivity | Automate reports and reduce labor costs. |
| Streamlined processes | Access diverse data and make faster decisions. |
| Competitive advantage | Analyze trends and anticipate market shifts. |
| Improved customer experience | Support staff get better insights for faster issue resolution. |
You’ll notice that data analytics, self-service analytics platform features, and data visualisation tools all work together to make your business smarter. With data visualisation, you can spot patterns and trends at a glance. Real-time analytics and data visualisation keep your team informed and agile. If you want to stay ahead, a strong data analytics platform is key.
Top 11 Popular BI Tools in 2025
You want to know which popular bi tools are making waves in 2025? Here’s a closer look at the top choices, each with its own strengths for data-driven organizations. Whether you’re after powerful analytics, easy data visualization, or seamless integration, you’ll find a solution that fits your needs.
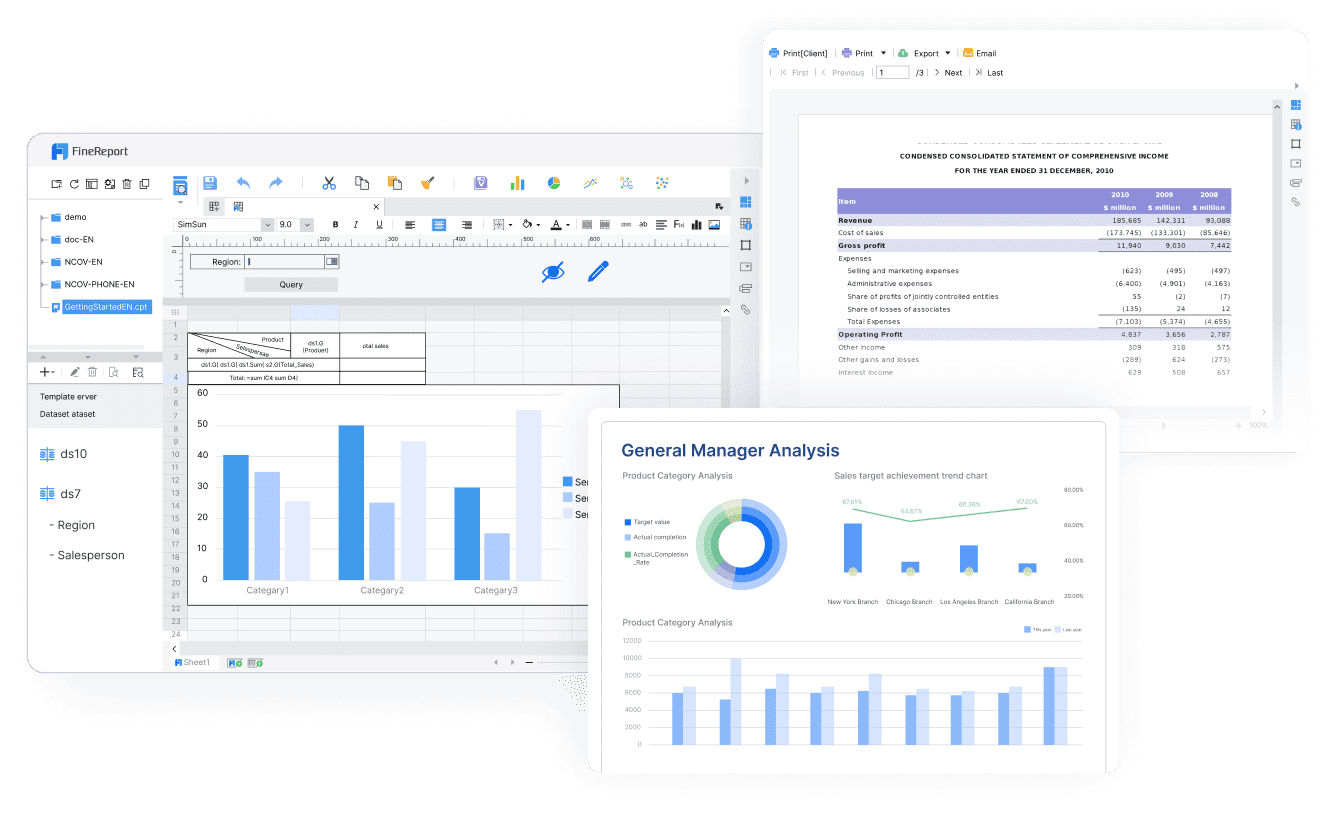
1.FineReport by FanRuan
FineReport by FanRuan is quickly becoming one of the most popular bi tools for organizations that need flexible reporting and powerful data integration. You can create custom reports with an Excel-like designer, making it easy to build pixel-perfect documents and dashboards. FineReport supports data collection from multiple sources, helping you break down data silos and unify your business information. The platform offers mobile BI capabilities, so you can access reports and dashboards on any device, anytime.
Website: https://www.fanruan.com/en/finereport
| Feature/Benefit | Description |
|---|---|
| Funnel Analysis | Facilitates funnel analysis and competitive intelligence for dynamic sales operations. |
| Custom Reporting | Extensive customization for reporting processes. |
| Data Import/Export | Easy data import and export. |
| Security Features | Strong protection for sensitive data. |
| 24/7 Support | Support available through chat, email, video, and phone. |
| Target Users | Large enterprises and government institutions. |
| Integration | Smooth integration for complex operational environments. |
FineReport lets you build regular, aggregation, and dashboard reports. You can use it on desktops, mobile devices, and large screens. The platform’s Excel-like design makes it easy for anyone to get started, even if you’re not a developer.

Bifido Foods, a leading company in Taiwan, used FineReport to integrate and analyze data from multiple sales channels and product lines. The flexible report designer and seamless integration improved their data-driven decision-making and boosted efficiency.
UnionPay Data Services, a subsidiary of China UnionPay, leveraged FineReport and FineBI to unify data visualization and analysis. Their system operation efficiency increased by 5%, and customer value identification accuracy reached 90%. The BI platform enabled precise marketing and customer segmentation, driving engagement and revenue.

You’ll find FineReport especially useful if you want to streamline reporting, automate data collection, and empower your team with real-time insights. The platform’s strengths in data visualization and integration make it a top choice for organizations aiming to elevate their business intelligence.

2.Microsoft Power BI
Microsoft Power BI stands out as one of the most popular bi tools for organizations of all sizes. You get a reliable platform that’s affordable and packed with features. Power BI lets you connect to over 300 data sources, so you can pull in information from almost anywhere. You can create reports quickly and use built-in AI to analyze trends and predict outcomes. Security is strong, with end-to-end encryption and compliance with more than 100 standards. If you ever get stuck, there’s a huge community and plenty of tutorials to help you out.

Website: https://www.microsoft.com/en-us/power-platform/products/power-bi
| Feature/Advantage | Description |
|---|---|
| Affordable and Reliable | Free for individuals, low-cost for teams. |
| Strong Data Analytics Capabilities | Rapid report generation and analytics. |
| Complete Data Source Support | 300+ connectors for easy integration. |
| Machine Learning and AI Integration | Advanced analytics with Azure Cognitive Services. |
| Strong Security Features | End-to-end encryption and compliance. |
| Extensive Documentation and Community Support | Tutorials and forums for best practices. |
3.Tableau
Tableau is another popular bi tool you’ll see everywhere. You can build interactive dashboards and explore data with just a few clicks. Tableau’s user-friendly interface makes it easy for anyone to create stunning data visualization, even if you’re new to BI. The platform scales well, so you can handle large datasets without slowing down. Tableau’s community is huge, so you’ll always find support and inspiration.

Website: https://www.tableau.com/
| Feature | Tableau | Other BI Tools |
|---|---|---|
| User-Friendly Interface | Yes | Varies |
| Community Support | Extensive | Limited |
| Scalability | High | Moderate to Low |
| Data Visualization Options | Wide Range | Limited Options |
| Ideal for Large Datasets | Yes | Not Always |
4.Qlik Sense
Qlik Sense gives you robust data processing and visualization capabilities. You can visualize key performance indicators and create dashboards that pull data from many sources. Qlik Sense reduces your dependency on IT, so employees can analyze data on their own. The platform handles large data volumes and provides real-time updates, which helps you make decisions faster. The user-friendly interface lets anyone create and modify reports, speeding up your workflow.

Website: https://www.qlik.com/us/products/qlik-sense
- Qlik Sense provides robust data processing and visualization capabilities.
- You can visualize key performance indicators effectively.
- Qlik Sense integrates data from various sources into cohesive dashboards.
- It reduces dependency on IT for data analysis, empowering employees.
- Qlik Sense handles large data volumes effectively.
- You get real-time data updates, enhancing decision-making.
- The platform enables self-service analytics, allowing users to access data easily.
- The user-friendly interface democratizes data access, improving data literacy.
- Employees can create and modify reports independently, speeding up decision-making.
5.Google Looker
Google Looker (Looker Studio) is a favorite among popular bi tools for advanced analytics. You get a user-friendly interface that helps teams make decisions based on real-time data. Looker converts unstructured data into actionable insights, and you don’t need advanced technical skills to connect to different data sources. Real-time analysis means you avoid delays from outdated information. The platform supports multi-user report collaboration, so your team can work together on data-driven projects.
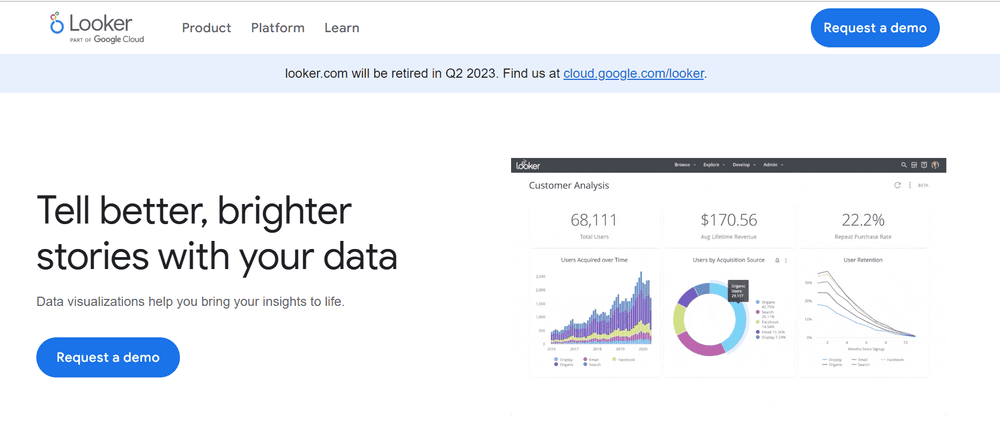
Website: https://lookerstudio.google.com/navigation/reporting
- Looker Studio offers a user-friendly interface for real-time decisions.
- You can convert unstructured data into actionable insights.
- Connect to various data sources without technical skills.
- Real-time analysis helps you avoid delays.
- Multi-user report collaboration enhances teamwork.
A major insurer used Looker Studio to eliminate data silos and enable real-time decision-making. This led to better customer engagement and faster claims processing.
6.SAP BusinessObjects
SAP BusinessObjects is built for large organizations that need comprehensive reporting and analytics. You can run ad hoc queries, analyze trends, and build interactive dashboards. The platform connects with SAP Business Warehouse and SAP HANA for real-time analytics. You get role-based dashboards, office integration, and powerful data visualization tools. SAP BusinessObjects scales easily and integrates with many ERP systems.
Website: https://www.sap.com/products/data-cloud/bi-platform.html
| Feature | Description |
|---|---|
| Comprehensive Reporting | Ad hoc queries and BI reporting. |
| Self-Service Capabilities | Intuitive visualization tools for trend analysis. |
| Real-Time Analytics | Connects with SAP BW and SAP HANA. |
| Large-Scale Data Analysis | Analyze big data sets for deep insights. |
| Cross-Enterprise Sharing | Share insights across the organization. |
| Role-Based Dashboards | Interactive dashboards for decision makers. |
| Office Integration | Multidimensional data analysis and filtering. |
| Data Visualization | Build impactful dashboards to assess risk and spot opportunities. |
- Built to scale for mid-sized and large enterprises.
- Flexible architecture for on-premises, hybrid, and cloud.
- Smooth integration with SAP and other ERP systems.
7.Domo
Domo is a cloud-based platform that boosts efficiency and productivity. You can connect data from different sources and create interactive dashboards. Domo’s automation features help you save time and reduce technology costs. The platform is known for increasing revenue and making teams more productive.
Website: https://www.domo.com/
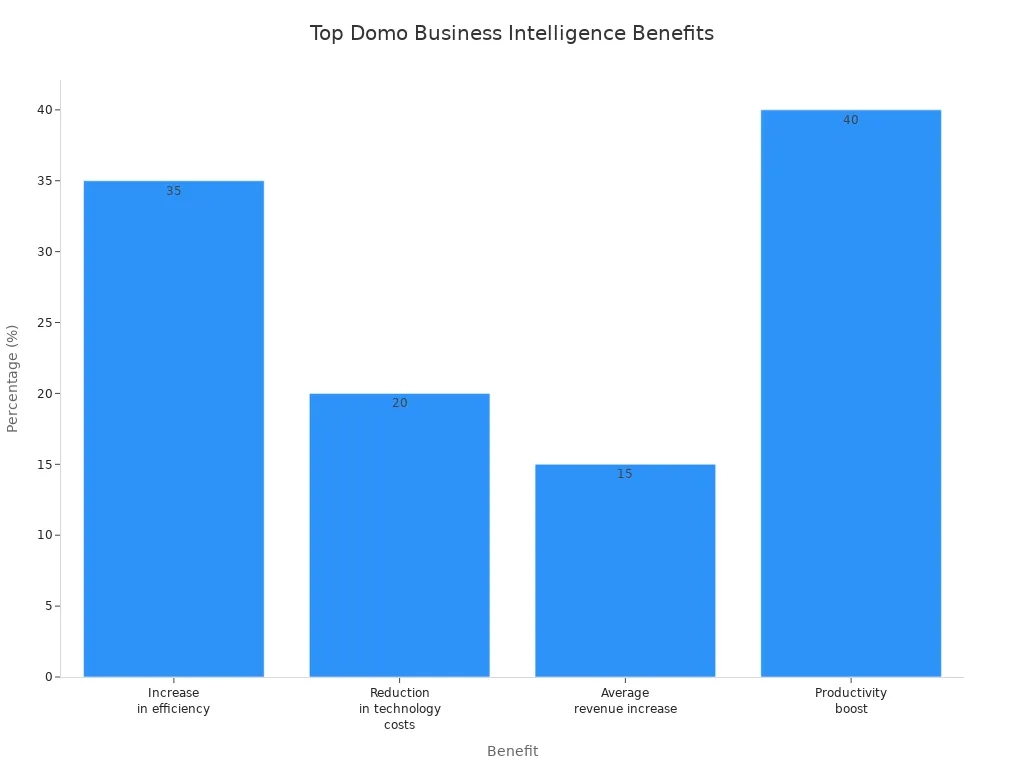
| Benefit | Metric |
|---|---|
| Increase in efficiency | 35% |
| Reduction in technology costs | 20% |
| Average revenue increase | 15% |
| Productivity boost | 40% |
8.Sisense
Sisense is a strong choice for mid-sized companies that want easy data integration and analytics. You can connect to many data sources, clean and transform data, and run complex queries. Sisense offers interactive reports and embedded analytics, so you can add BI features to other applications. The platform uses AI and machine learning for predictive analytics and ensures data security and compliance.

Website: https://www.sisense.com/
| Feature | Description |
|---|---|
| Data Integration | Connects to various data sources for consolidated analysis. |
| Data Preparation | Tools for cleaning and transforming data. |
| Data Analysis | Powerful analytics engine for custom reporting. |
| Visualization | Interactive reports and dashboards. |
| Embedded Analytics | Integrate analytics into other apps. |
| AI and Machine Learning | Predictive analytics for trend anticipation. |
| Security and Governance | Data protection and compliance. |
| Scalability | Grows with your organization. |
9.IBM Cognos Analytics
IBM Cognos Analytics gives you advanced reporting and AI-powered insights. You can deploy it on-premises or in the cloud, depending on your needs. Cognos offers self-service tools, so you don’t have to rely on IT for analytics. You can use geospatial mapping and interactive storytelling to make your data more engaging. The guided search function helps you find relevant data quickly.
Website: https://www.ibm.com/products/cognos-analytics
| Feature | Description |
|---|---|
| Advanced Reporting Capabilities | Fast, interactive report creation. |
| AI Integration | AI for data preparation and insights. |
| Deployment Flexibility | On-premises and cloud options. |
| User-Friendly Self-Service Tools | Analytics without heavy IT support. |
| Geospatial Mapping | Geographic analysis for better visualization. |
| Interactive Storytelling | Data-driven narratives for accessible insights. |
| Guided Search Function | Natural language processing for quick data discovery. |
| Data Modules | Combine and customize data from various sources. |
- Full BI capabilities from self-service analysis to advanced reporting.
- Mix of cloud-based and on-premise data sources.
- Disaster recovery and content backup options.
- Enhanced user experience with less need for IT training.
10.Oracle Analytics Cloud
Oracle Analytics Cloud is designed for global enterprises that need scalability and cloud integration. You get automatic resource allocation, high-speed data processing, and workload balancing. The platform supports thousands of users and billions of data rows, so you never have to worry about performance bottlenecks. Oracle Analytics Cloud is a unified, cloud-native platform for real-time decision intelligence.
Website: https://www.oracle.com/apac/analytics/
| Key Component | Function |
|---|---|
| Automatic Resource Allocation | Dynamic scaling based on demand. |
| High-Speed Data Processing | Quick analysis for large operations. |
| Workload Balancing | Even distribution to prevent bottlenecks. |
- Unified, cloud-native platform for real-time decisions.
- Elastic scale for growing data needs.
- Performance optimization for high concurrency.
11.Zoho Analytics
Zoho Analytics is a favorite among small and medium-sized businesses. You get affordable pricing and a user-friendly interface with drag-and-drop features. Zoho connects with over 500 data sources, so you can unify your data easily. The platform offers real-time insights, automated reports, and dashboards. Advanced features like forecasting and anomaly detection help you make smarter decisions.

Website: https://www.zoho.com/analytics/
| Advantage | Description |
|---|---|
| Affordability | Cost-effective pricing for SMBs. |
| Ease of Use | User-friendly interface and drag-and-drop. |
| Real-Time Insights | Automated reports and dashboards. |
| Broad Connectivity | 500+ data sources for unified analysis. |
| Advanced Features | Forecasting, anomaly detection, and AI-driven analytics. |
- Automated report scheduling for timely insights.
- Self-service BI lets you generate reports without IT.
- AI assistant Zia answers questions in plain English.
You’ve just explored the top 10 popular bi tools for 2025. Each tool brings something unique to the table, whether you need advanced analytics, easy data visualization, or seamless integration. With these options, you can choose the best fit for your organization and start making smarter, data-driven decisions.
Comparing Business Intelligence Software

Choosing the right business intelligence software can feel overwhelming. You want a tool that fits your needs, works with your data, and helps your team make smart decisions. Let’s break down the main things you should look for.
Features and Usability
You need software that makes your life easier. Most business intelligence tools offer features like AI-powered analytics, natural language queries, and easy forecasting. Some even let you use Jupyter notebooks for deeper analysis. You can upload data manually or automate the process. Security matters, so look for tools with strong compliance standards.
Here’s a quick table to help you compare:
| Feature Category | Key Aspects |
|---|---|
| AI/ML features | Personalized insights, easy forecasting, NLQ |
| Data Integration | Manual/automated uploads, own data warehouse |
| Data Security | SOC 2, GDPR, HIPAA, ISO 27001:2013 |
| Deployment Options | Hosted or self-hosted |
| Pricing | Scalable, low entry for small businesses |
FineReport by FanRuan stands out with its flexible report designer and strong data visualization capabilities. You can create custom dashboards and reports with a drag-and-drop interface. The software makes data visualization simple, so you can spot trends fast.

Integration and Scalability
You want your business intelligence software to connect with all your data sources. Some tools work best with their own ecosystem. For example, Power BI integrates smoothly with Microsoft products. Google Data Studio connects easily with Google services but may not handle complex analytics. Board and Incorta offer end-to-end solutions but might need extra pipeline tools.
| Tool | Integration Capabilities | Scalability |
|---|---|---|
| Power BI | Best with Microsoft products, robust connectors | Great for Microsoft users |
| Google Data Studio | Limited outside Google services | Not ideal for large-scale analytics |
| Board | Actionable insights across business components | Real-time, personalized dashboards |
| Incorta | Direct data source pulls | Needs extra pipeline tools |
FineReport connects to hundreds of data sources, including databases, files, and cloud platforms. You can scale up as your business grows. FanRuan’s solutions help you manage large data volumes and support real-time analytics.

Pricing and Support
Pricing models vary a lot. Some vendors use subscriptions, others charge by usage or number of users. You might see flat fees or tiered pricing. Support options also differ. Some companies offer 24/7 help, while others provide only basic support.
| Vendor | Pricing Model | Starting Cost | Support Options |
|---|---|---|---|
| Sisense | Quote-based, usage/user-based | $10,000/year+ | Custom support |
| Domo | Tiered, credit-based | $50,000–$100,000/year | Dedicated support |
| Qlik | License + data add-ons | $2,750/month | Community + direct |
| Power BI Embedded | Usage-based | $750/month | Microsoft support |
| FineReport | Scalable, tailored | Custom quote | 24/7 chat, email, phone |
FanRuan offers comprehensive support for FineReport. You get help whenever you need it, through chat, email, or phone. The company has a strong reputation for customer service and industry recognition.
Tip: Always check what’s included in the price. Some tools charge extra for advanced features or premium support.
Choosing the Right BI Tool
Assessing Business Needs
Start by looking at what your organization really needs. Think about where your data comes from and how you want to use it. Ask yourself if you need to pull data from many sources or just a few. Make sure the tool you choose can access, refresh, and work with your data easily. You should also check if the tool supports strong data quality and governance. Security matters, so look for options that let you control who sees what. If you want to create reports or dashboards, focus on tools with strong data visualization features.
Here’s a quick table to help you focus your assessment:
| Key Component | Description |
|---|---|
| Data Sources | Where your data comes from. |
| Data Quality and Governance | How well your data is managed and kept accurate. |
| User Access and Security | Who can see and use the data. |
| Reporting and Visualization | How you present and explore your data. |
| Scalability and Performance | Can the tool grow with your business? |
| Integration with Existing Systems | Will it work with what you already use? |
| User Training and Support | How easy is it to get help and learn? |
| Regulatory Compliance | Does it follow the rules for your industry? |
Technical Requirements
You want a tool that fits your team’s skills and your company’s tech setup. Look for software that scales as your data grows. Make sure it connects with your current systems. User-friendliness is key—your team should not struggle to learn it. Check if the tool offers AI features or mobile access if those matter to you.
- Scalability – Can it handle more data as you grow?
- Functionality – Does it have the features you need, like reporting or predictive analytics?
- Integration – Will it connect with your current databases and apps?
- User-friendliness – Is the interface simple for everyone?
Budget Considerations
Budgeting for a BI tool can be tricky. Some companies use quick estimates, while others dig into every detail. You might want to set aside extra funds for surprises. Review your budget often and adjust as you go. Here’s a table to compare common budgeting methods:
| Budgeting Technique | Pros | Cons | Solution |
|---|---|---|---|
| Top-Down Estimating | Fast and simple | Can miss details | Review and adjust regularly |
| Bottom-Up Estimating | Very accurate | Takes more time | Start detailed, update as needed |
| Three-Point Estimating | Handles uncertainty | Can be biased | Check and adjust with real-time data |
| Contingency and Reserve Analysis | Adds flexibility for surprises | Needs close tracking | Match reserve to project risks |
Vendor Support and Community
Don’t overlook support and community. You want a vendor who stands by you. FanRuan, for example, offers 24/7 support through chat, email, and phone. Their reputation for customer service and industry recognition means you get help when you need it. A strong user community can also make learning easier and help you solve problems faster.
Tip: Choose a vendor with proven support and a helpful community. This makes your BI journey smoother and more successful.
Choosing the right BI tool can transform how you work. You get clear data, faster decisions, and better teamwork. Take time to compare your options and think about what your business really needs. FineReport by FanRuan stands out for flexible reporting and strong support. Want to get started? Try a pilot with clear goals, train your team, and track results like ROI or user satisfaction. You’ll see the difference data-driven insights make.


FAQ

The Author
Lewis
Senior Data Analyst at FanRuan
Related Articles

ERP Reporting Explained: What It Is, How It Works, and Why Enterprise Teams Rely on It
ERP reporting is the process of turning data inside your enterprise resource planning system into usable business insight. For finance leaders, operations directors, supply chain managers, and IT teams, that matters beca
Yida Yin
Jun 25, 2026
8 Best Restaurant Reporting Software Tools for 2026: Compare FineReport, Toast, SpotOn & More
$1 is a highly customizable business intelligence and reporting platform that helps restaurants turn POS, labor, inventory, finance, and multi location data into real time dashboards and decision ready reports. 8 Best Re
Yida Yin
Jun 24, 2026

Database Reporting Architecture: When to Use a Reporting Database vs Your Operational System
$1 is not just about pulling data into a dashboard. It is an architecture decision that affects application performance, reporting speed, data trust, and how confidently your teams can make decisions. If you are an IT ma
Yida Yin
Jun 24, 2026