A business intelligence system helps you collect, analyze, and visualize data to guide your decisions. This technology lets you turn raw information into clear insights for your team. Today, only 20% of organizations use business intelligence software to support decision-making, but adoption is rising quickly. Studies show that business intelligence improves employee learning and enhances internal processes. Market data indicates global spending on business intelligence will nearly double by 2032. FineBI demonstrates how a modern business intelligence system can empower you to act on data efficiently.
A business intelligence system is a technology platform that helps you collect, manage, and analyze business data. You use it to transform raw information into actionable insights. According to leading technology analysts, business intelligence refers to a set of technologies and practices that support decision-making by presenting data in accessible formats, such as dashboards and reports. You do not need advanced technical skills to benefit from these tools. The system integrates data from multiple sources, allowing you to see trends and patterns that guide your business strategies.
The main goal of a business intelligence system is to help you make better decisions. You gain a deeper understanding of your operations, customers, and market conditions. The system improves operational efficiency by streamlining processes and reducing costs. You can access data quickly, which drives informed decision-making and supports strategic planning. Business intelligence systems also help you identify sales opportunities and understand customer preferences, giving you a competitive edge.
Tip: When you use a business intelligence system, you empower your team to act on real-time information and adapt to changing business needs.
Business intelligence systems offer a range of features that make data analysis easier and more effective. The most commonly cited features include seamless integration with various data sources, customizable dashboards, and advanced analytics powered by AI and machine learning. You can access cloud-based solutions from any device, which reduces costs and increases flexibility. Security and data protection remain essential, ensuring compliance with privacy laws.
| Feature | Description |
|---|---|
| Seamless Integration | Connects to internal and external data sources for comprehensive insights. |
| Customizable Dashboards | Lets you create reports and dashboards tailored to your needs. |
| AI-Powered Analytics | Uses artificial intelligence for predictive analytics and trend forecasting. |
| Real-Time Processing | Processes data instantly for timely decision-making. |
| Security and Data Protection | Protects sensitive information and ensures compliance. |
| Visualizations | Transforms complex data into clear, visual formats for easy understanding. |
You benefit from these features by gaining faster access to insights, improving collaboration, and making data-driven decisions. Business intelligence systems continue to evolve, preparing you for future challenges in a data-centric world.
Business intelligence systems help you transform raw data into actionable insights. You use these systems to collect, integrate, and analyze information from many sources. The workflow of a business intelligence system includes data integration, preparation, analysis, visualization, and decision support. Each step brings you closer to making data-driven decisions that improve your business performance.
You start by identifying the need for combined data. This often comes from user requests or organizational goals. You determine which data sources are relevant and select the specific data you need. You extract data from these sources in their native formats and combine them into a single dataset. You cleanse and normalize the data to ensure consistency and accuracy before loading it into analytics applications.
Business intelligence platforms use several integration techniques to streamline this process:
You benefit from automated integration, which is more reliable and efficient than manual methods. Consolidation reduces data silos and enables quick identification of opportunities.
FineBI demonstrates these capabilities with its robust data integration workflow. You connect to over 60 data sources, including databases, cloud warehouses, big data platforms, and APIs. FineBI supports both ETL and ELT modes, allowing you to process data before or after loading. You can upload files, connect to APIs, and use custom connectors for legacy systems. FineBI’s self-service business intelligence features let you create datasets, join tables, add formulas, and apply filters—all without coding. You preview results at every step, ensuring your data is ready for analysis and insight generation.
Tip: Clean and well-prepared data forms the foundation for effective business analytics and data insights.

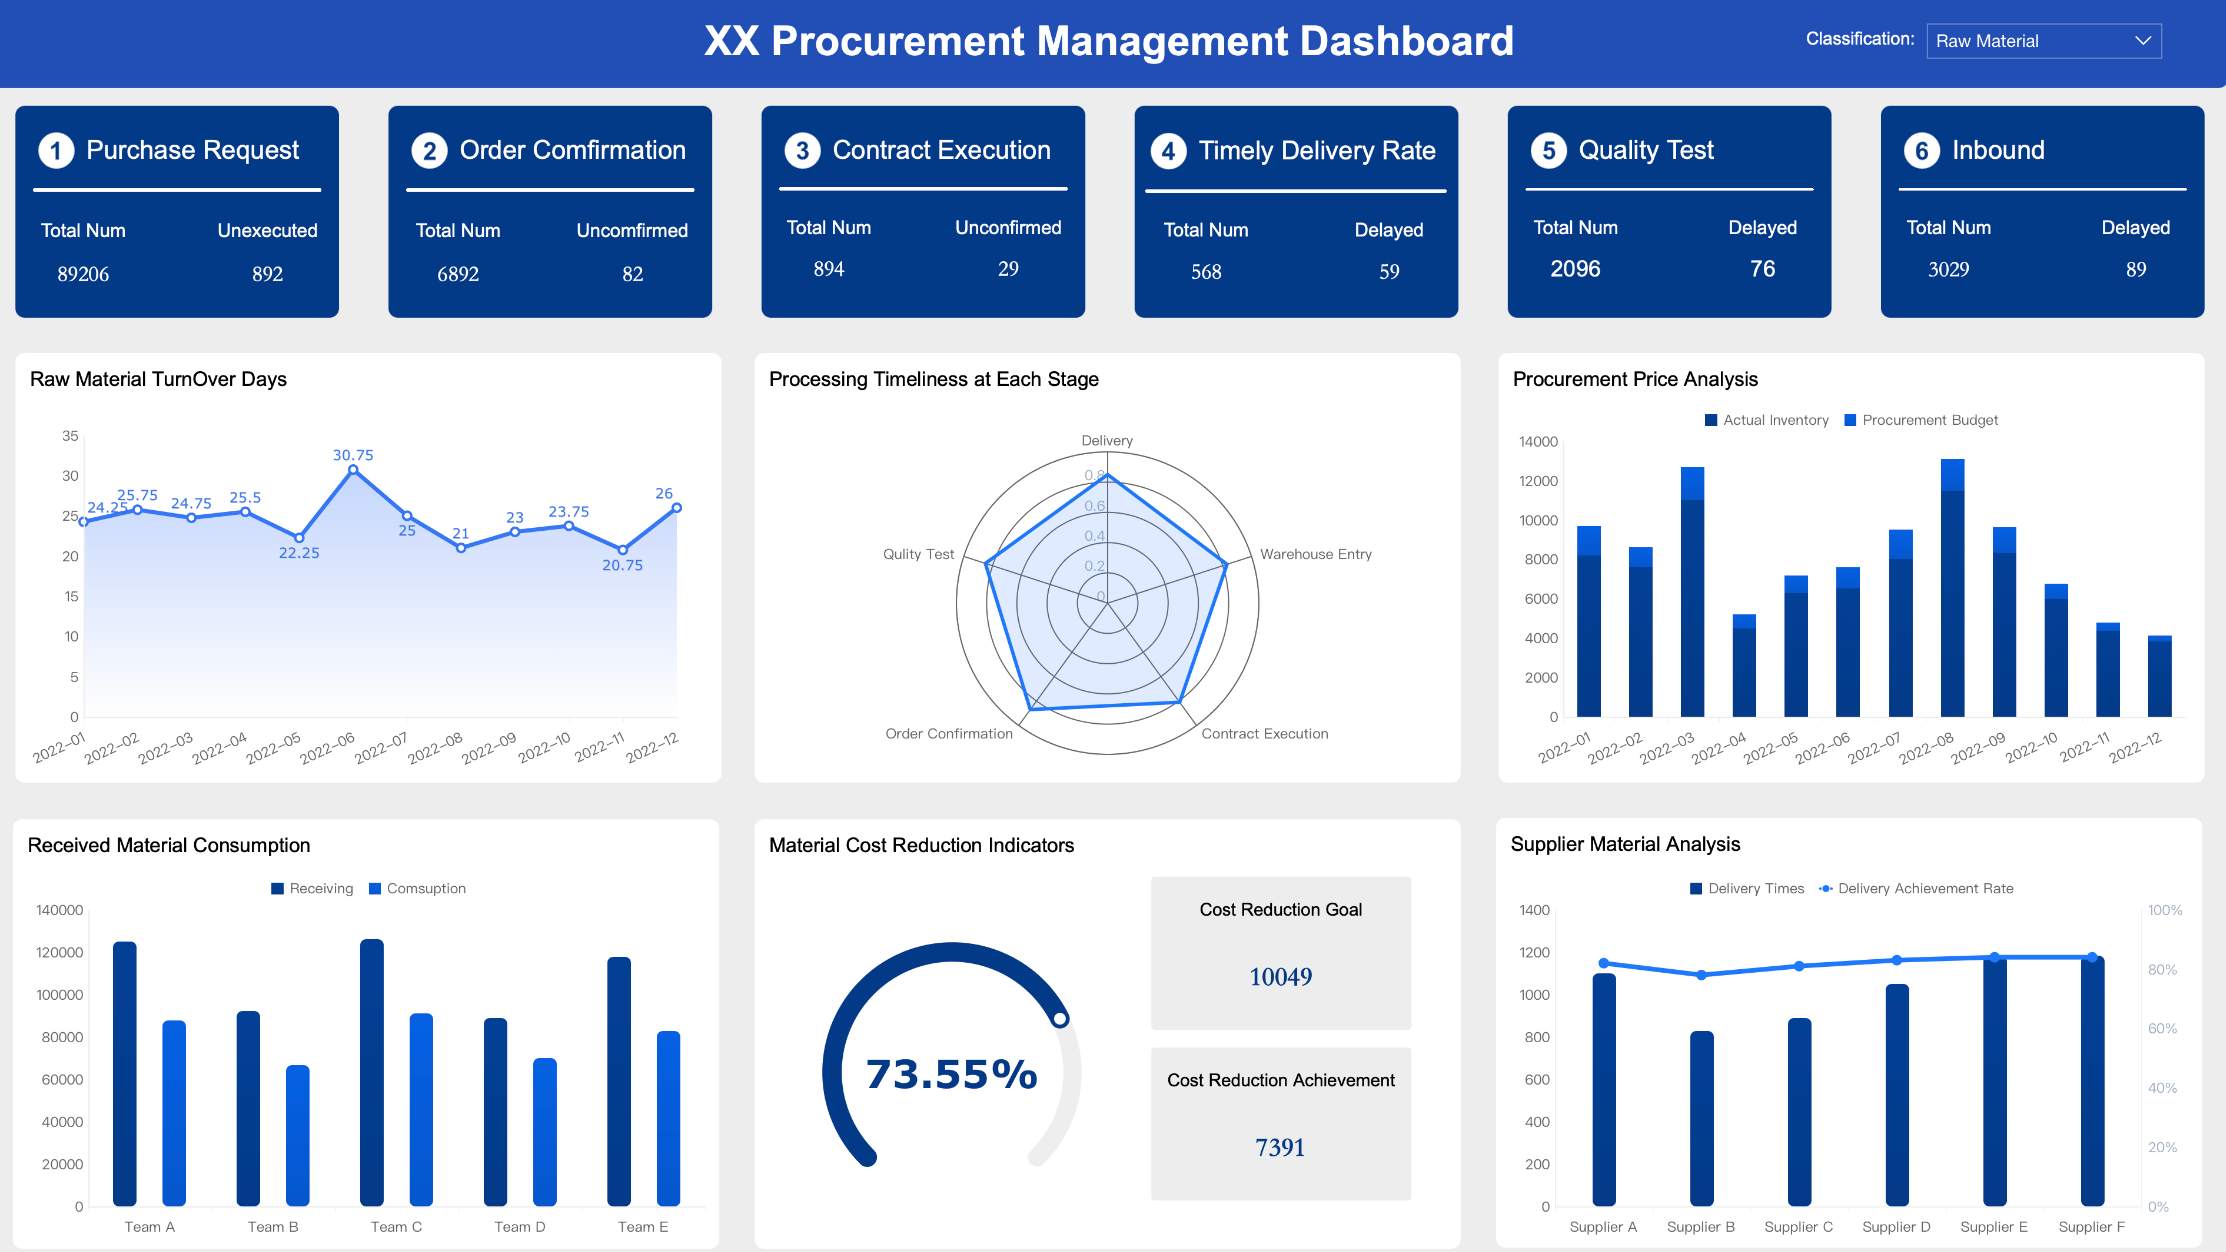
Once your data is integrated and prepared, you move to analysis and visualization. Business intelligence systems provide tools for exploring data, identifying trends, and generating insights. You use dashboards to visualize key metrics and business trends. These dashboards combine charts, tables, and indicators, giving you a unified view of your operations.
FineBI excels in this area with its intuitive drag-and-drop interface. You build dashboards by selecting visual components and arranging them to suit your needs. FineBI supports over 50 chart types, including bar charts, line charts, pivot tables, and geographic maps. You apply filters and slicers to analyze different dimensions and time periods. Real-time data processing ensures your dashboards reflect the most current information.
| Feature | Description |
|---|---|
| Intuitive Interface | Easily create visual dashboards using drag-and-drop tools. |
| Multiple Data Sources | Integrate databases, Excel files, APIs, and big data platforms. |
| Real-Time Analysis | Process large datasets efficiently for instant queries and analysis. |
| Self-Service BI | Conduct data analysis independently, without IT support. |
| Collaborative Function | Enable cross-departmental participation in data analysis. |
| Extensive Chart Types | Visualize data with over 50 chart types. |
| Data Exploration Features | Drill, filter, and link data for deeper analysis. |
FineBI’s self-service business intelligence approach empowers you to analyze data independently. You create self-service datasets, process existing data, and generate new metrics. The system recommends visual effects based on your selected data, speeding up analysis and insight generation. You can share dashboards instantly across your organization, supporting collaborative decision-making.
Note: Real-time data visualization helps you spot issues and opportunities as they arise, making your business analytics more effective.

Business intelligence systems support decision-making by providing accurate, timely, and actionable insights. You use these insights to understand business dynamics, forecast trends, and identify opportunities. Research shows that 67% of successful companies rely on business intelligence and analytics tools to make informed decisions.
You replace intuition with data-backed insights. Business intelligence systems and ERP platforms enable faster and more accurate decisions through real-time data analysis. You gain a clear view of your operations, customers, and market conditions. This leads to better business decisions and improved performance.
FineBI enhances this process with features like collaborative dashboards, role-based access control, and real-time data sharing. You set up alerts for critical metrics and receive notifications when thresholds are met. FineBI’s self-service business intelligence capabilities allow you to act on data insights quickly, without waiting for IT support. You can export results, generate reports, and share findings with your team.
Tip: Use business intelligence systems to drive your business intelligence strategy and make data-driven decisions that give you a competitive edge.
You see how business intelligence systems, especially platforms like FineBI, streamline the entire workflow from data integration to analysis and insight generation. You gain the tools to turn raw data into actionable insights, supporting your business analytics and decision-making processes.
You gain measurable advantages when you use a business intelligence system. Organizations report a 30% increase in operational efficiency after adopting these platforms. Data-driven companies are 23 times more likely to outperform competitors in customer acquisition. You see direct financial benefits, such as reduced data redundancy and lower compliance penalties. Indirect benefits include improved decision-making accuracy and increased user adoption. Business intelligence benefits extend to enhanced collaboration, faster reporting, and better resource allocation.
Note: Selecting the right performance indicators helps you assess the impact of your business intelligence projects.
| Key Aspect | Description |
|---|---|
| Performance Indicators | Assess the impact of BI projects using relevant metrics. |
| Direct Benefits | Reduce costs and improve efficiency in data handling. |
| Indirect Benefits | Enhance decision-making and increase user adoption. |
Business intelligence systems support a wide range of applications across industries. You use these tools to optimize supply chains, manage customer relationships, and improve financial operations. The table below shows how different sectors apply business intelligence to solve specific challenges.
| Industry | Application | Description |
|---|---|---|
| Supply Chain | Supply chain analysis | Analyze sales trends and supplier performance to optimize logistics and inventory. |
| Retail | Cross-selling opportunities | Review purchase patterns to create targeted upselling strategies. |
| Financial | Risk management | Detect vulnerabilities and mitigate risks using historical data. |
| Healthcare | Customized treatment plans | Combine health records to tailor care plans for patients. |
| Logistics | Delivery route assessment | Evaluate route data to reduce delivery time and costs. |
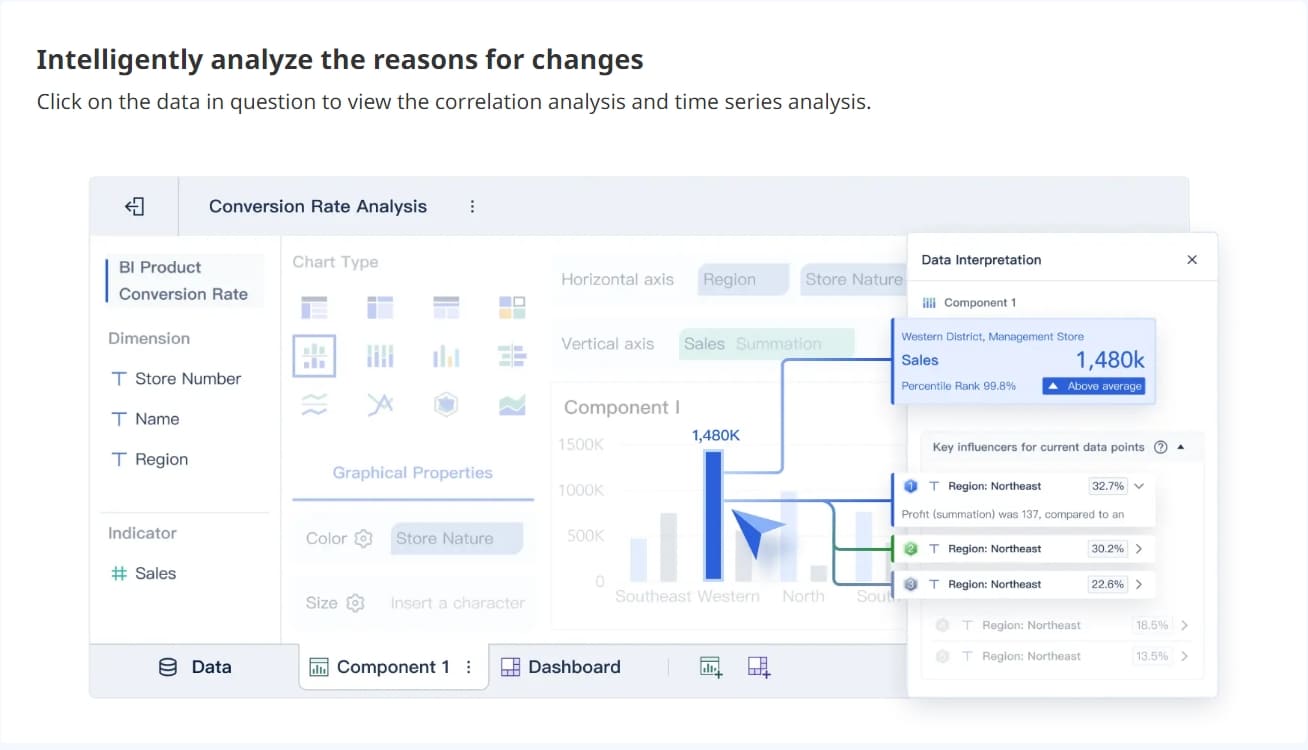
You also see business intelligence trends shaping the future, such as collaborative BI, real-time insights, and conversational analytics. Modern platforms now allow you to interact with data using natural language and trigger actions based on real-time insights.
FanRuan’s business intelligence solutions deliver results across industries. You can look at Bifido Foods, a Taiwanese company that improved its data integration and visualization using FineReport. The company streamlined reporting and enhanced decision-making by connecting data from multiple sales channels and product lines. FineBI enables you to create interactive dashboards, share insights securely, and collaborate across teams. You benefit from real-time analysis, predictive modeling, and enterprise-grade governance. These capabilities help you optimize operations, reduce costs, and maintain a competitive edge.
Tip: When you adopt a business intelligence system like FineBI, you empower your organization to act on data and drive continuous improvement.
You need to understand the main components that make up a business intelligence system. These components work together to help you turn raw data into valuable insights. Most business intelligence systems include the following:
Tip: A strong business intelligence system depends on effective data collection and integration, as well as clear visualization and distribution of insights.
Business intelligence tools help you analyze and visualize data efficiently. These tools offer features like security, metadata management, pre-built connectors, data profiling, and interactive dashboards. You can use natural language querying to ask questions in plain language and receive instant answers. Many business intelligence tools translate your requests into actionable insights, making data analysis easier for everyone.
| Core Features | Description |
|---|---|
| Security and management | Protects your data and controls user access |
| Metadata management | Organizes information about your data |
| Pre-built connectors | Links to popular data sources |
| Data preparation | Cleans and structures data for analysis |
| Interactive dashboard | Lets you explore data visually |
| Advanced analytics | Supports complex calculations and predictions |
When you choose business intelligence software, consider ease of use, integration with your existing systems, and the ability to scale as your organization grows. You should also look for strong business intelligence dashboards and data visualization tools that support your team’s needs.
FineBI stands out among business intelligence tools for several reasons. You get an intuitive drag-and-drop interface that makes building business intelligence dashboards simple. FineBI supports real-time analytics, so you always see the latest data. You can customize dashboards and reports to match your business needs. FineBI’s high-performance computing engine handles large datasets without slowing down.
| Feature | FineBI | Qlik Sense | Looker |
|---|---|---|---|
| Ease of Use | Intuitive drag-and-drop interface | Less intuitive | More complex |
| Real-time Analytics | Yes | Limited | Limited |
| Customization Options | Extensive | Moderate | Limited |
| Collaboration Features | Strong support | Moderate | Limited |
| Performance with Large Datasets | High-performance engine | Moderate | High scalability |
You benefit from FineBI’s user-friendly design, real-time data analysis, and strong collaboration features. FineBI helps you create business intelligence dashboards that support decision-making across your organization. You can rely on FineBI to deliver fast, accurate insights and empower your team to act on data.
When you implement a business intelligence system, you may face several challenges. Many organizations struggle with data silos, where information stays isolated in different departments. This separation makes it hard to get a complete view of your business. Integration issues often arise when you try to connect new tools with legacy systems. User adoption can also be a hurdle. Employees may resist change or lack the training needed to use new technology. Other common problems include choosing the right business intelligence software, managing costs, and ensuring proper governance and security.
You might also encounter these obstacles:
FineBI helps you overcome these challenges by providing a unified analytics platform. You can break down data silos and promote collaboration across departments. FineBI’s advanced data preparation tools make integration easier, even with complex or legacy systems. The platform supports self-service analytics, so users at all skill levels can participate in data-driven decision-making. With built-in governance and security features, you can control access and protect sensitive information.
Tip: Choose a business intelligence system that matches your operational needs and supports your team’s growth.
You can increase your chances of success by following proven best practices when adopting a business intelligence system:
Many industries have seen strong results by applying these practices. For example:
| Industry | Application of BI Best Practices | Benefits |
|---|---|---|
| Supply Chain | Real-time tracking and demand forecasting | Improved inventory and reduced delays |
| Manufacturing | Monitoring production and machine efficiency | Streamlined schedules and quality control |
| Retail | Analyzing sales and customer data | Better recommendations and higher satisfaction |
| Healthcare | Managing resources and patient care | Lower readmission rates and optimized staffing |
Note: Consistent communication and training help your team get the most value from your business intelligence system.
Business intelligence gives you the power to make informed decisions by transforming raw data into actionable insights. You improve team performance and adapt to market changes with real-time visibility into key metrics. FineBI delivers practical value through user-friendly dashboards, strong reporting, and seamless integration with over 60 data sources. To get started, define your objectives, build your BI team, select the right solution, and activate your insights for continuous improvement.

Business Intelligence As A Service Explained
How Business Intelligence Sales Solutions Help Exceed Target
What is SaaS Business Intelligence and How Does it Work

The Author
Lewis
Senior Data Analyst at FanRuan
Related Articles

How to Build a UAT Dashboard for BI Projects: KPIs, Workflow, and Sign-Off Criteria
Learn how to build a UAT dashboard for BI projects. Track KPIs, manage workflow, and define sign-off criteria to ensure successful releases.
Lewis Chou
May 05, 2026
How to Build a UAT Dashboard for BI Projects: KPIs, Workflow, and Sign-Off Criteria
A uat dashboard gives BI teams one place to control testing progress, $1, defect risk, and stakeholder sign off before release. For IT managers, BI product owners, analytics leads, and operations directors, this is not a
Eric
Jan 01, 1970

Customer Insights Dashboard: What Enterprise Teams Should Track and Why It Matters
Learn what enterprise teams should track in a customer insights dashboard to centralize data, improve decisions, and drive revenue and retention.
Lewis Chou
May 01, 2026


