

Inventory Turnover Ratio
Sean, Industry Editor
Aug 04, 2025
Understanding inventory turnover ratio gives business owners and managers a clear view of how often inventory sells and replenishes during a year. Many face challenges like overstocking, warehouse inefficiency, and cash flow constraints when managing inventory. A high inventory turnover ratio signals steady sales and strong liquidity, which means more cash remains available for daily operations. Mastering this metric allows analysts to spot risks, optimize inventory management, and make smarter decisions that improve efficiency and profitability.
Inventory Turnover Ratio Basics
What Is Inventory Turnover Ratio
Inventory turnover ratio measures how many times a business sells and replaces its inventory during a specific period, usually a year. Companies calculate this ratio by dividing the Cost of Goods Sold (COGS) by the average inventory value. The average inventory is the mean of the beginning and ending inventory for the period. This ratio shows how efficiently a company manages its stock and sales. A high inventory turnover ratio means products sell quickly and the business restocks often. A low ratio suggests slow sales or too much inventory on hand.
The inventory turnover ratio helps businesses spot slow-moving products, optimize stock levels, and improve demand forecasting. It also increases cash flow by ensuring that money is not tied up in unsold goods.
Some industries call this metric the stock turnover ratio. Both terms describe the same concept: how often inventory cycles through the business. Companies use this ratio to compare performance over time or against industry benchmarks.
Why Inventory Turnover Ratio Matters
Tracking inventory turnover is essential for several reasons. It reflects how well a business matches its inventory to customer demand. When companies monitor this ratio, they can:
- Identify inefficiencies such as overstocking or stockouts.
- Understand product demand and align inventory levels with actual sales.
- Optimize cash flow by reducing the amount of money tied up in inventory.
- Lower storage and holding costs by minimizing dead stock.
- Make smarter decisions about purchasing, stocking, and supply chain management.
- Improve forecasting accuracy and maintain a competitive edge.
- Strengthen supplier relationships and use inventory management tools for real-time visibility.
A high inventory turnover ratio often signals lean inventory practices and the ability to meet customer demand. It also improves cash flow by reducing holding costs and excess stock. On the other hand, a low inventory turnover ratio can reveal problems such as overstocking, slow-moving products, or missed sales opportunities due to stock sell-outs.
Neglecting inventory turnover can lead to stock imbalances, wasted storage space, and increased risk of obsolete inventory. Businesses may face cash flow problems and customer dissatisfaction if they do not track this key metric.
Inventory Turnover Ratio Formula
How to Calculate Inventory Turnover Ratio
Understanding how to calculate inventory turnover helps businesses measure how efficiently they manage stock. The inventory turnover formula is a standard method recommended by accounting authorities. It uses two main components: Cost of Goods Sold (COGS) and Average Inventory.
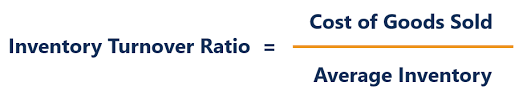
- Inventory turnover ratio = Cost of Goods Sold / Average Inventory
- Cost of Goods Sold (COGS) represents the direct costs of producing goods that a company sells during a period.
- Average Inventory is the mean value of inventory held over the same period. Most analysts calculate it as (Beginning Inventory + Ending Inventory) / 2.
Using COGS instead of sales in the formula gives a more accurate picture because sales figures include markups that can distort the ratio.
The table below explains each component and its typical source:
| Component | Definition / Description | Typical Source / Calculation Method |
|---|---|---|
| Cost of Goods Sold | Direct cost of sales, including expenses, labor, and raw materials | Found on the income statement; excludes general overheads |
| Average Inventory | Average value of inventory during the accounting period | (Beginning Inventory + Ending Inventory) / 2 |
Companies use the inventory turnover formula to see how many times they sell and replace inventory in a year. A higher inventory turnover ratio means products move quickly, while a lower ratio may signal slow-moving stock.
Inventory Turnover Calculation Example
A step-by-step inventory turnover calculation helps clarify the process. Consider a mid-sized manufacturing company with the following data:
- Find the beginning and ending inventory values from the balance sheet. For example, beginning inventory at the end of 2023 is 90,000.
- Calculate average inventory:
- (120,000 + 90,000) / 2 = $105,000
- Identify the Cost of Goods Sold (COGS) from the income statement for 2024. In this case, COGS is $260,000.
- Divide COGS by average inventory to get the inventory turnover ratio:
- 260,000 / 105,000 = 2.48
This result means the company sold and replaced its inventory about 2.48 times during 2024.
Managers can use this inventory turnover ratio to compare performance with industry benchmarks or track improvements over time.
Interpreting Inventory Turnover Ratio
High vs. Low Inventory Turnover Ratio
The inventory turnover ratio gives insight into how well a company manages its stock. A high inventory turnover ratio shows that products sell quickly and the business restocks often. This usually means strong sales, efficient inventory management, and less risk of holding outdated goods. Companies with high turnover often see better cash flow and lower storage costs.
The table below highlights key performance indicators related to high inventory turnover:
| KPI Name | Definition & Formula | Importance & Relation to High Inventory Turnover Ratio |
|---|---|---|
| Inventory Turnover Ratio | Measures how often inventory is sold and replaced. Formula: COGS / Average Inventory | High ratio indicates quick sales, reduced holding costs, and less risk of obsolescence. |
| Days Sales of Inventory (DSI) | Average days to sell inventory. Formula: 365 / Inventory Turnover Ratio | Lower DSI means faster turnover, improving cash flow and reducing carrying costs. |
| Gross Margin Return on Investment (GMROI) | Gross margin earned per dollar invested. Formula: Gross Margin / Average Inventory Cost | Higher GMROI shows better profitability and efficient inventory investment. |
| Stock-Out Rate | Frequency of stockouts. Formula: (Number of Stock-Outs / Total Inventory Items) × 100 | Low stock-out rate supports customer satisfaction and indicates balanced inventory aligned with demand. |
| Carrying Cost of Inventory | Expenses of holding inventory. Formula: (Total Carrying Costs / Average Inventory Value) × 100 | Lower carrying costs are associated with efficient inventory management and higher turnover. |
| Order Accuracy Rate | Percentage of correctly fulfilled orders. Formula: (Accurate Orders / Total Orders) × 100 | High accuracy reduces errors and supports operational efficiency, complementing fast inventory turnover. |
| Fill Rate | Percentage of orders fulfilled completely and on time. Formula: (Orders Fulfilled on Time / Total Orders) × 100 | High fill rate indicates inventory well-matched to demand, supporting high turnover without stockouts. |
| Return on Inventory (ROI) | Profitability from inventory investments. Formula: (Net Profit from Inventory / Average Inventory Cost) × 100 | Higher ROI reflects effective inventory management and profitability linked to turnover efficiency. |
A low inventory turnover ratio tells a different story. It often points to slow-moving products, excess stock, or weak demand. Businesses with low inventory turnover face higher carrying costs, more risk of obsolete goods, and less cash available for other needs. The main causes and effects of low inventory turnover include:
- Decreased or insufficient demand for products.
- Excessive inventory carrying costs such as storage and insurance.
- Inefficiencies in inventory management.
- Solutions include:
- Improving marketing strategies.
- Adjusting pricing.
- Discontinuing poorly performing products.
- Using automation for better data accuracy.
- Balancing inventory levels is crucial to avoid high costs and meet customer demand.
- High inventory turnover can also cause stockouts and lost sales, so balance is key.
What the Ratio Reveals
The inventory turnover ratio reveals much about a company’s sales health, cash flow, and inventory management practices. High inventory turnover frees up cash, reduces storage costs, and supports better demand planning. For example, Cherry Woods Furniture had a turnover ratio of 2.94, meaning it took about 124 days to sell its inventory. This figure helped the company adjust its stock levels and improve sales velocity.
Major retailers like Walmart and Zara use inventory turnover data and advanced analytics to optimize their supply chains. They use technologies such as RFID and AI to track inventory-to-sales patterns, reduce costs, and respond quickly to market changes. These companies identify bottlenecks by analyzing locations or products with low turnover, then adjust warehouse placement and shipping routes to improve efficiency.
Data-driven inventory management can reduce stockouts by up to 65% and lower inventory levels by 20–30%. Businesses that use inventory turnover and stock turnover ratio metrics can also see higher financial performance. Flexible financing tied to turnover improvements has led to significant revenue growth, with some companies reporting a 73% increase in customer revenue after optimizing inventory.
What Is a Good Inventory Turnover Ratio
Industry Benchmarks
A good inventory turnover ratio depends on the industry. Each sector has its own standards based on product type, shelf life, and business model. For example, grocery stores and fast fashion brands need to move products quickly to avoid spoilage or obsolescence. In contrast, industries like heavy machinery or luxury goods hold inventory longer due to higher value and slower sales cycles.
The table below shows average inventory turnover ratios by industry, based on recent benchmarking reports:
| Industry | Inventory Turnover Ratio |
|---|---|
| Financial | 227.47 |
| Services | 23.84 |
| Retail | 13.79 |
| Energy | 9.97 |
| Transportation | 9.05 |
| Technology | 7.82 |
| Utilities | 7.02 |
| Consumer Discretionary | 5.94 |
| Consumer Non-Cyclical | 5.73 |
| Basic Materials | 5.02 |
| Conglomerates | 3.71 |
| Healthcare | 3.00 |
| Capital Goods | 2.44 |
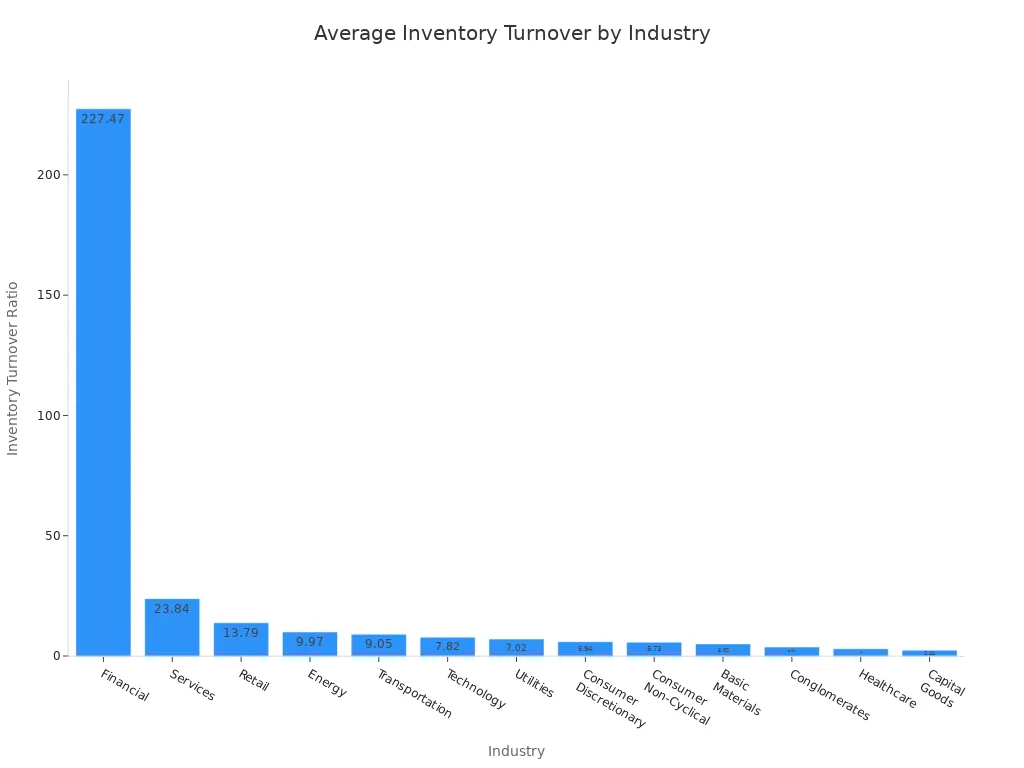
Industry-specific factors shape what is considered an ideal inventory turnover. Perishable goods and fast-changing trends push some sectors to aim for higher ratios. In contrast, industries with customized or high-value products accept lower ratios due to longer production cycles and deliberate inventory holding.
Setting Realistic Goals
Businesses should set inventory turnover goals that reflect their unique situation. The process starts with analyzing historical sales data and seasonal trends. Benchmarking against industry standards helps companies understand where they stand. For example, a retailer may compare its ratio to the industry average of 13.79, while a manufacturer of capital goods may target a lower figure.
To set effective goals, companies can follow these steps:
- Categorize products by importance using ABC analysis.
- Forecast demand with market research and statistical methods.
- Calculate Economic Order Quantity (EOQ) to balance ordering and holding costs.
- Determine safety stock to buffer against demand changes.
- Set reorder points based on usage and lead times.
- Optimize inventory for cash flow by negotiating supplier terms and avoiding overbuying.
- Use inventory management systems with real-time tracking and automated reordering.
Companies that monitor and adjust their inventory turnover ratio regularly can improve efficiency, reduce costs, and stay competitive in their industry.
Improve Inventory Turnover Ratio

Strategies for Better Inventory Turnover
Businesses can improve inventory turnover ratio by adopting proven strategies that enhance efficiency and accuracy in inventory management. Companies often start by using barcoding systems and mobile devices. These tools reduce human error and provide real-time updates on inventory levels. Optimizing warehouse layout helps maximize space and improve product flow, making it easier to locate and move items quickly. Proper storage solutions tailored to product types also support better inventory control.
Many organizations implement efficient order picking methods, such as pick-to-light or voice picking, to increase accuracy and reduce retrieval time. Strengthening supplier relationships through proactive communication and performance monitoring ensures timely deliveries and accurate stock levels. Demand forecasting plays a key role. By analyzing historical sales data and market trends, businesses can predict customer demand and maintain optimal inventory levels. Some companies use Just-In-Time inventory systems to minimize holding costs and improve cash flow.
Regular inventory audits help identify slow-moving or obsolete stock. Businesses can address these items through discounts or promotions. However, companies should watch for common pitfalls. Seasonality can distort inventory turnover ratio if not managed carefully. Slow-moving, high-cost items tie up working capital. Over-ordering in bulk may lead to excess stock. Inaccurate inventory data and dead stock also reduce turnover. Investing in reliable inventory management software helps avoid these issues.
Tip: Combining technology with strong supplier partnerships and regular audits creates a solid foundation for effective inventory management.
Using FineBI for Inventory Turnover Ratio Analysis
FineBI empowers organizations to analyze and optimize inventory turnover ratio in real time. The platform consolidates data from multiple sources, providing instant visibility into inventory levels. FineBI uses AI and machine learning to forecast demand and identify trends, helping businesses anticipate changes and adjust inventory control strategies quickly.
With customizable dashboards and reports, users can track key metrics and spot issues before they impact operations. FineBI integrates with ERP and other enterprise systems, unifying financial and operational data for a complete view of inventory management. Real-time insights allow teams to respond to market shifts and operational challenges with agility.
FineBI offers strong security, scalability, and ease of use. Even users without technical skills can explore data and make informed decisions. The platform supports end-to-end visibility of supply chain processes, transforming raw data into actionable insights. Recent advancements in AI and sensor technologies, such as predictive analytics and real-time tracking, further enhance inventory analysis and optimization.
Data-driven decision-making with FineBI helps businesses reduce stockouts, lower costs, and achieve continuous improvement in inventory turnover ratio.
Understanding and managing inventory turnover ratio supports long-term business growth. Companies that monitor this metric benefit from reduced holding costs, improved cash flow, and higher customer satisfaction. FineBI enables teams to track inventory management in real time, automate reporting, and respond quickly to market changes. Regular review of inventory metrics helps prevent excess stock and supports efficient operations.

FanRuan
https://www.fanruan.com/en/blogFanRuan provides powerful BI solutions across industries with FineReport for flexible reporting, FineBI for self-service analysis, and FineDataLink for data integration. Our all-in-one platform empowers organizations to transform raw data into actionable insights that drive business growth.
FAQ
A healthy inventory turnover ratio depends on the industry. Most retailers aim for a ratio between 5 and 10. Manufacturers often see lower ratios. Companies should compare their ratio to industry benchmarks for the best results.
Businesses should review their inventory turnover ratio at least once per quarter. Regular checks help managers spot trends, address issues quickly, and keep inventory levels balanced.
Yes. FineBI connects to accounting and ERP systems. It updates inventory turnover ratios automatically. Users see real-time data on dashboards, which helps them make fast, informed decisions.
A low inventory turnover ratio often results from slow sales, overstocking, or poor demand forecasting. Companies may also face issues with outdated products or inefficient inventory management.


