Retail analytics transforms how companies in the retail sector grow their businesses. Data-driven insights lead to smarter decisions and higher profitability.
Retail analytics gives retail managers the power to make better decisions quickly. They no longer need to rely on guesswork. Instead, they use data to guide their actions. Managers can see which products sell best and which promotions attract more customers. They can track inventory in real time and adjust stock levels before problems arise.
Retailers who use analytics often report higher profits and better returns on investment. They can respond to trends quickly and avoid costly mistakes.
Retail analytics directly boosts profitability for many retailers. A study of over 1,500 e-commerce sites found that using analytics dashboards increased weekly revenues by 4% to 10%. This growth came from better customer management, more personalized offers, and smarter prospecting. Retailers also saw more product diversity, higher transaction numbers, and more repeat customers.
Retail analytics enables targeted marketing, better inventory management, and dynamic pricing. These improvements lead to higher sales, better customer retention, and increased profits.
Retail analytics is the science and practice of collecting, analyzing, and reporting data related to retail operations. Leading industry organizations describe it as a way to turn retail data into actionable insights. Retailers use analytics to understand past performance, diagnose problems, forecast demand, and make real-time decisions that improve sales, profits, and customer satisfaction. The process covers many areas, including in-store customer behavior, inventory management, merchandise effectiveness, and web analytics. Retailers rely on tools such as POS systems, CRM software, business intelligence platforms, and predictive analytics to gather and analyze this information.
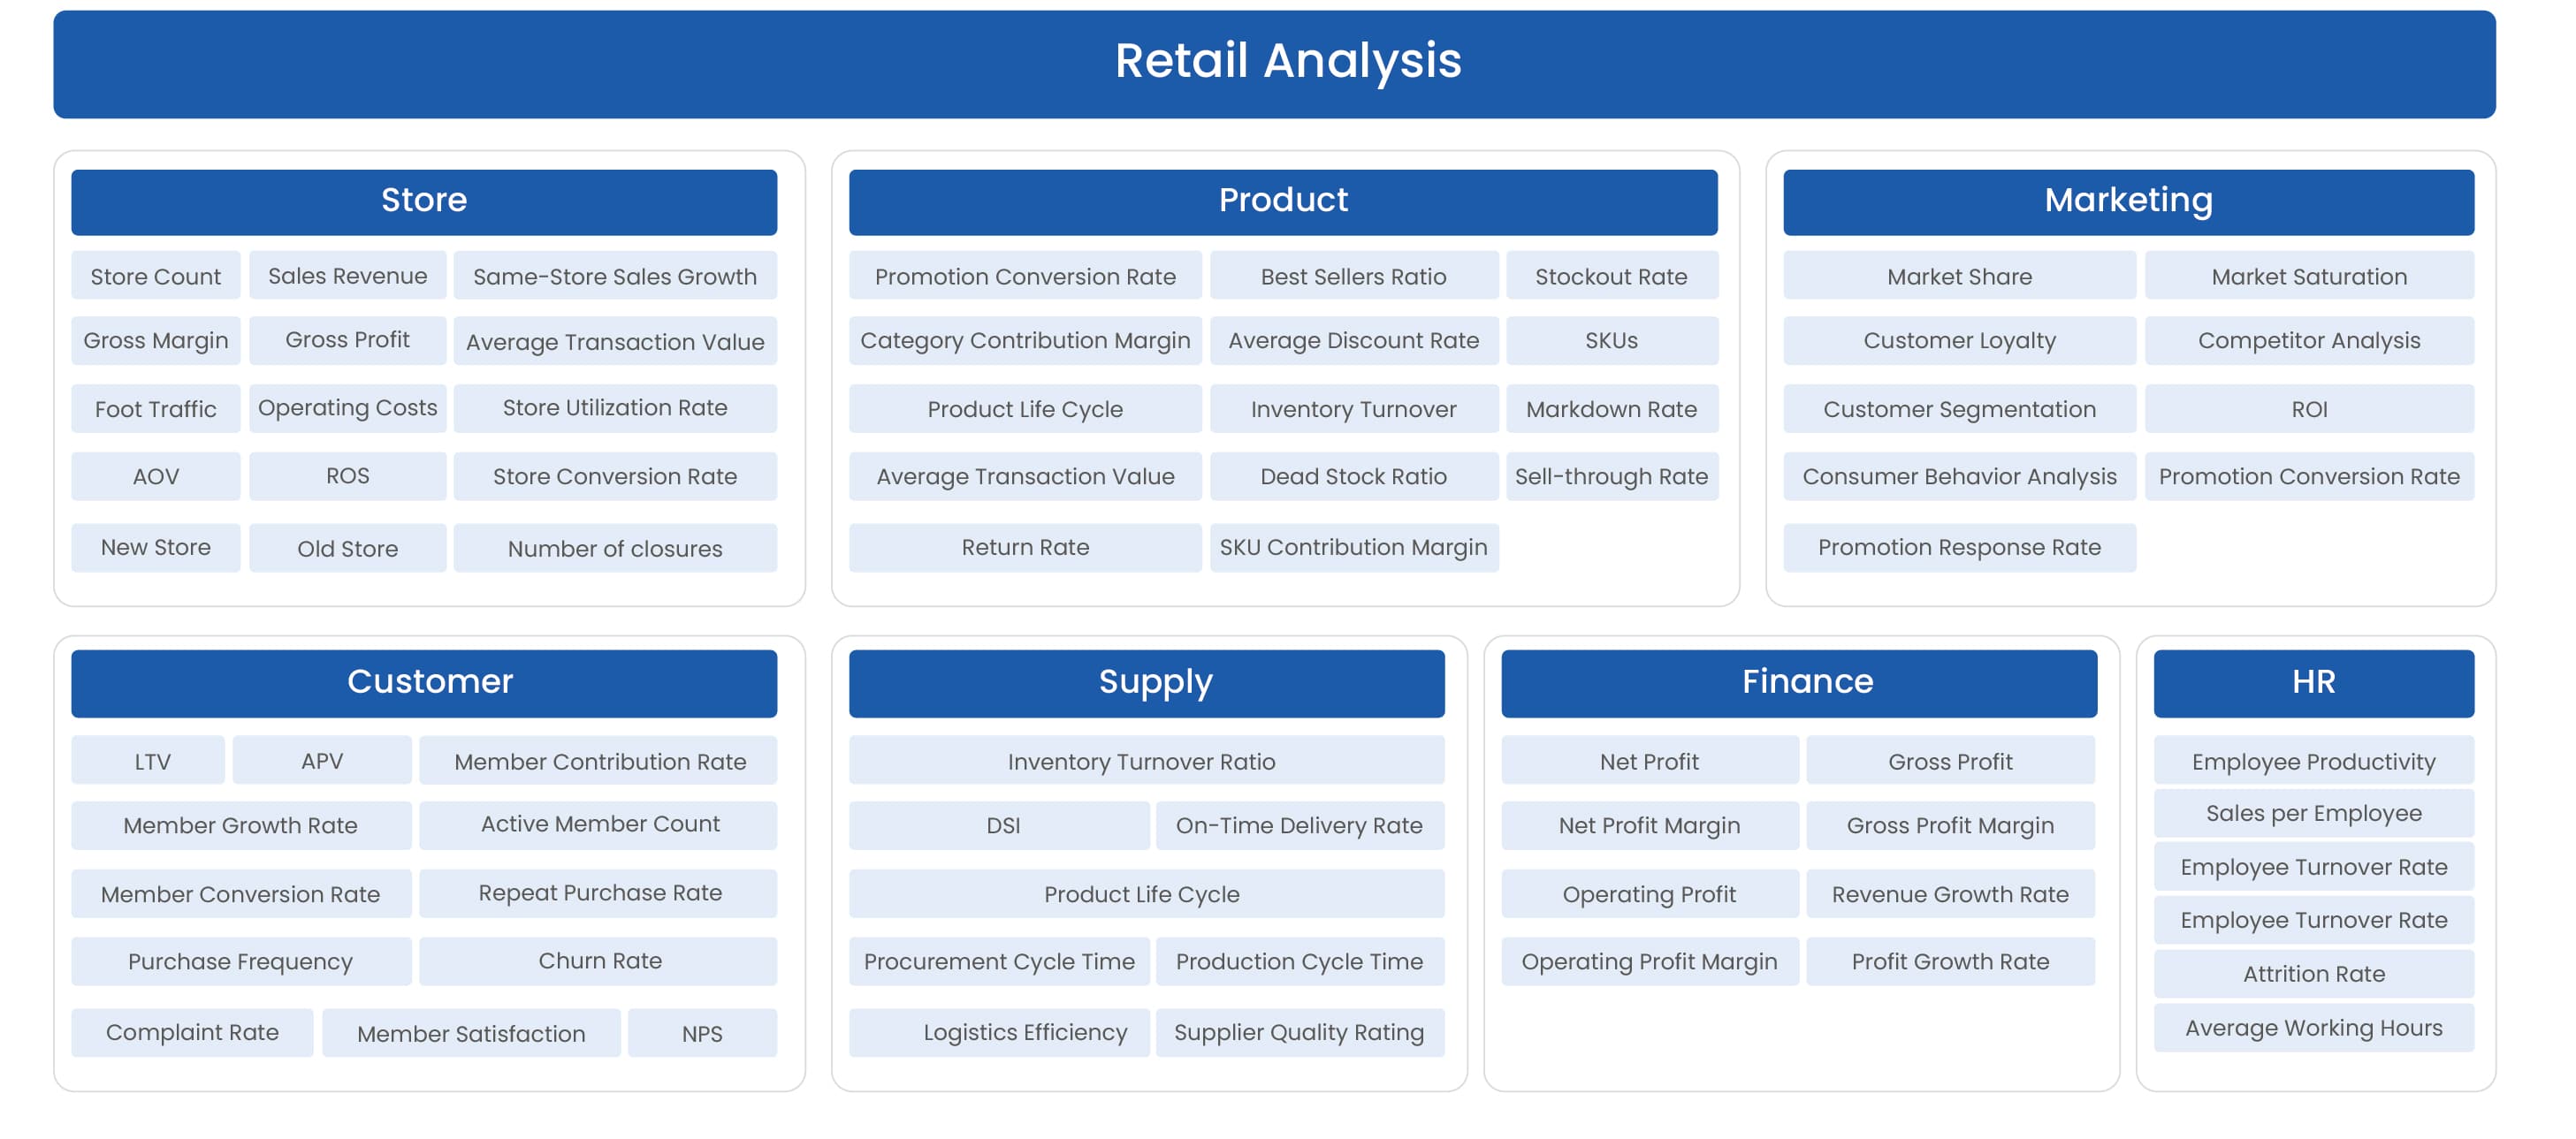
A comprehensive retail analytics system includes several essential parts:
These components work together to help retailers make smarter decisions, improve efficiency, and deliver better experiences for customers.
Retailers face constant challenges in keeping the right products in stock. They must avoid both empty shelves and excess inventory. Retail analytics helps solve these problems by making inventory management smarter and more efficient.
A 2022 McKinsey report found that predictive analytics cut inventory holding costs by up to 50%. Deloitte research showed a 35% reduction in stockouts, leading to happier customers and lower costs.
Retail analytics allows retailers to understand their customers better. By analyzing purchase history, browsing habits, and demographics, retailers can create personalized experiences. Predictive analytics helps them anticipate what customers want and when they want it. This leads to timely promotions and recommendations that increase campaign success.
For example, Amazon uses browsing and purchase data to recommend products, which increases sales and customer satisfaction.
Retail analytics drives measurable sales growth for retailers. The global market for these solutions reached $7.56 billion in 2023 and is expected to grow rapidly. Predictive analytics helps retailers forecast demand, segment customers, and personalize offers, all of which boost sales and competitiveness.
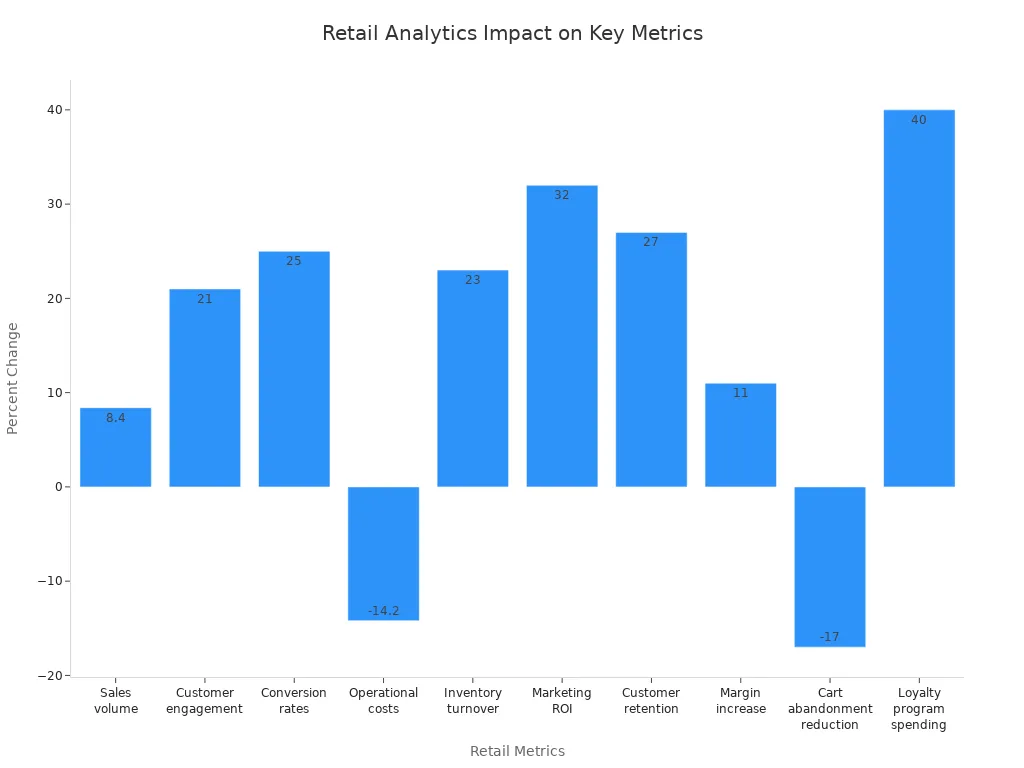
| Metric | Improvement/Increase | Impact Description |
|---|---|---|
| Sales volume | 8.4% increase | Direct revenue growth linked to BI implementation |
| Customer engagement | 21% higher | Enhanced connection with customers |
| Conversion rates | 25% improvement | Better purchase journeys |
| Operational costs | 14.2% reduction | Increased operational efficiency |
| Inventory turnover | 23% better | Improved capital utilization |
| Marketing ROI | 32% higher | More effective customer acquisition |
| Customer retention | 27% increase | Long-term value creation and repeat purchases |
| Margin increase (dynamic pricing) | 11% increase | Higher profitability without sales volume loss |
| Cart abandonment reduction | 17% decrease | Improved checkout experience |
| Loyalty program spending | 40% increase | Tailored offers boosting member spending |
Brands using data analytics have seen products achieve a 30% higher repeat purchase rate than average. Regional sales can rise by 20% for targeted products, and digital campaigns can boost brand awareness by 50%. These results show how analytics-driven insights support sales growth and long-term success.

Retail analytics includes four main types: descriptive, diagnostic, predictive, and prescriptive. Each type answers different business questions and supports unique decision-making needs. The table below summarizes their purposes and applications:
| Type of Retail Analytics | Purpose | Key Questions Answered | Application Differences |
|---|---|---|---|
| Descriptive Analytics | Explain past performance | How many, when, where, what | Summarizes historical data to understand what happened. |
| Diagnostic Analytics | Identify root causes of issues | Why did it happen? | Analyzes reasons behind problems using multiple data sources. |
| Predictive Analytics | Forecast future outcomes | What will happen next? | Uses historical and external data to predict trends and events. |
| Prescriptive Analytics | Recommend actions | What should be done? | Suggests optimal next steps using AI and big data. |
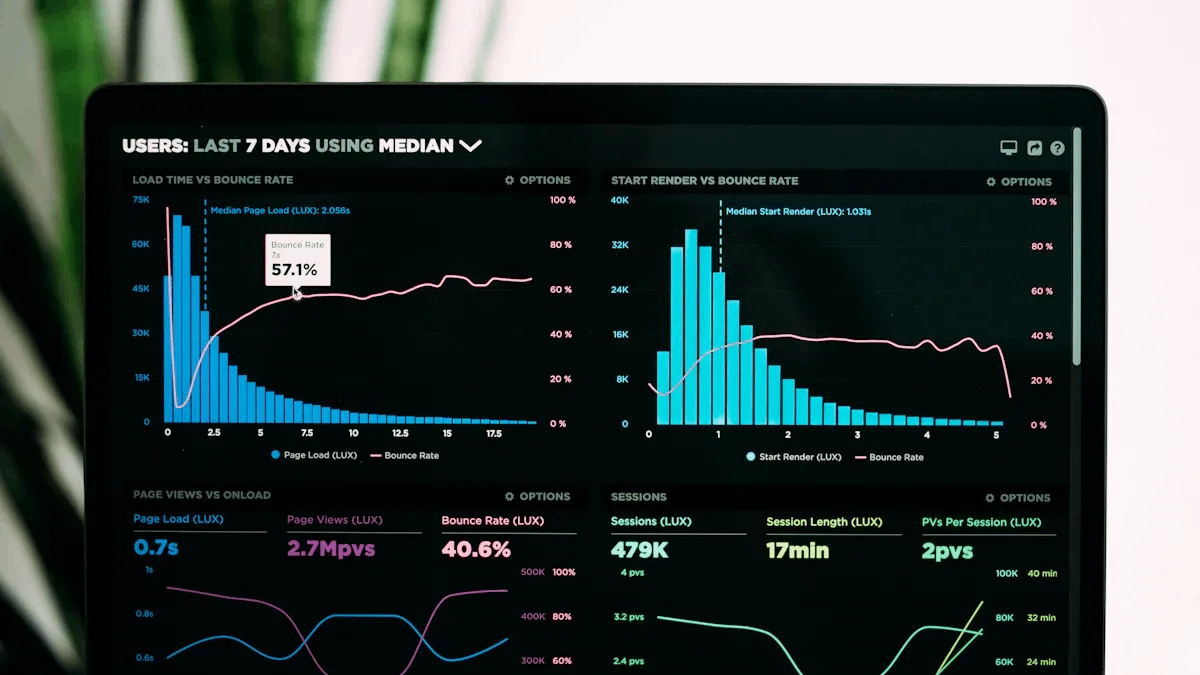
Descriptive analytics helps retailers understand what happened in the past. It analyzes sales data, customer behavior, and inventory records to find patterns and trends. Retailers use dashboards and visualization tools to see which products sold best, when sales peaked, and how customers behaved. For example, a retail chain used descriptive analytics to adjust product placement and inventory, which led to higher sales and better customer loyalty. This type of analysis supports smarter marketing campaigns and more efficient operations.
Tip: Descriptive analytics provides the foundation for all other types by turning raw data into clear summaries.
Diagnostic analytics explains why certain events occurred. When sales drop or a product underperforms, diagnostic analytics digs deeper to find the reasons. Retailers use this approach to:
By understanding the causes behind trends, retailers can make targeted improvements and avoid repeating mistakes.
Predictive analytics looks ahead to forecast what might happen next. It uses machine learning and statistical models to analyze past sales, customer demographics, and market trends. For instance, a clothing retailer used predictive analytics to align production with demand, optimize pricing, and personalize marketing. As a result, they saw a 20% increase in sales and a 25% reduction in inventory costs. Predictive analytics helps retailers plan for busy seasons, set dynamic prices, and create campaigns that match customer preferences.
Prescriptive analytics goes one step further by recommending the best actions to take. It combines AI, big data, and advanced algorithms to suggest how retailers can improve results. Benefits include:
Retailers who use prescriptive analytics can respond quickly to market changes, improve efficiency, and achieve better profit margins.
Modern retailers rely on a variety of tools to turn data into actionable insights. These tools help businesses collect, process, and visualize information for better decision-making. The right combination of solutions can improve efficiency, boost sales, and keep companies ahead of the competition.
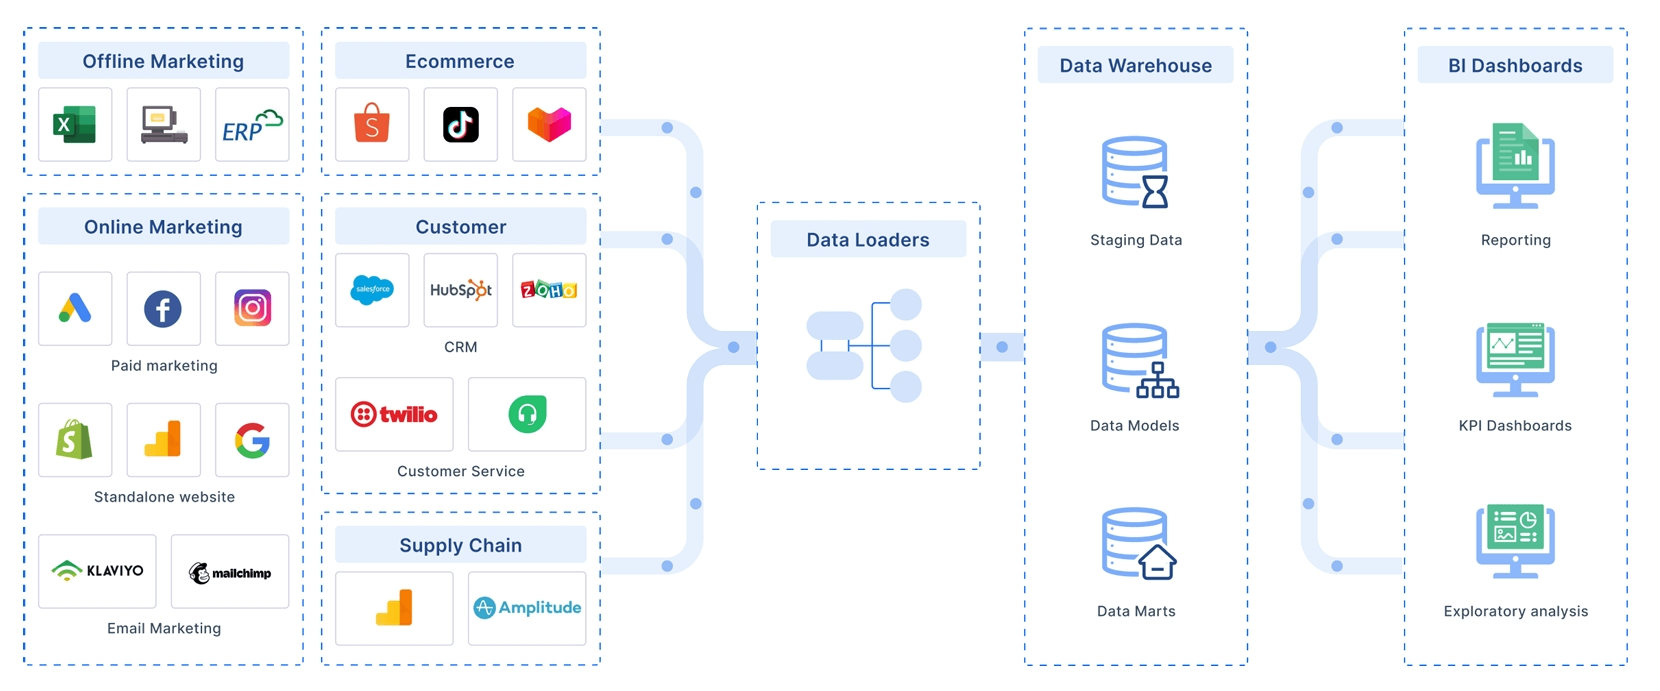
Data integration tools bring together information from many sources, such as point-of-sale systems, e-commerce platforms, and customer databases. Solutions like FanRuan’s FineDataLink stand out by offering:
These features help retailers create a single, reliable source of data. By automating data collection and transformation, FineDataLink saves time and reduces errors. Centralized data storage also improves data quality and supports deeper analysis.
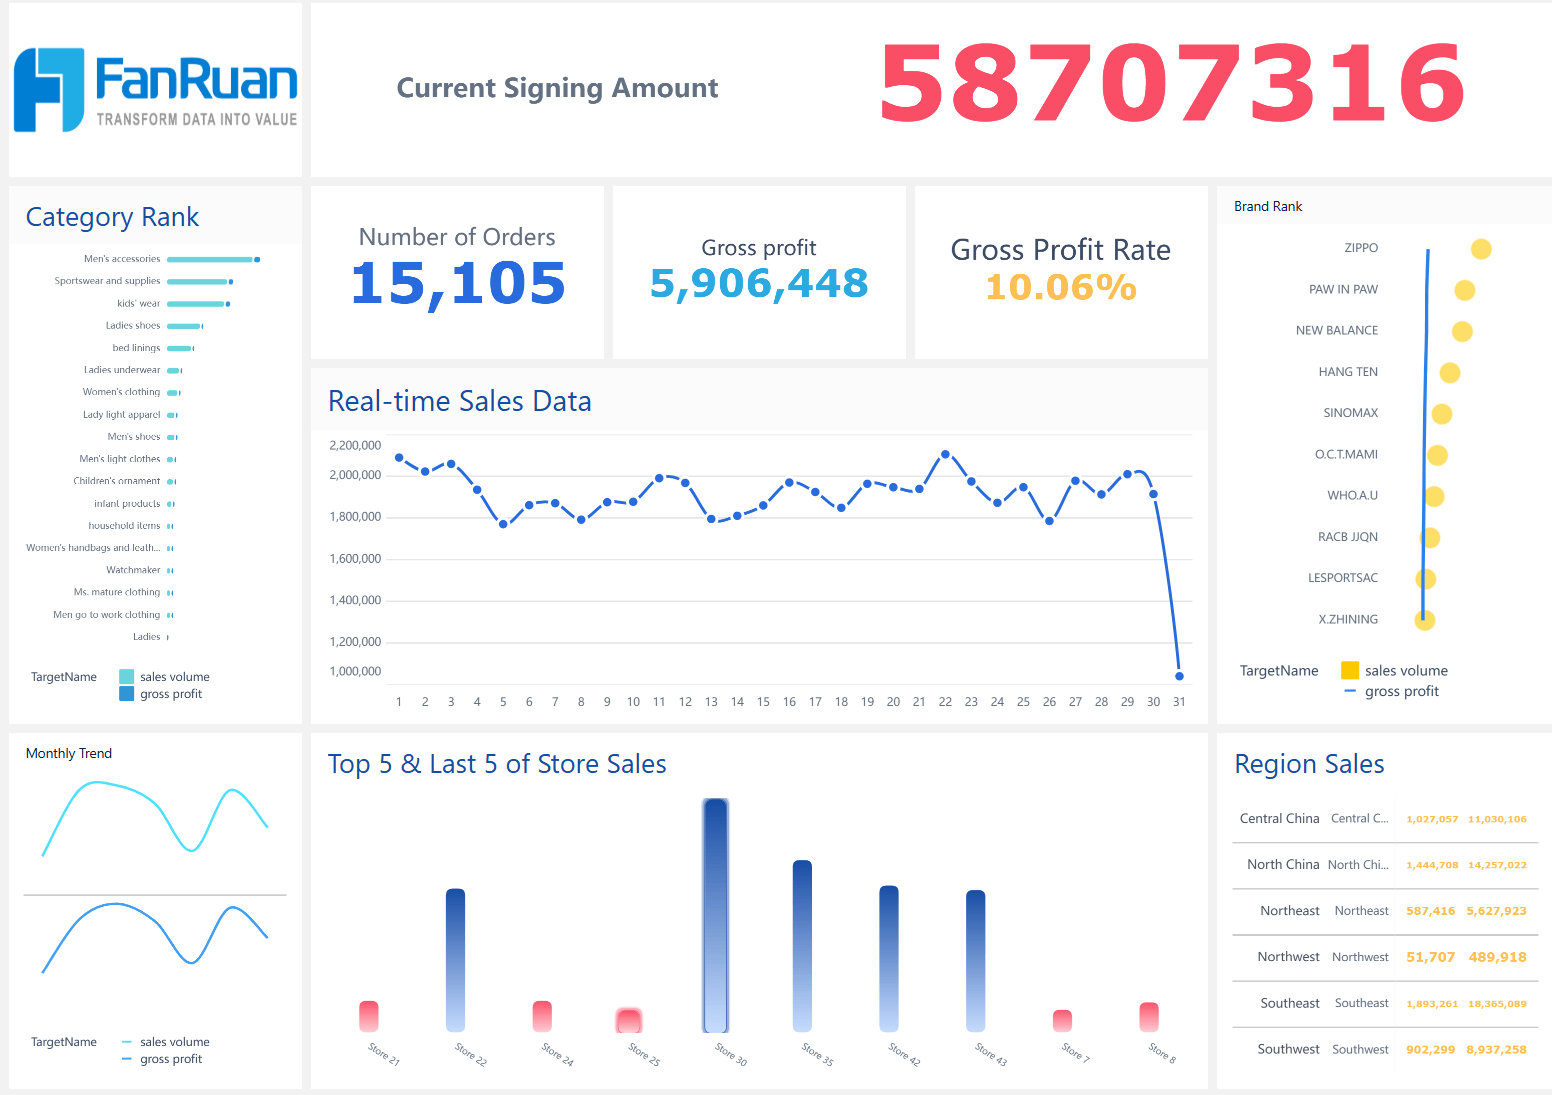
Visualization dashboards turn complex numbers into clear, interactive visuals. FineBI allows users to:
Dashboards make it easier for teams to spot trends, compare results, and share insights. They also support collaboration by allowing users to comment and work together on the same platform.
| Feature | Benefit |
|---|---|
| Data Consolidation | Combines data from multiple systems into a single view. |
| Visual Representation | Uses charts and graphs to highlight patterns and trends. |
| Interactive Exploration | Allows filtering and drilling into metrics for deeper insights. |
| Real-Time Monitoring | Provides up-to-date insights for quick responses. |
| KPI Tracking | Focuses on key metrics to monitor progress and performance. |
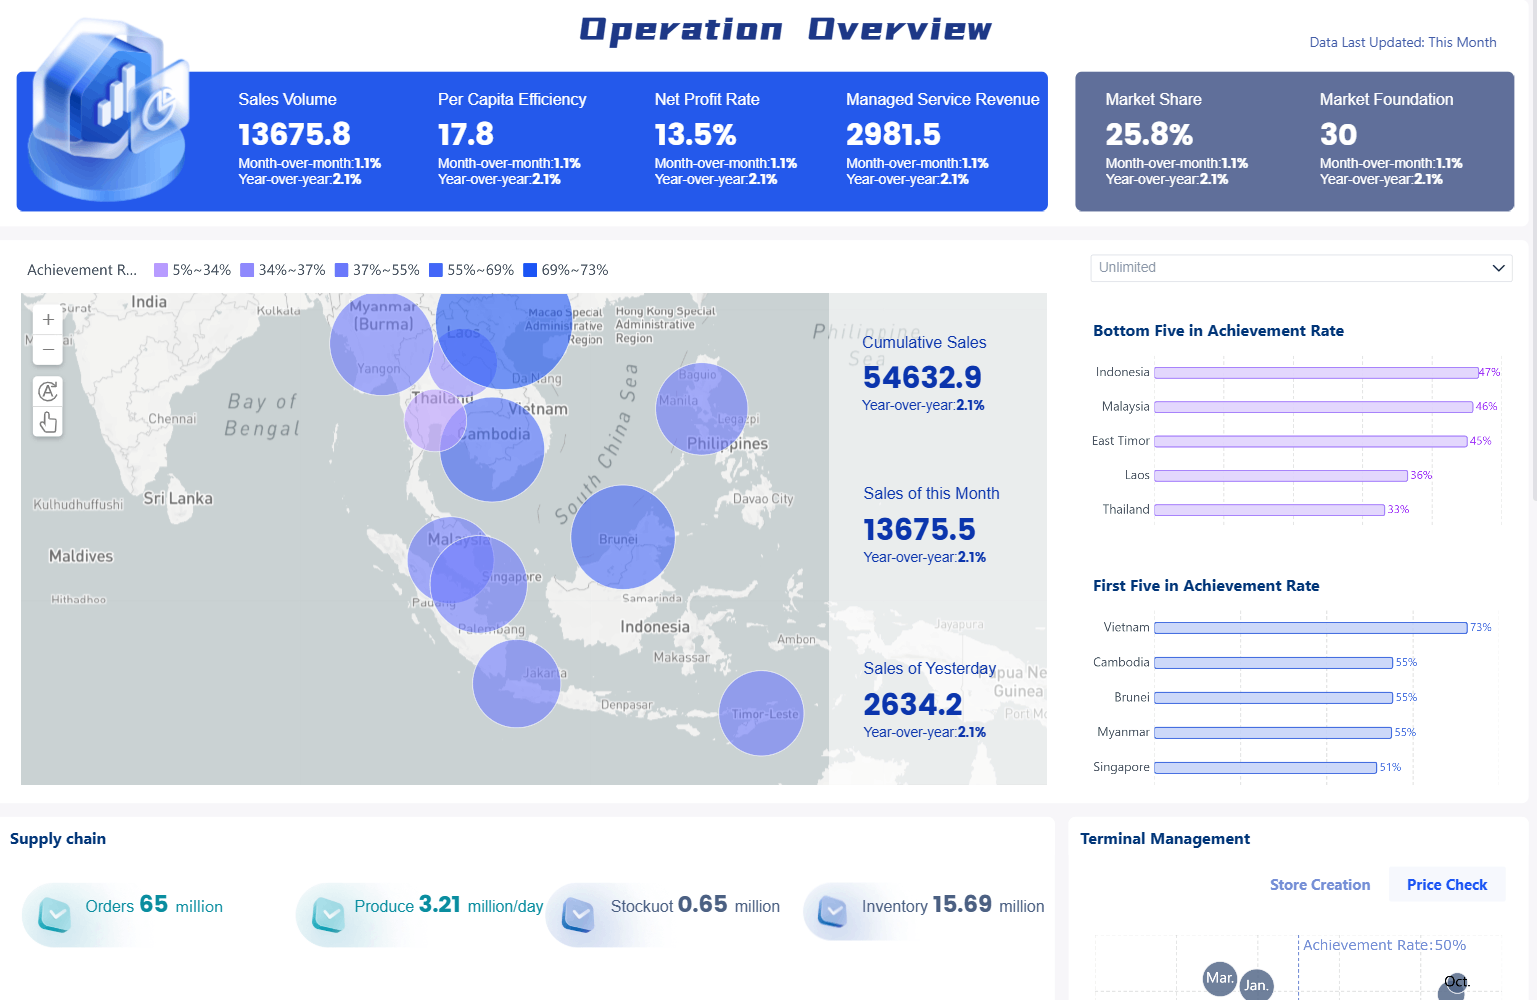
Real-time analysis tools help retailers respond quickly to market changes. FineBI supports live data updates, enabling teams to:
Retailers using real-time analytics can make faster, smarter decisions. They improve customer satisfaction and gain a competitive edge by acting on the latest information.
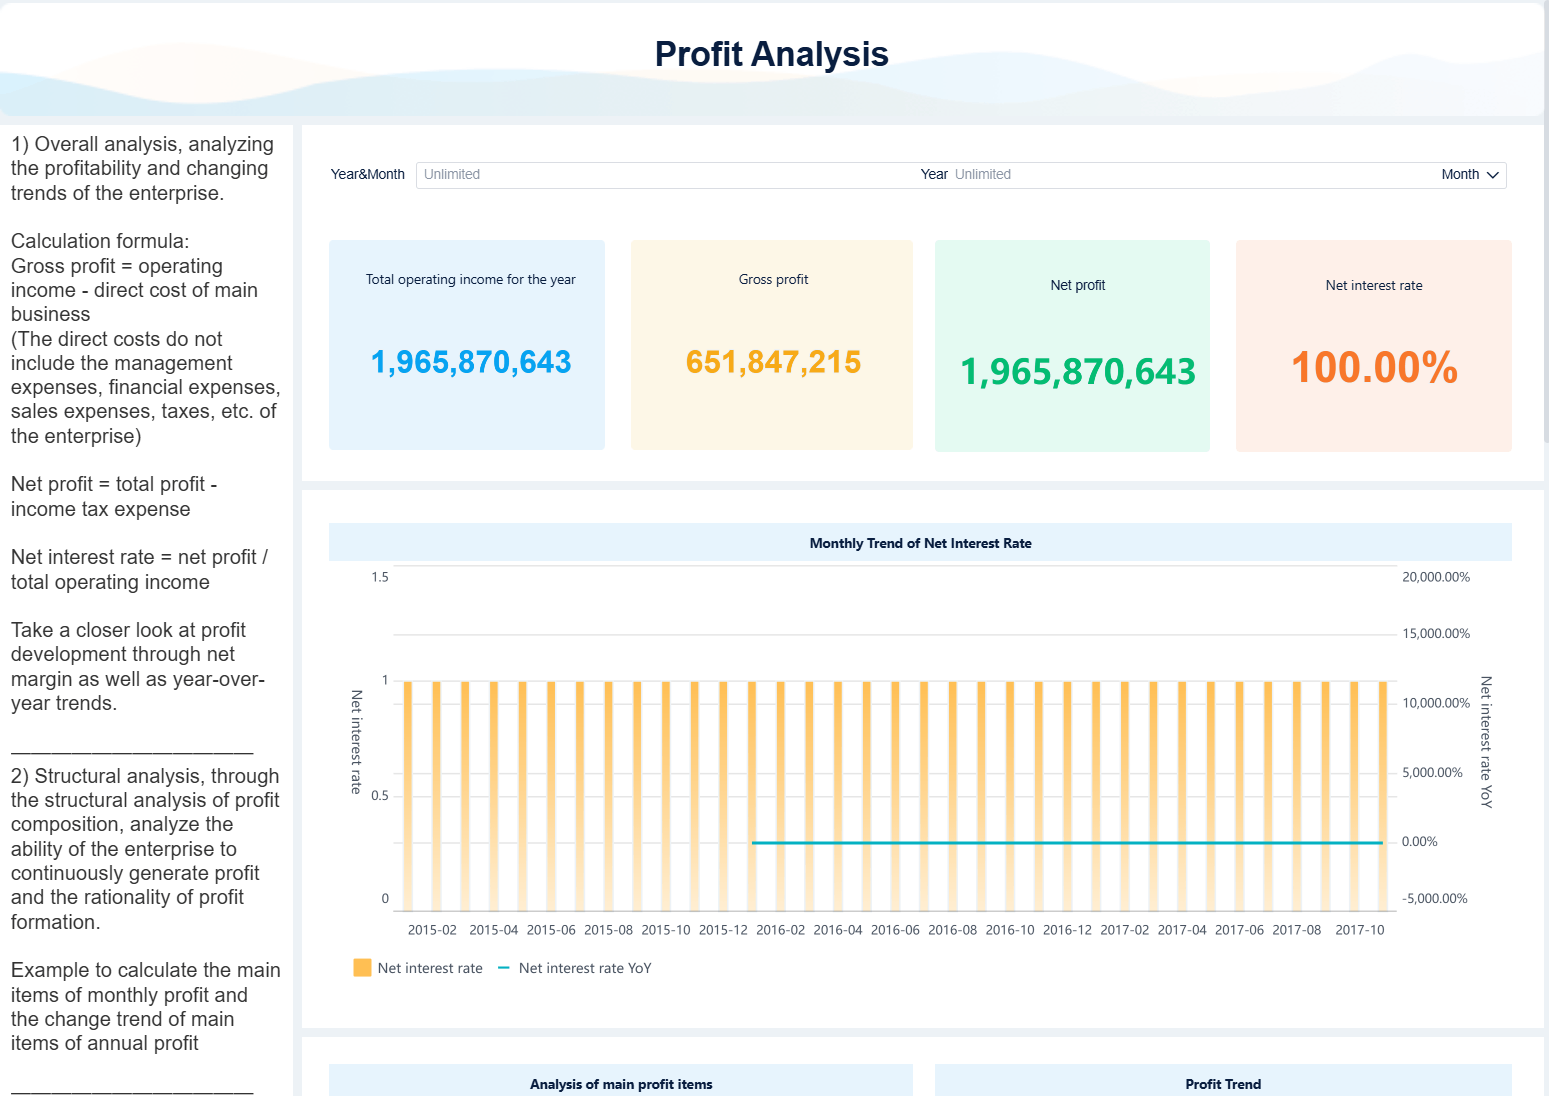
Below is a Sales Director Real-time Dashboard:
Note: Other popular tools include Shopify Analytics, Tableau, Microsoft Power BI, and Looker. Each offers unique features, but FineBI stands out for its self-service design, strong data integration, and real-time capabilities tailored for retail needs.
Retailers who embrace advanced analytics platforms gain real-time insights, improve decision-making, and reduce risks. Teams that foster continuous learning—through training, mentorship, and leadership support—adapt quickly to new technologies. Companies like Sephora show that personalized loyalty programs and AI-powered CRM systems increase customer retention and lifetime value. Ongoing education, industry collaboration, and scalable tools like FineBI help retailers stay competitive. Taking the first step toward data-driven growth positions businesses for long-term success.

What is Retail Industry Data Analysis and Why It Matters
Top Tools for Retail Data Analysis in 2025

The Author
Lewis
Senior Data Analyst at FanRuan
Related Articles
9 Best Supply Chain Tools for Smarter Management in 2026
Find the best supply chain tools for 2025 to boost efficiency, gain real-time insights, and achieve smarter management for your business.
Lewis
Dec 18, 2025
Top 10 Supply Chain Tracking Software for 2026
Compare the top supply chain tracking software for 2026 to boost visibility, automate workflows, and leverage AI analytics for smarter decisions.
Lewis
Dec 18, 2025

Top 10 Supply Chain Management Software for Small Businesses
See the top 10 supply chain management software comparison for small businesses in 2026. Compare features, pricing, and scalability to find your best fit.
Lewis
Dec 18, 2025


