Sales revenue means the total income your business earns from sellin-g goods or services. This figure appears at the top of your income statement and shows the core strength of your sales activities. You need to focus on sales revenue because it reflects your ability to generate income from your main business operations. By tracking sales revenue, you can spot trends and identify problems in your sales process. Analyzing revenue data helps you make informed decisions, set realistic targets, and understand your market position. Regular review of your sales revenue leads to stronger business growth and better resource management.
Sales Revenue Basics
What Is Sales Revenue
You can think of sales revenue as the money your business earns from selling products or providing services. This figure sits at the very top of your income statement, making it a top-line metric that shows how well your core operations perform. According to accounting standards like GAAP and IFRS, you recognize revenue when you deliver goods or services and expect payment in return. This means you only count sales revenue once you fulfill your promise to the customer.
Sales revenue includes several components, and these can vary by industry. For example, in retail, you get revenue from selling finished products, memberships, and warranties. In the lodging industry, you earn revenue from room rates, event bookings, and in-room services. The entertainment industry collects revenue from ticket sales, merchandise, and participation fees. In education, revenue comes from tuition, campus housing, and meal plans. You might also see other types of revenue, such as interest, rent, or dividends, but these do not count as sales revenue. Instead, they fall under non-operating or other revenue.
Note: Sales revenue is different from gross revenue. Gross revenue refers to the total amount before subtracting returns, discounts, or allowances. Sales revenue usually appears as net revenue after these adjustments.
You record sales revenue on your income statement as the first line item. This figure anchors your financial reporting and serves as the starting point for calculating gross revenue, gross profit, and net income. You recognize sales revenue when you deliver the product or service, not necessarily when you receive payment. For example, if you sell 50 units but deliver only 30, you only recognize revenue for the 30 units delivered.
Here is a table to help you see the difference between sales revenue and other types of revenue:
| Revenue Type | Description | Relation to Sales Revenue |
|---|---|---|
| Sales Revenue | Income from selling products or services | Main source of operating revenue |
| Service Revenue | Income from providing services | Operating revenue, but separate from sales |
| Rental Revenue | Income from leasing property or equipment | Operating revenue, not sales revenue |
| Commission Revenue | Income from intermediary services | Operating revenue, separate from direct sales |
| Subscription Revenue | Income from recurring payments for ongoing services or products | Operating revenue, distinct from sales revenue |
| Interest Revenue | Income from interest-bearing accounts or investments | Non-operating revenue |
| Dividend Revenue | Income from owning shares in other companies | Non-operating revenue |
You should also know that sales revenue metrics help you track your business performance. These metrics include total sales, average deal size, and sales growth rate. By monitoring these numbers, you can spot trends and make better decisions.
Why Sales Revenue Matters
Sales revenue matters because it shows how well your business attracts and serves customers. High sales revenue means your products or services meet market demand. Investors and stakeholders look at sales revenue to judge your company’s health and growth potential. They use this figure, along with other metrics, to decide if your business is stable or facing challenges.
You use sales revenue as the foundation for many important calculations. For example, you subtract the cost of goods sold from sales revenue to find gross profit. You then deduct operating expenses to get operating income. This process helps you see how much money your business keeps after covering costs.
Tip: Accurate measurement of sales revenue is critical. You need to record all sales, adjust for discounts and returns, and recognize revenue only when you deliver the product or service. This ensures your financial statements reflect the true state of your business.
Many businesses face challenges when measuring sales revenue. You might struggle with inconsistent data sources or unclear definitions across teams. To solve this, you should standardize your sales revenue KPIs and use a shared platform for tracking. Regularly review and update your sales revenue metrics to keep them aligned with your business goals.
Sales revenue also plays a key role in long-term business sustainability. Studies show that companies with higher sales revenue often enjoy stronger cash flows and greater value over time. This allows you to reinvest in your business, improve operations, and create more value for your customers.
Here are some reasons why sales revenue is so important:
- It reflects your ability to generate income from core business activities.
- It serves as the starting point for calculating gross revenue, gross profit, and net income.
- It helps you set realistic sales targets and measure progress.
- It provides investors and stakeholders with a clear view of your business performance.
- It supports long-term growth and sustainability by enabling reinvestment and value creation.
You should always pay close attention to your sales revenue KPIs. These indicators help you understand your market position and guide your business strategy. By tracking and analyzing sales revenue, you can make smarter decisions and drive your business forward.
Calculating Sales Revenue
Sales Revenue Formula
You need to know the right formula to calculate sales revenue. This formula helps you measure how much money your business brings in from selling products or services. You can use different formulas depending on your business type.
- For product-based companies:
Sales Revenue = Number of Units Sold × Average Price per Unit - For service-based companies:
Sales Revenue = Number of Customers × Average Price of Services
Sales revenue shows the total income from your main business activities before you subtract discounts, returns, or allowances. You should not include non-operating income, such as interest or dividends, in this calculation. This keeps your sales revenue metrics clear and focused on your core operations.
Changes in price or volume can affect your sales revenue. If you raise your prices, you may see higher revenue, but you could sell fewer units. If you sell more units at the same price, your revenue increases. The mix of products you sell also matters. Selling more high-margin items can boost your sales revenue even if your total volume stays the same.
You can break down the effects like this:
- Price Effect: Previous Volume × (Current Price - Previous Price)
- Volume Effect: Previous Price × (Current Volume - Previous Volume)
- Mix Effect: Changes in the types of products sold can shift your total revenue.
Understanding these effects helps you analyze why your sales revenue changes over time.
Example Calculation
Let’s look at a step-by-step example for a retail business. This will show you how to calculate sales revenue for several products.
- Choose the time period you want to measure, such as a month.
- Find out how many units you sold for each product during that time.
- Write down the original sale price for each product.
- Multiply the number of units sold by the sale price for each product.
- Add up the totals for all products to get your overall sales revenue.
Here is a sample calculation:
| Product Name | Units Sold | Price per Unit | Sales Revenue |
|---|---|---|---|
| Energy Bites Assorted Box | 127 | $33 | $4,191 |
| Daily Nourish Superfood Mix | 346 | $56 | $19,376 |
| Ultimate Variety Pack | 72 | $115 | $8,280 |
| Nomzicles - 12 Pack | 298 | $40 | $11,920 |
Total sales revenue for the period = $4,191 + $19,376 + $8,280 + $11,920 = $43,767
You can use this method for any business. Just adjust the formula to fit your products or services. Always make sure you use accurate numbers for units sold and prices. This keeps your sales revenue kpis reliable.
Tip: If you want to track your sales revenue more accurately, use a business intelligence tool like FineBI from FanRuan. FineBI lets you connect to your sales data, build custom dashboards, and visualize your sales revenue in real time. You can filter, sort, and analyze your sales by product, region, or time period. FineBI also supports advanced models like inventory turnover analysis and Pareto analysis. These features help you spot trends, identify your best-selling products, and improve your sales revenue metrics.

FineBI’s self-service interface makes it easy for you to explore your sales data without needing to write code. You can set up alerts for sudden changes in sales revenue, compare performance across teams, and share insights with your colleagues. This approach reduces manual errors and gives you a clear view of your business performance.

Also, You can join our upcoming FanRuan webinar series on Data Storytelling, where we’ll go beyond metrics and dashboards to explore how to:
Conduct meaningful cost analysis with context
Interpret gross profit and cost metrics correctly
Visualize and present your findings using real-world BI tools
Use data storytelling to justify strategic decisions
Prepare your data for AI-driven insights
Whether you're an analyst looking to improve your cost reporting or a business leader driving budget decisions, this session will give you the tools and mindset to turn cost data into a clear, actionable narrative.
And of course, you'll see how FineBI helps bring your cost analysis to life through smart dashboards, dynamic charts, and story-ready visuals.
By using the right formula and tools, you can calculate your sales revenue with confidence. This helps you make better decisions and grow your business.
Sales Revenue vs. Other Metrics
Revenue vs. Gross Profit
You might see sales revenue and gross profit listed close together on your income statement, but they tell you different stories. Sales revenue shows the total money you earn from selling goods or services before you subtract any costs. This number sits at the top of your income statement and reflects the scale of your business activity. Gross profit, on the other hand, comes after you subtract the cost of goods sold from your total revenue. This figure tells you how much money remains after covering direct production costs, but before you pay for other expenses like rent or salaries.
Understanding the difference between sales revenue and gross profit helps you make better business decisions. High revenue does not always mean high profit. You need to know how much of your revenue turns into profit after costs. For example, you might have strong sales, but if your costs are too high, your gross profit will be low. This insight helps you price your products, manage expenses, and set realistic growth targets. By tracking both metrics, you can see if your business is efficient and profitable, not just busy.
Revenue vs. Net Revenue
You may hear the terms sales revenue, gross sales revenue, and net revenue used in accounting. Sales revenue, sometimes called gross revenue, is the total amount you receive from sales before any deductions. Net revenue, or net sales revenue, is what remains after you subtract discounts, returns, and allowances from your gross revenue. For example, if you sell $50,000 worth of products but have $5,000 in returns and allowances, your net revenue is $45,000. This number gives you a clearer picture of the money your business actually keeps from sales.
The difference between gross revenue and net revenue often depends on your role in the sales process. If you control the goods and set prices, you report gross revenue. If you act as an agent and only arrange sales, you report net revenue. Net revenue is important because it reflects the actual income you expect to retain after all deductions. This helps you understand your true earning power and financial health.
Tip: Always track both gross and net revenue. Net revenue shows the real impact of returns and discounts on your business.
Revenue vs. Cash Flow
You might think that strong sales revenue means your business has plenty of cash, but this is not always true. Sales revenue measures the total income from sales, but it does not show when you actually receive the money. Cash flow tracks the movement of cash in and out of your business. You can have high revenue but still face cash flow problems if customers delay payments or if you spend more than you earn.
| Aspect | Sales Revenue | Cash Flow |
|---|---|---|
| Definition | Total income from sales before expenses; shows sales performance. | Actual cash moving in and out; includes all receipts and payments. |
| Impact on Liquidity | Does not show cash availability or timing. | Directly shows if you have enough cash to run your business. |
| Financial Health Insight | Reveals sales strength, but not cash position. | Shows if you can pay bills and invest in growth. |
Many business owners believe that good revenue and low expenses guarantee strong cash flow, but this is a misconception. You need to manage both revenue and cash flow to keep your business healthy. Sometimes, rapid sales growth can even strain your cash flow if you need to buy more inventory or hire staff before you get paid. Always monitor your cash flow alongside your revenue to avoid surprises.
Importance of Sales Revenue
Profitability and Growth
You rely on sales revenue as the main engine for your business’s profitability and growth. When you focus on revenue generation, you create a strong foundation for your company’s future. Marketing supports this by building brand value and pricing power, which helps you keep sales volume steady even if you raise prices. Studies show that companies using advanced analytics, like Price-Cost-Volume-Mix (PCVM) analysis, can break down revenue changes into price, cost, volume, and mix. This helps you see what drives your revenue and profit. If you use these insights, you can adjust your pricing, control costs, and choose the right product mix. Many businesses miss out on growth because they do not track these drivers closely. By understanding how sales revenue connects to profitability, you can make smarter decisions and support long-term growth.
- Revenue generation is a key driver of business success.
- PCVM analysis helps you understand price, cost, volume, and mix impacts.
- Marketing and analytics together boost your ability to grow and stay profitable.
Financial Planning
Sales revenue plays a central role in your financial planning. You use revenue forecasts to predict cash flow, set budgets, and plan for the future. For small businesses, tracking sales revenue helps you spot seasonal trends and plan marketing or expansion. You can use break-even analysis to compare your fixed expenses with your revenue, helping you set prices and measure profitability. Regularly monitoring your sales revenue allows you to adjust your spending and confirm progress toward your goals. If your revenue forecasts are off, you might face stock-outs, excess inventory, or even financial losses. Using accurate data and analytics tools helps you avoid these problems and keeps your business on track.
Tip: Monitor your monthly revenue growth to boost team morale and confirm you are moving toward your financial targets.
Business Valuation
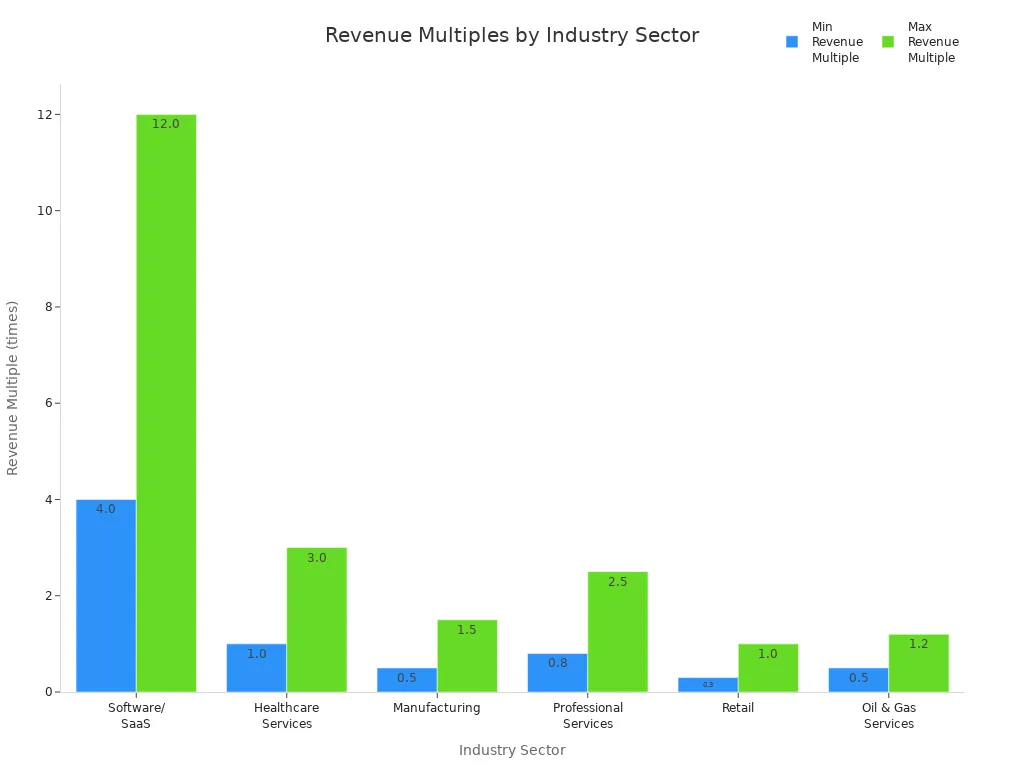
When you want to know how much your business is worth, sales revenue becomes a key metric. Valuation experts look at your recent revenue data and compare it to similar companies. They use multiples like Price-to-Sales (P/S) and Enterprise Value-to-Sales (EV/Sales) to estimate your company’s value. For example, if your business is in the software industry, the revenue multiple might range from 4.0 to 12.0 times your annual revenue. This method works well for high-growth companies or those with limited profits. Experts also consider factors like growth rate, profitability, and brand strength. While sales revenue is important, they often combine it with other methods for a complete picture.
| Industry Sector | Typical Revenue Multiple Range |
|---|---|
| Software/SaaS | 4.0 to 12.0 times |
| Healthcare Services | 1.0 to 3.0 times |
| Manufacturing | 0.5 to 1.5 times |
| Professional Services | 0.8 to 2.5 times |
| Retail | 0.3 to 1.0 times |
| Oil & Gas Services | 0.5 to 1.2 times |
Boosting Sales Revenue
Marketing and Pricing
You can increase sales revenue by improving your marketing and pricing strategies. Start by using data-driven pricing. Smart analytics and AI tools help you set flexible prices that match market demand. This approach can raise profit margins and boost revenue. For example, a Harvard Business Review study found that a 1% price increase can lead to an 11.1% profit increase. Companies that use strategic pricing often see 2% to 8% annual revenue growth.
| Strategy | Impact on Revenue |
|---|---|
| Dynamic Pricing | Higher profit margins |
| Discount Optimization | 3% return on price |
| Product Bundling & Upselling | Increased average transaction |
| Personalized Promotions | More frequent, larger purchases |
You should also focus on employee motivation and customer engagement. Happy employees deliver better service, which leads to loyal customers and higher sales. Use surveys, online communities, and feedback to connect with your audience. Personalized incentives, special events, and bundling products can move customers through your sales funnel and encourage bigger purchases.
Customer Retention
Retaining customers is one of the most effective ways to grow revenue. Loyal customers spend more over time and cost less to keep than new ones. The Pareto Principle shows that a small group of loyal customers often brings in most of your revenue. If you improve customer retention by just 5%, you can increase profits by 25% to 95%. Satisfied customers also share positive experiences, bringing new buyers into your sales funnel. Focus on high-value customers, offer personalized experiences, and use metrics like retention rate and churn rate to track your progress.
Tip: Cross-selling and up-selling to existing customers can boost sales by up to 20% and profits by 30%.
Using FineBI for Revenue Insights
FineBI gives you real-time visibility into your sales revenue. You can connect multiple data sources and create dashboards that show sales trends across your sales funnel. FineBI’s SQL-free interface lets you analyze revenue data without technical skills. You can filter, sort, and visualize sales revenue by product, region, or time period. The platform supports over 50 chart types, making it easy to spot trends and share insights with your team. FineBI’s responsive dashboards work on any device, so you can monitor revenue and sales performance wherever you are. This helps you make quick decisions and keep your sales funnel healthy.

You now understand how to measure, analyze, and manage revenue for your organization. Accurate revenue tracking gives you a clear view of your financial health. When you monitor revenue trends, you can spot problems early and make better decisions. FineBI from FanRuan helps you visualize revenue data and find new growth opportunities. Start using real-time revenue insights to drive your business forward today.
Click the banner below to try FineBI for free and empower your enterprise to transform data into productivity!

Continue Reading About Sales Revenue
Unlocking Business Success with the AARRR Metrics Framework
What is Pareto Chart and How Does it Work
Essential Tips for Successful Customer Behavior Analysis
Making Metric Conversion Chart Easy for Everyday Life
What is Cost Analysis and Why Does It Matter in Business


FAQ

The Author
Lewis
Senior Data Analyst at FanRuan
Related Articles

What Recruiters Look for in a Data Analysis Portfolio: 10 Criteria to Score Yours Fast
A $1 is not judged like a school assignment. It is judged like a hiring shortcut. Recruiters, hiring managers, and analytics leads use it to answer one question fast: Can this person solve business problems with data in
Lewis Chou
May 29, 2026

What Is Data Analytics Consulting? Beginner’s Guide to Services, Deliverables, and Business Value
$1 helps organizations turn raw data into decisions they can trust. For many business leaders, the challenge is not a lack of data. It is a lack of clarity. Reports conflict, teams track different KPIs, dashboards are un
Lewis Chou
Jun 03, 2026

Data Analyst Job Description [+2026 Guide]: Compare Responsibilities, Skills, and Salary by Industry
A strong $1 does more than list tasks. It defines how a company turns raw data into business decisions, which teams the analyst supports, and what measurable outcomes the role is expected to influence. For employers, tha
Lewis Chou
Jun 02, 2026