Sales report plays a vital role in shaping your business decisions in Malaysia. They uncover trends and patterns that guide you toward growth opportunities in Malaysia. Actionable insights from these reports highlight areas needing improvement, such as low conversion rates or underperforming sales territories. This enables you to make informed adjustments and empower your sales team in Malaysia through targeted coaching. Tools like FineReport simplify the process by integrating data from multiple sources, helping you create dynamic reports that drive strategic growth in Malaysia.
Understanding Sales Report and Its Importance
What Is a Sales Report?
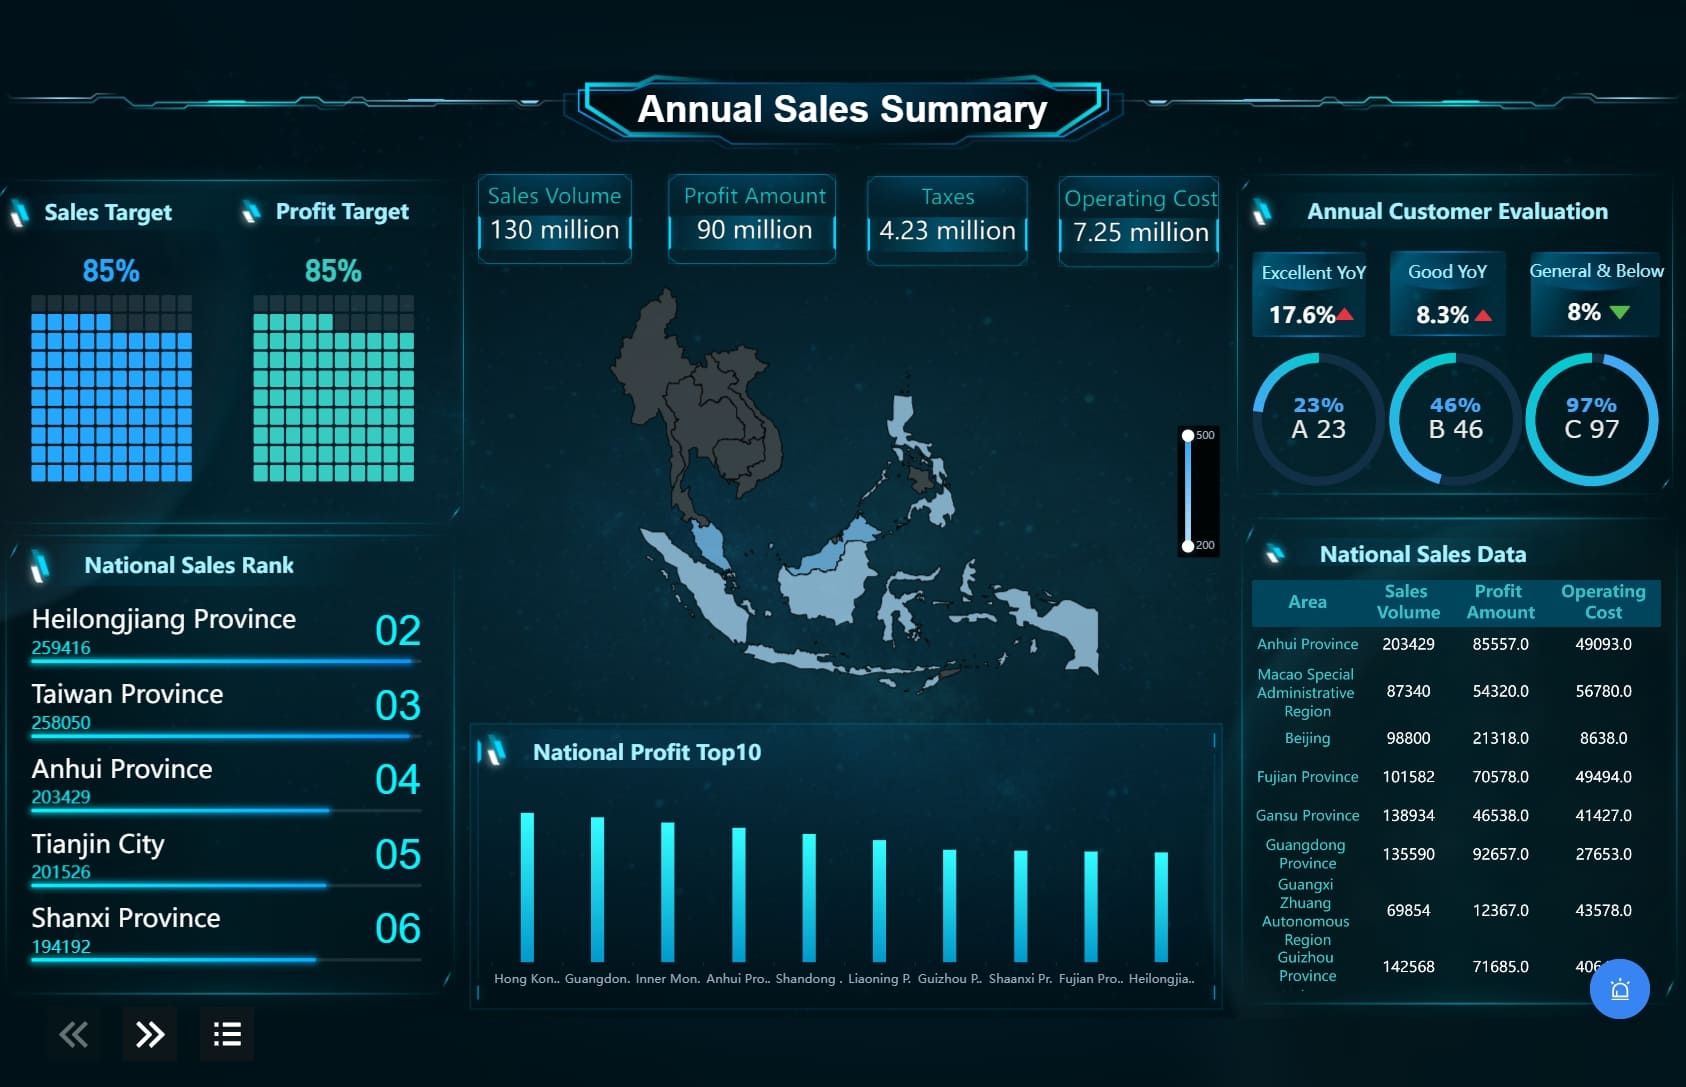
A sales report is a document that summarizes your company’s sales activities over a specific period. It provides insights into sales volume, customer acquisition costs, and other metrics that help you assess performance. These reports track trends, evaluate individual and team contributions, and support strategic planning.
Sales report comes in various formats tailored to different needs:
- Sales pipeline report: Evaluates the health of your sales pipeline.
- Conversion report: Offers insights into lead conversion rates.
- Average deal size report: Highlights the average revenue per deal.
You can also structure reports based on timeframes:
- Daily sales report: Analyzes daily activities.
- Weekly sales report: Tracks team performance in Malaysia.
- Monthly sales report: Provides a broader view of metrics.
- Annual sales report: Measures long-term growth.
These reports are essential tools for understanding your sales data and making informed decisions.
Why Sales Report Is Essential for Business Success in Malaysia
Sales reports are more than just numbers; they are your roadmap to success. They help you identify trends, optimize strategies, and improve team performance in Malaysia. For example, Polaris company reduced task time by 85% by analyzing sales metrics, leading to better customer engagement. Similarly, KFA retail chain used AI-powered analytics to organize trader workflows, enhancing team management in Malaysia.
Key metrics like lead conversion rates and predictive analytics offer valuable insights. The lead opportunity ratio, for instance, helps you determine the number of leads required to meet revenue goals. These metrics ensure your sales strategies align with business objectives in Malaysia, reducing risks and maximizing opportunities.
Key Benefits of Regular Sales Reporting
Regular sales reporting offers measurable benefits that drive growth:
| Evidence Description | Statistic |
|---|---|
| Higher win rates with dynamic coaching programs | 28% higher |
| Success rate for sales reps submitting three or more videos | 26% higher |
| Immediate improvement after practicing key skills | 72% saw improvement |
| Average lift across sales-critical skills | 22% lift |
| Productivity improvement through analytics | 10-20% improvement |
| Outperformers commit to more coaching | 79% more coaching |
| Personalized training boosts revenue growth | 1.3x more likely to outperform peers |
By leveraging sales data, you can enhance productivity, improve team skills, and achieve better revenue growth. Regular reporting fosters continuous improvement, ensuring your business v stays competitive.
Key Metrics to Include in a Sales Report
Revenue Metrics for Sales Analysis
Revenue metrics form the backbone of any sales performance report. These metrics help you evaluate your business's financial health and identify growth opportunities. Key revenue metrics include:
| Metric | Description | Importance in Sales Analysis |
|---|---|---|
| Revenue Growth Rate | Percentage increase or decrease in revenue over time. | Indicates business performance and growth trends. |
| Customer Acquisition Cost | Cost incurred to acquire a new customer. | Helps assess marketing and sales efficiency. |
| Gross Profit Margin | Percentage of revenue remaining after deducting costs of goods sold. | Reflects profitability from sales and pricing strategy effectiveness. |
| Sales Revenue | Total revenue generated from sales. | Provides a clear picture of overall sales performance. |
| Conversion Rate | Percentage of leads converted into paying customers. | Identifies effectiveness of sales processes. |
Tracking these metrics allows you to measure sales performance and refine strategies. For example, monitoring your revenue growth rate helps you understand whether your sales efforts align with your business goals in Malaysia.
Customer Behavior and Retention Metrics
Understanding customer behavior is crucial for long-term success. Retention metrics reveal how well you maintain relationships with your customers. These include:
- Churn rate: Measures the percentage of customers lost over a specific period.
- Lifetime value (LTV): Indicates the total revenue a customer generates during their relationship with your business in Malaysia.
- Lead response time: Tracks how quickly your team in Malaysia follows up with new leads.
Data-driven organizations excel in customer retention. They are six times more likely to retain customers and can achieve a 3%-5% revenue increase by leveraging customer data. Strong customer relationships also enhance customer satisfaction and provide a competitive edge in the market.
Product and Service Performance Indicators
Product and service performance metrics help you evaluate what drives your sales. These indicators include:
- Average deal size: Highlights the revenue generated per closed deal.
- Sales cycle length: Measures the time taken to close a sale.
- Pipeline efficiency: Assesses how effectively your sales pipeline converts leads into deals.
By analyzing these metrics, you can identify which products or services perform best and adjust your strategies accordingly. For instance, a shorter sales cycle length often indicates a more efficient sales process, enabling you to close deals faster and improve overall sales performance.
Sales Team Efficiency and Productivity Metrics
Tracking your sales team's efficiency ensures you maximize their potential and achieve better results. Key metrics like conversion rate, sales velocity, lead response time, and average sales cycle provide valuable insights into team performance in Malaysia. For instance:
- Conversion Rate: Measures the percentage of leads turned into customers, reflecting how effectively your team engages prospects.
- Sales Velocity: Tracks how quickly deals move through the pipeline, with higher values indicating faster revenue generation.
- Lead Response Time: Highlights the importance of quick follow-ups. Responding within the first hour significantly boosts conversion chances.
- Average Sales Cycle: A shorter cycle suggests your team in Malaysia closes deals efficiently, saving time and resources.
Integrating tools like Convin’s Phone Calls can further enhance productivity. These tools have been shown to increase sales-qualified leads by 60% while reducing error rates by 50%. By focusing on these metrics, you can identify areas for improvement and implement strategies to optimize your team's performance in Malaysia.
Market Trends and Competitive Insights
Understanding market trends and analyzing competitors give you a competitive edge. Reports that include these insights help you anticipate customer needs and adapt your strategies. Consider the following tools and methods:
| Evidence Type | Description |
|---|---|
| Competitive Benchmarking Tool | Compares your performance against competitors in areas like market share. |
| Market Research Reports | Provide detailed analyses of trends and consumer preferences. |
| Competitive Market Analysis | Examines competitors’ strategies to uncover opportunities. |
| Industry Insights | Offers a clear view of the market landscape and customer demands. |
| Strategic Positioning | Helps you attract and retain customers while staying ahead of competitors. |
By leveraging these insights, you can refine your sales strategies, identify untapped opportunities, and position your business in Malaysia for long-term success.
Step-by-Step Guide to Creating Effective Sales Report
Defining Objectives for Your Sales Report
Creating an effective sales report begins with defining clear objectives. You need to determine what you aim to achieve with the report. Are you tracking revenue growth, evaluating sales team performance in Malaysia, or identifying new sales opportunities? Setting specific goals ensures your report remains focused and actionable.
For example, you might set objectives like:
- Tracking sales performance for each product line based on market trends.
- Adjusting sales goals dynamically using real-time data, especially in industries like retail.
- Evaluating customer acquisition costs to improve marketing efficiency.
Tailoring your objectives to your audience is equally important. A report for sales reps might focus on individual performance metrics, while one for management could highlight overall sales data and strategic insights. Regularly revisiting and updating these objectives ensures they stay relevant and aligned with your business goals in Malaysia.
Tip: Use sales performance management tools to track progress and provide actionable feedback to your team in Malaysia. This approach fosters continuous improvement and aligns individual contributions with company growth.
Collecting and Organizing Sales Data
Once you’ve defined your objectives, the next step is gathering and organizing your sales data. Start by identifying the data sources you’ll need, such as CRM systems, spreadsheets, or sales pipeline tools. Ensure the data you collect is accurate and up-to-date, as this forms the foundation of your analysis.
Follow these best practices for organizing sales data:
| Best Practice | Explanation |
|---|---|
| Understand Business Requirements | Comprehend your company’s needs to structure data effectively. |
| Verify Data Integrity | Ensure data accuracy and consistency for reliable analysis. |
| Utilize Intelligent Tools | Use advanced tools to streamline data collection and organization. |
| Maintain Simplicity | Keep data models simple to avoid confusion and errors. |
| Perform Calculations Ahead of Time | Aggregate daily sales into monthly statistics to reduce errors. |
For example, pre-calculating metrics like monthly revenue or average deal size simplifies your reporting process. Tools like FineReport can help you integrate data from multiple sources, ensuring a unified and error-free dataset.
Note: Organized sales data not only improves the accuracy of your reports but also enhances your ability to identify trends and make data-driven decisions.
Leveraging FineReport for Streamlined Report Creation
FineReport simplifies the process of creating effective sales reports. Its intuitive drag-and-drop interface allows you to design reports quickly, even if you lack advanced technical skills. The software connects seamlessly to various data sources, enabling you to integrate and visualize your sales data effortlessly.
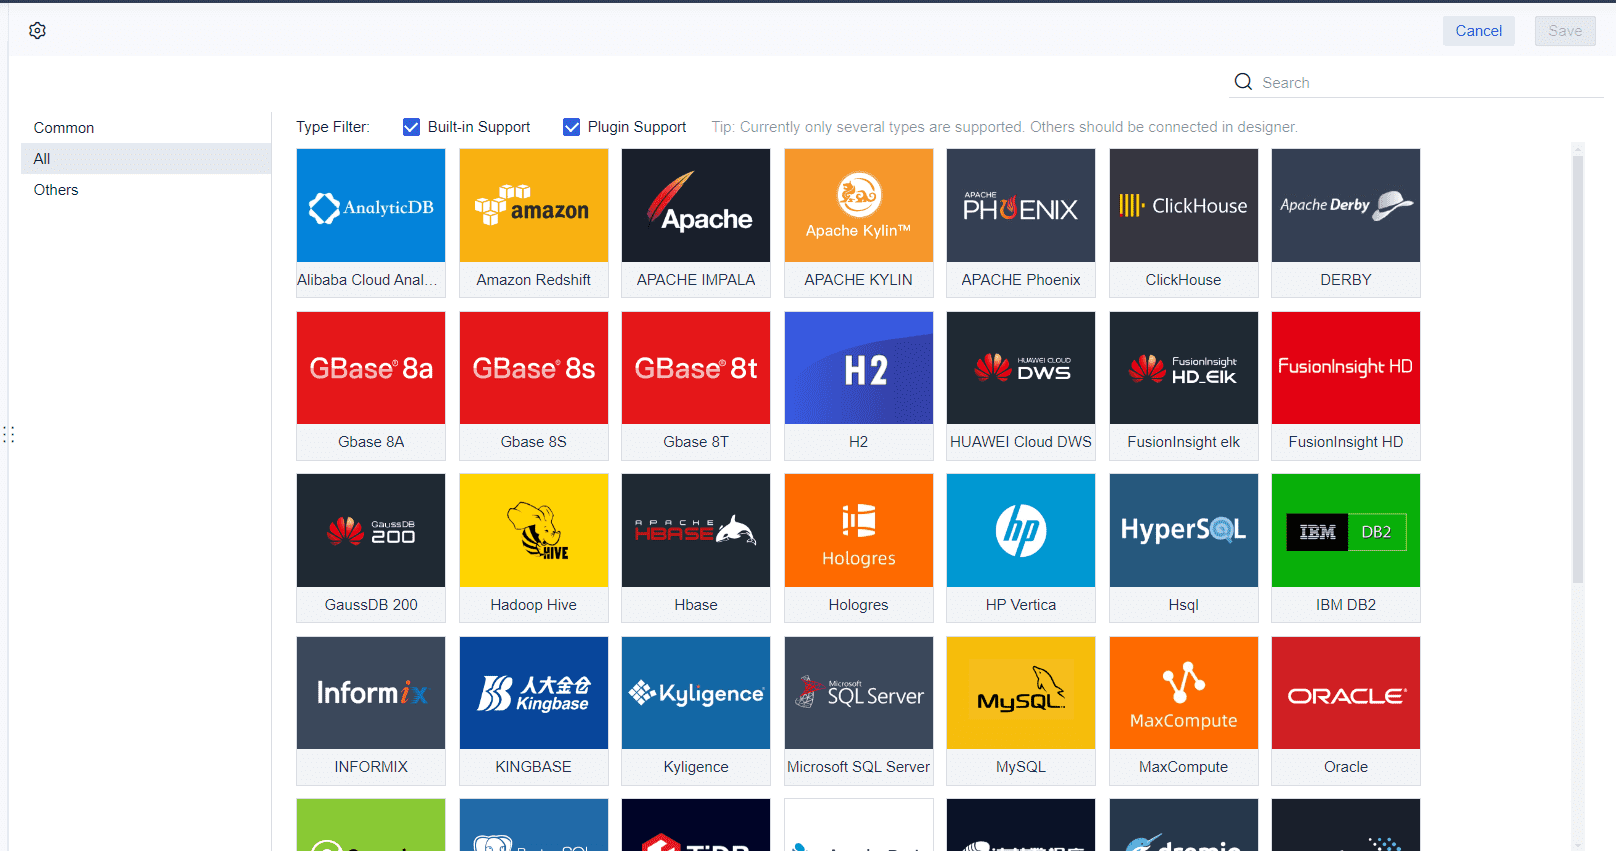
Here’s how you can use FineReport to streamline your report creation:
- Choose the Right Sales Analysis Method: Decide whether you’ll use sales trend analysis, performance analysis, or predictive sales analysis based on your goals.
- Identify the Specific Information You Need: Focus on metrics like revenue, customer acquisition costs, and sales pipeline efficiency.
- Analyze Your Data: Use FineReport’s advanced visualization tools to uncover insights. For instance, interactive dashboards can help you track sales metrics in real time.
- Share Your Results: Present your findings to stakeholders using dynamic visuals and automated scheduling features.
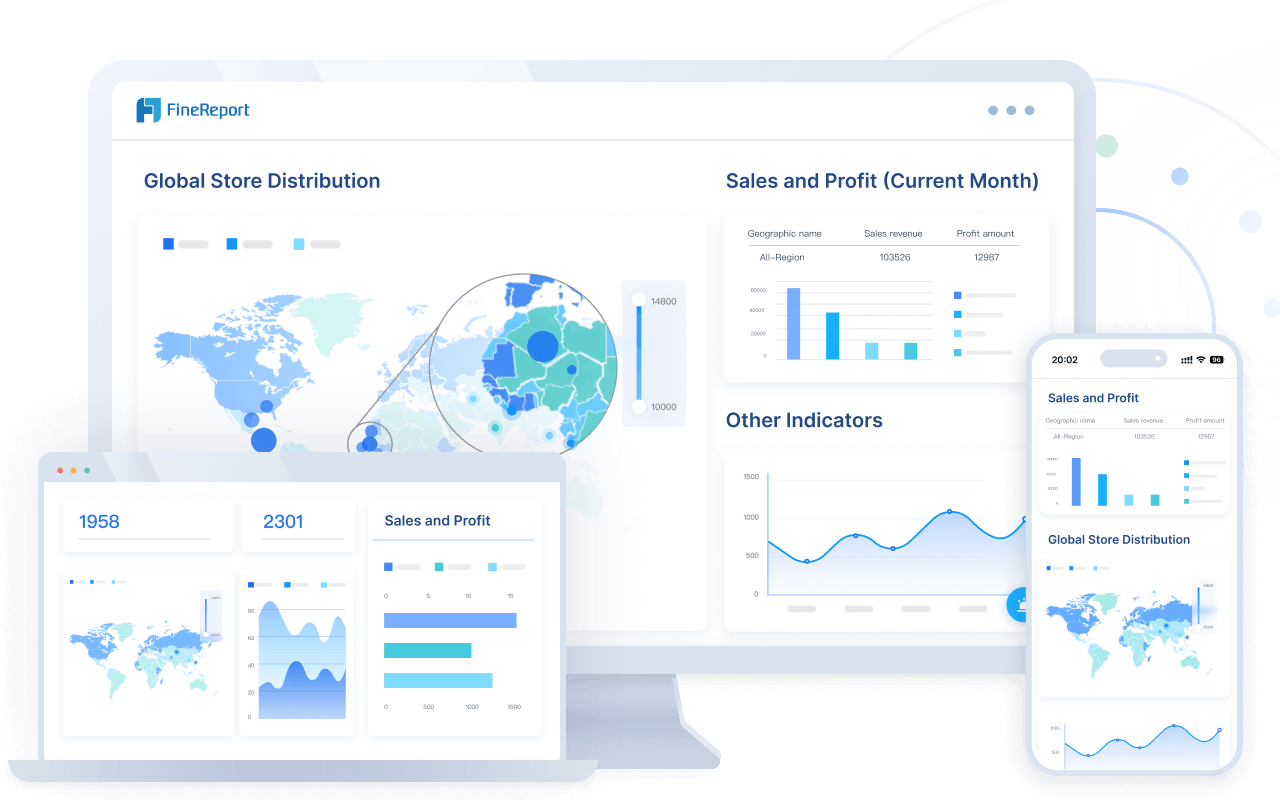
FineReport also supports automated task scheduling, allowing you to generate and distribute reports regularly without manual intervention. This ensures stakeholders receive timely updates, keeping everyone aligned with your sales goals.
Pro Tip: Leverage FineReport’s mobile BI capabilities to access your sales reports on the go. This feature ensures you stay informed and responsive, even when you’re away from your desk.
By following these steps, you can create sales reports that are not only accurate but also actionable. FineReport’s flexibility and robust features make it an ideal tool for effective sales reporting.
Structuring and Formatting Reports for Clarity
A well-structured sales report ensures clarity and makes it easier for readers to extract valuable insights. To achieve this, focus on organizing your report logically and presenting data in a visually appealing manner.
- Use Clear Headings and Subheadings
Break your report into sections with descriptive headings. This approach helps readers navigate the content effortlessly. For instance, include sections like "Revenue Metrics," "Customer Retention," and "Market Trends." Clear headings also improve readability, especially when presenting complex sales data. - Incorporate Visual Representations
Charts, graphs, and tables simplify intricate information. For example, a bar chart can highlight revenue growth trends, while a pie chart can show the distribution of sales across regions. Visuals not only make your report engaging but also help readers grasp key points quickly. - Choose the Right Layout
Tailor the format of your report to its purpose and audience. A one-page dashboard works well for quick updates, while a detailed report with an executive summary suits in-depth analysis. Always align the layout with the needs of your stakeholders. - Write in Active Voice
Active voice makes your report more engaging and easier to follow. For example, instead of saying, "Revenue was increased by 15%," write, "The sales team increased revenue by 15%." This style keeps your report dynamic and reader-friendly. - Highlight Key Insights
Use bold text or callouts to emphasize critical findings. For instance, you might highlight that "Customer retention improved by 10% this quarter," drawing attention to significant achievements.
Tip: Keep your formatting consistent throughout the report. Use the same font, color scheme, and spacing to maintain a professional appearance.
By structuring your sales report thoughtfully, you ensure that it communicates effectively and supports informed decision-making.
Presenting Sales Report to Stakeholders
Presenting your sales report effectively is as important as creating it. A well-delivered presentation ensures stakeholders understand the data and take actionable steps.
| Method | Explanation |
|---|---|
| Customization | Tailor your report to meet the specific needs of stakeholders. For example, executives may prefer high-level summaries, while sales reps benefit from detailed performance metrics. |
| Visualization | Use charts and graphs to clarify complex data. For instance, a line graph can illustrate sales trends over time. |
| Context and Insights | Provide explanations for trends and performance factors. Highlight why sales increased or decreased in specific areas. |
| Consistency and Timeliness | Establish a regular reporting schedule. Timely updates keep stakeholders informed and aligned with business goals in Malaysia. |
| Feedback and Collaboration | Encourage stakeholders to share feedback. Their input can help refine your sales strategies and improve future reports. |
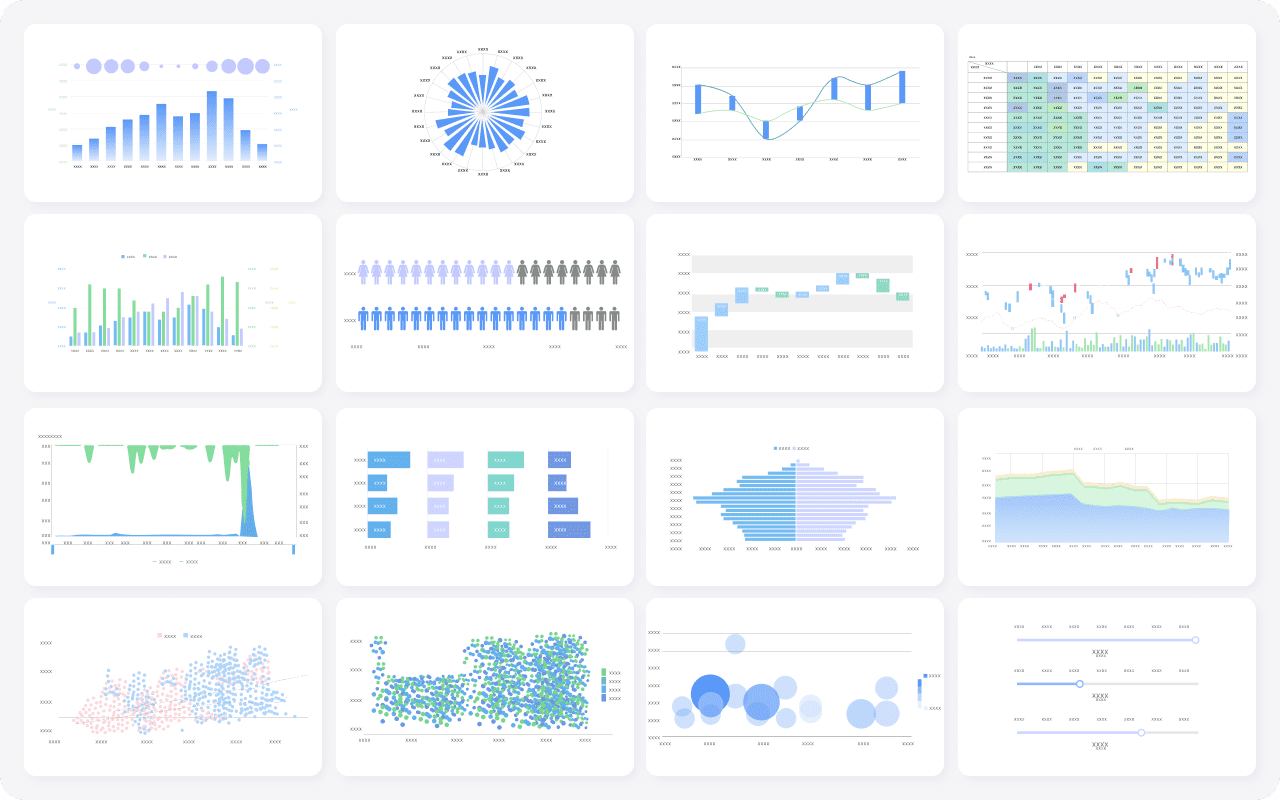
When presenting, start with an executive summary. This section should outline the report's key findings and recommendations. Next, dive into the details, using visuals to support your points. For example, show a graph of quarterly sales growth to illustrate your team's progress in Malaysia.
Engage your audience by explaining the "why" behind the numbers. If sales dropped in a particular region, discuss contributing factors and propose solutions. This approach demonstrates your understanding of the data and builds trust with stakeholders.
Pro Tip: Use FineReport's dynamic dashboards to present real-time data during meetings. This feature allows you to answer questions on the spot and provide deeper insights.
Finally, end your presentation with actionable recommendations. For example, suggest increasing marketing efforts in underperforming regions or investing in training programs to boost sales team productivity in Malaysia. Clear next steps ensure your stakeholders leave the meeting with a plan for improvement.
Three Types of Sales Report Sample
Sales Leaderboard Report
A sales leaderboard report ranks your sales team in Malaysia based on their performance. It highlights individual contributions and fosters healthy competition. This report is ideal for tracking key performance indicators (KPIs) that reflect your team's efforts and achievements.
| KPI | Description |
|---|---|
| Number of new leads | Tracks the number of new leads generated by each sales rep. |
| New pipeline generated | Measures the new sales opportunities created by each rep. |
| Quota attainment percentage | Indicates the percentage of sales quota achieved by each rep. |
| Activities logged | Counts the number of sales activities logged by each rep, reflecting their engagement level. |
| Service level agreement compliance rate | Shows how well each rep adheres to service level agreements, indicating their reliability. |
This report motivates your team in Malaysia by showcasing top performers and identifying areas for improvement. For example, tracking quota attainment percentages helps you recognize high achievers while guiding underperformers toward better results.
Overall Sales Performance Report
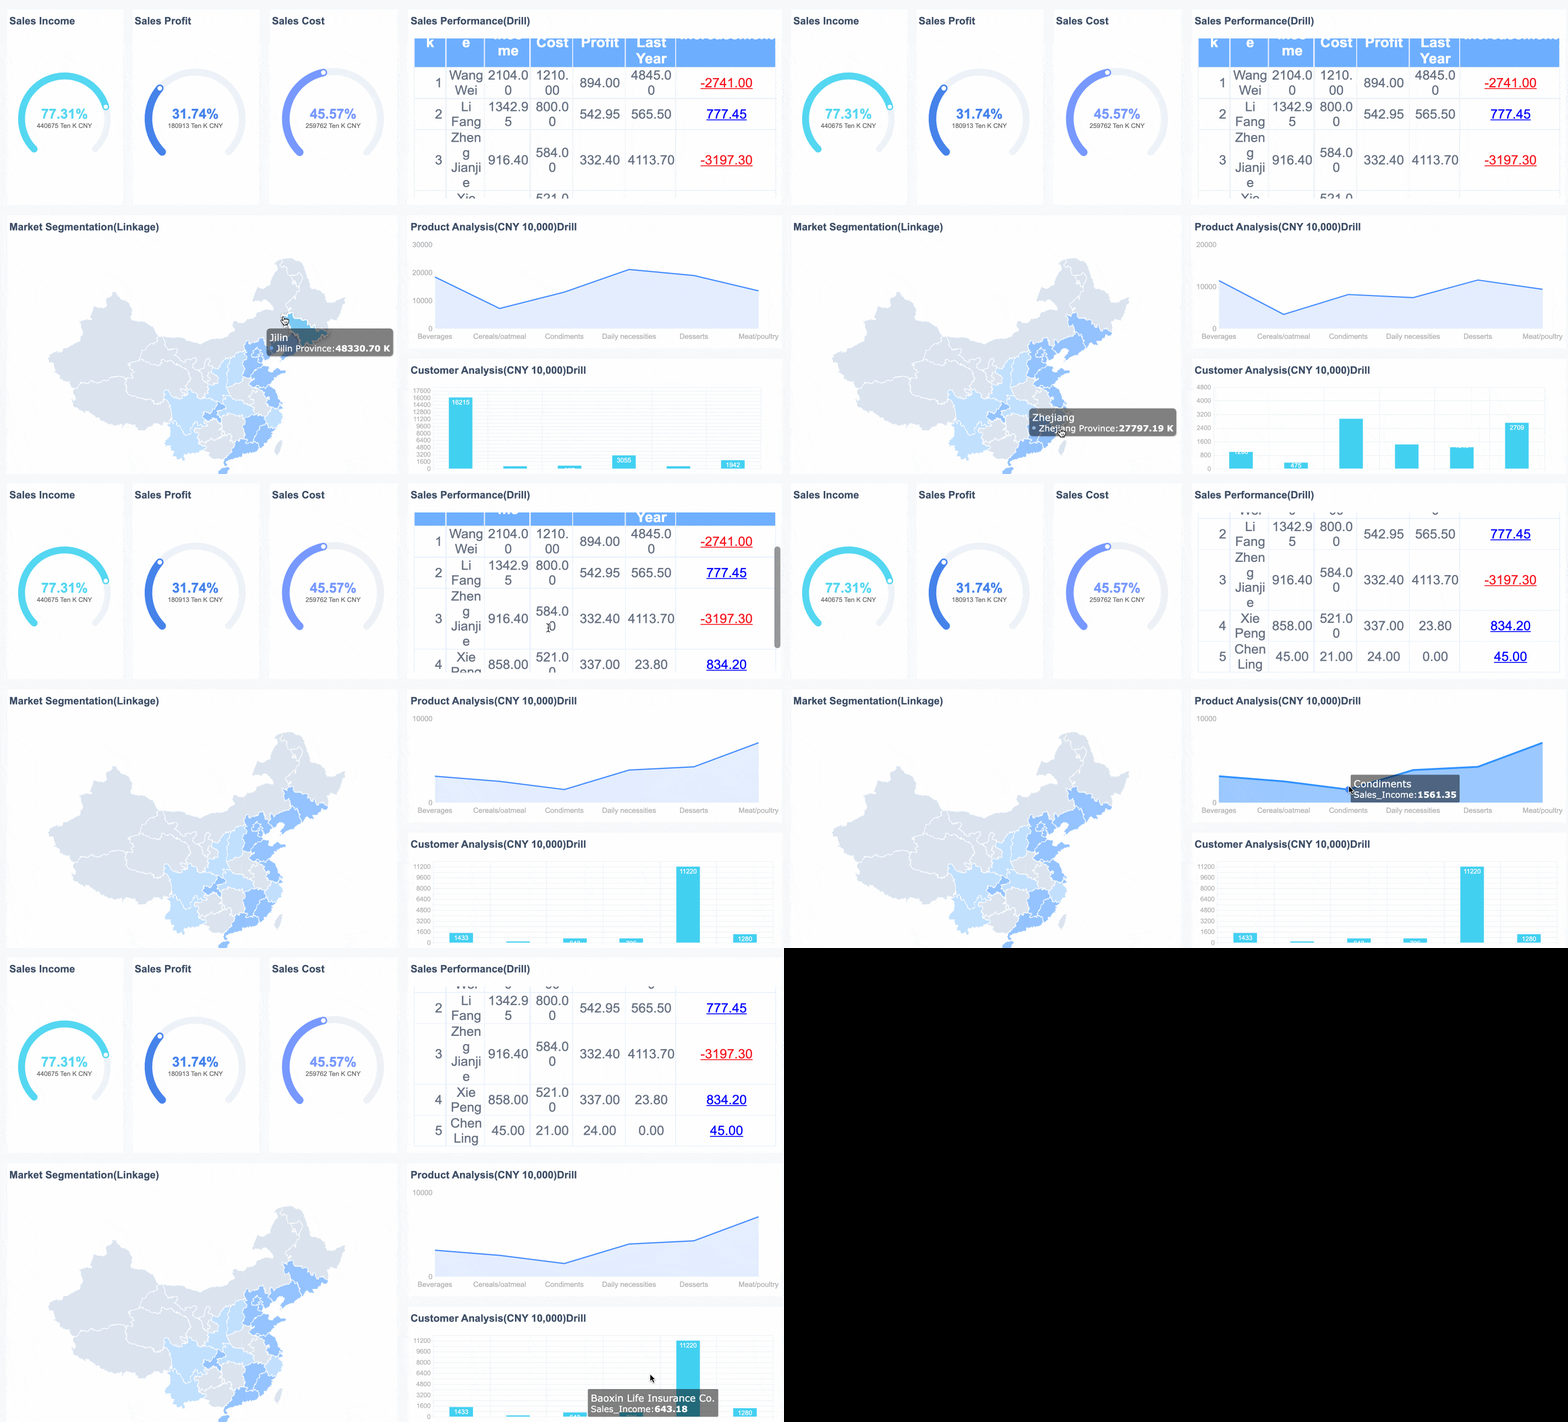
An overall sales performance report provides a comprehensive view of your business's sales activities in Malaysia. It consolidates data from various sources to evaluate your team's effectiveness and your company's financial health in Malaysia.
This report typically includes metrics such as total revenue, customer acquisition costs, and conversion rates. By analyzing these figures, you can identify trends and adjust your strategies. For instance, if your conversion rate drops, you might need to refine your sales approach or invest in additional training.
Use this report to align your sales goals with broader business objectives in Malaysia. It ensures you stay on track and make informed decisions that drive growth.
Multi-dimensional Sales Analysis Report
A multi-dimensional sales analysis report dives deeper into your sales data by examining multiple factors simultaneously. This approach provides a richer understanding of your performance.
- Analyze revenue by geographical location, product types, advertising efforts, and time periods.
- Organize sales data by quarters and product categories to track performance trends.
- Use three-dimensional representations to incorporate additional insights, such as location-based sales patterns.
For example, you might discover that a specific product performs better in certain regions during particular seasons. This insight allows you to tailor your marketing and inventory strategies, maximizing revenue. A multi-dimensional report empowers you to uncover hidden opportunities and refine your approach.
Analyzing Sales Report for Actionable Insights
Identifying Trends and Patterns in Sales Data
Analyzing sales data allows you to uncover trends and patterns that drive better decision-making. By identifying these trends, you can predict future sales performance and adjust your strategies to seize new opportunities. For instance, tracking seasonal sales trends helps you allocate resources effectively during peak periods.
Advanced analytical techniques make this process more efficient. Statistical analytics, for example, uses mathematical models to confirm trends and test hypotheses. Data mining extracts patterns from large datasets, while sentiment analysis evaluates customer feedback to gauge public opinion. Social media trend tracking monitors real-time consumer interests, and machine learning automates the discovery of complex patterns in high-dimensional data.
| Technique | Description |
|---|---|
| Statistical analytics | Utilizes mathematical models to analyze data sets, test hypotheses, and confirm trends. |
| Data mining | Extracts and discovers patterns from large data sets using methods from machine learning and statistics. |
| Sentiment analysis | Gauges public sentiment through text data, assessing social media posts and customer feedback. |
| Social media trend tracking | Monitors consumer interests in real-time on platforms like Twitter and Instagram. |
| Machine learning | Automates the discovery of complex patterns in high-dimensional data, enhancing trend analysis. |
By leveraging these techniques, you can transform raw sales data into actionable insights. For example, machine learning can reveal hidden correlations between customer demographics and purchasing behavior, enabling you to target specific segments more effectively.
Tip: Regularly review your sales trends to stay ahead of market changes. This proactive approach ensures you capitalize on emerging sales opportunities.
Using FineReport for Advanced Sales Analysis
FineReport simplifies advanced sales analysis by offering powerful tools for data visualization and reporting. Its intuitive interface allows you to create dynamic dashboards that provide real-time insights into your sales performance. These dashboards help you monitor key metrics like revenue growth, conversion rates, and customer acquisition costs.
One of FineReport’s standout features is its ability to integrate data from multiple sources. This capability ensures you have a unified view of your sales data, eliminating discrepancies and enhancing accuracy. For example, you can combine CRM data with marketing analytics to evaluate the effectiveness of your campaigns.
FineReport also supports predictive sales analysis. By analyzing historical data, the software helps you forecast future trends and identify potential sales opportunities. For instance, you can predict which products are likely to perform well in specific regions, enabling you to optimize inventory and marketing efforts.
Pro Tip: Use FineReport’s automated scheduling feature to generate and distribute sales analysis reports regularly. This ensures stakeholders receive timely updates without manual intervention.
With FineReport, you can move beyond basic reporting and delve into deeper sales data analysis. Its advanced features empower you to uncover actionable insights that drive strategic growth.
Segmenting and Comparing Data for Deeper Insights
Segmenting your sales data allows you to analyze specific groups and uncover deeper insights. By dividing your data into meaningful categories, you can identify trends and tailor your strategies to meet the unique needs of each segment.
Segmentation variables include:
- Who they are (e.g., demographics, location).
- What they do (e.g., purchasing behavior, engagement level).
- What they want (e.g., preferences, pain points).
You can collect this data through direct methods like customer surveys or indirect methods like omnichannel analytics and social listening. For example, relationship surveys provide insights into customer satisfaction, while social listening reveals emerging trends in consumer preferences.
Once segmented, comparing data across groups helps you identify patterns and opportunities. For instance, you might discover that younger customers prefer online shopping, while older customers favor in-store purchases. This insight allows you to adjust your marketing strategies accordingly.
Note: Effective segmentation requires accurate and up-to-date data. Regularly update your datasets to ensure your insights remain relevant.
By combining segmentation with statistical comparisons, you can refine your sales strategies and achieve better results. For example, comparing sales performance across regions might reveal untapped markets, enabling you to expand your reach and boost revenue.
Transforming Insights into Strategic Actions
Turning actionable insights into strategic actions is the key to achieving your sales goals and driving revenue growth. Insights derived from your sales performance report can guide you in making informed decisions that align with your business objectives in Malaysia. However, the real value lies in how you apply these insights to refine your strategies and improve outcomes.
Start by identifying the most critical insights from your sales data. Focus on metrics that directly impact revenue, such as customer acquisition costs, conversion rates, and sales pipeline efficiency. For example, if your sales performance report reveals a high churn rate, prioritize strategies to improve customer retention. This could involve enhancing customer support or introducing loyalty programs.
Next, allocate resources effectively based on the insights you uncover. Advanced data analytics can help you identify promising customer segments, ensuring your efforts target the right audience. For instance, if real-time insights show a surge in demand for a specific product, redirect your marketing and sales efforts to capitalize on this trend. Companies that use such data-driven approaches often achieve up to 30% higher win rates.
Adapting to market changes quickly is another crucial step. Real-time data allows you to pivot your strategies when new trends emerge. For example, if your sales data indicates a shift in customer preferences, adjust your product offerings or marketing campaigns to stay competitive. This agility ensures your business in Malaysia remains aligned with market demands.
Collaboration across teams is essential for transforming insights into actions. Share your findings with sales, marketing, and product development teams to create a unified strategy. For instance, if your sales report highlights underperforming regions, involve your marketing team in Malaysia to design targeted campaigns. This collaborative approach ensures every department contributes to achieving your sales goals.
Finally, track the impact of your actions and refine your strategies as needed. Use tools like FineReport to monitor real-time insights and measure the effectiveness of your initiatives. For example, if a new sales strategy leads to increased revenue in a specific region, consider replicating it in other areas. Continuous evaluation and adjustment ensure your strategies remain effective and aligned with your objectives.
Tip: Automate your reporting process to save time and ensure consistency. Tools like FineReport can generate regular updates, keeping your team in Malaysia informed and focused on achieving your sales goals.
By transforming insights into strategic actions, you can optimize your sales processes, improve team performance in Malaysia, and drive sustainable revenue growth. This proactive approach not only helps you meet your sales goals but also positions your business in Malaysia for long-term success.
Overcoming Challenges in Sales Report and Analysis
Avoiding Data Overload in Sales Report
Too much data in your sales reports can overwhelm readers and obscure critical insights. To avoid this, focus on the most relevant metrics that align with your objectives. For example, instead of including every sales metric, highlight key indicators like revenue growth, conversion rates, and customer acquisition costs.
Organizing your sales data effectively also reduces overload. Use tools that consolidate data from multiple sources into a single, unified view. FineReport, for instance, simplifies this process by integrating data seamlessly, ensuring clarity and accuracy.
Visualizing data is another effective strategy. Charts and graphs make complex information easier to understand. For instance, a bar chart showing monthly revenue trends is more digestible than a table filled with raw numbers.
Tip: Regularly audit your sales reports to remove outdated or irrelevant data. This keeps your reports concise and actionable.
Aligning Reports with Business Goals in Malaysia
Your sales reports should directly support your business objectives in Malaysia. Start by identifying your goals, such as increasing revenue, improving customer retention, or optimizing sales team performance in Malaysia. Then, tailor your reports to track metrics that measure progress toward these goals.
For example, if your goal is to enhance customer retention, include metrics like churn rate and lifetime value in your sales analysis. Aligning your reports with these objectives ensures they provide actionable insights that drive strategic decisions.
Collaboration across departments also plays a crucial role. Encourage teams in Malaysia to share data and insights to create a comprehensive view of your sales performance. Breaking down data silos fosters better communication and ensures your reports reflect the bigger picture.
| Challenge | Mitigation Strategy |
|---|---|
| Data Quality and Integration | Implement thorough data governance, regular audits, and use advanced reporting software for data merging. |
| Data Siloing | Implement systems that encourage data sharing and collaboration across departments to break down silos. |
Common Mistakes in Sales Analysis and How to Fix Them
Mistakes in sales analysis can lead to missed opportunities and financial losses. One common error is data entry mistakes, which can result in lost sales or inaccurate reports. To address this, implement regular audits and use automated tools to minimize human error.
Another frequent issue is failing to understand customer needs. This often leads to dissatisfaction and lost trust. Conduct surveys and analyze customer feedback to align your sales strategies with their expectations.
Overpromising and underdelivering is another pitfall. This erodes brand credibility and frustrates customers. Set realistic expectations and ensure your sales team in Malaysia delivers on promises.
| Type of Error | Impact on Business |
|---|---|
| Data Entry Mistakes | Lost sale worth $100 |
| Misalignment of Customer Needs | Leads to lost sales and customer dissatisfaction |
Pro Tip: Simplify pricing structures and continuously monitor feedback to prevent systemic issues. This proactive approach ensures your sales data analysis remains accurate and actionable.
How FineReport Simplifies Sales Report Challenges
FineReport offers a powerful solution to overcome common challenges in sales reporting. Its features streamline the process, making it easier for you to create, analyze, and present reports that drive actionable insights.
Unified KPI Dashboards
FineReport provides KPI dashboards that measure work performance using quantitative indicators. These dashboards consolidate data from multiple sources, offering a clear view of metrics like incremental sales and team productivity in Malaysia. For example:
| Metric Type | Description |
|---|---|
| KPI Dashboard | A tool that helps organizations measure work performance through quantitative indicators. |
| Incremental Sales | A KPI used to evaluate the financial impact of promotional activities. |
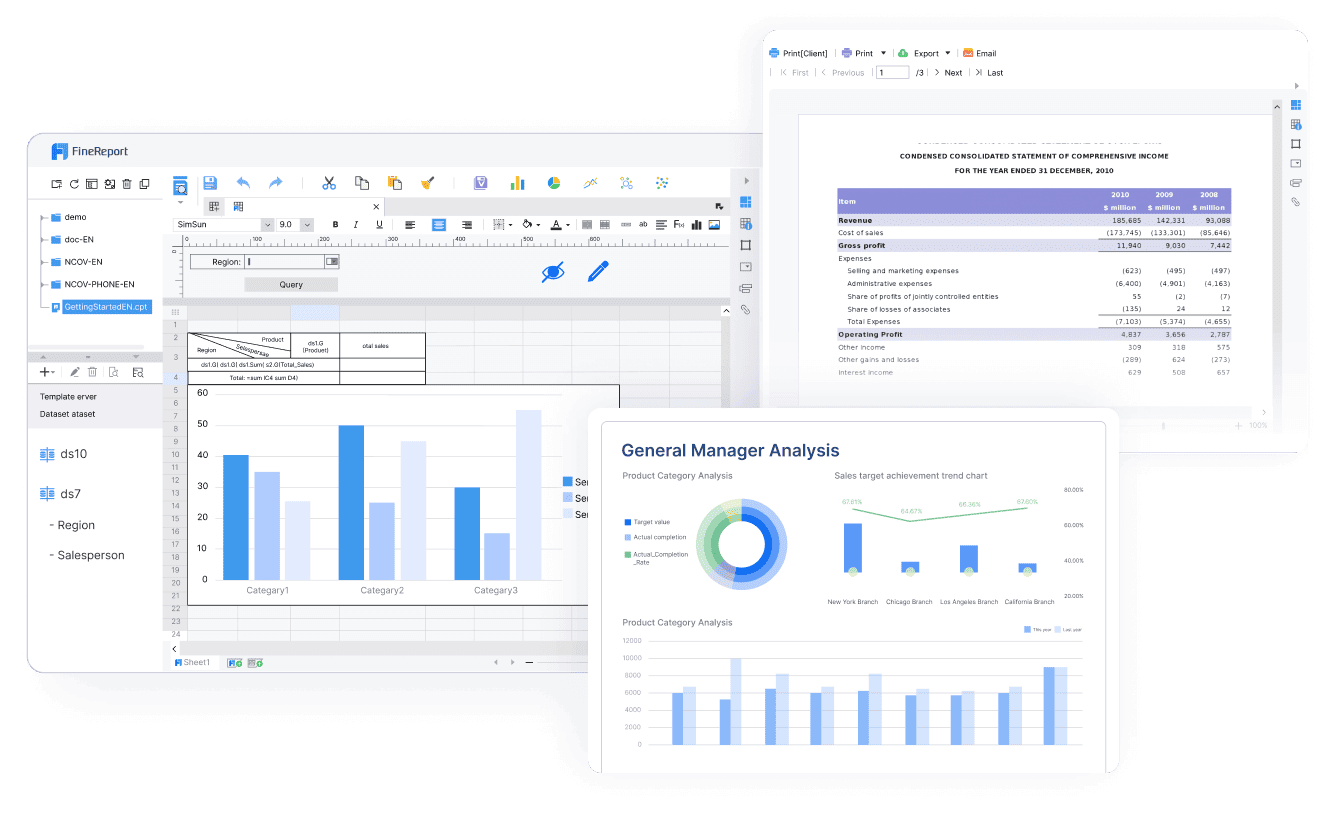
By visualizing these metrics, you can track progress and identify areas for improvement. Here is an interactive demo of KPI dashboard created by FineReport, click to experience it.
Advanced Data Analysis Tools
FineReport simplifies trend analysis, performance tracking, and predictive insights. It enables you to detect emerging patterns in business performance in Malaysia, providing contextual insights beyond single-point measurements. Predictive insights help you anticipate future scenarios based on historical data, allowing you to adjust your strategies proactively.
Dynamic Reporting Capabilities
Dynamic reporting is one of FineReport’s standout features. For instance, sales pipeline analysis monitors deals at various stages, from lead generation to negotiations. This approach uncovers potential issues and assesses the efficiency of your sales pipeline. With FineReport, you can create interactive dashboards that visualize these stages, ensuring you stay informed and responsive.
Seamless Integration and Automation
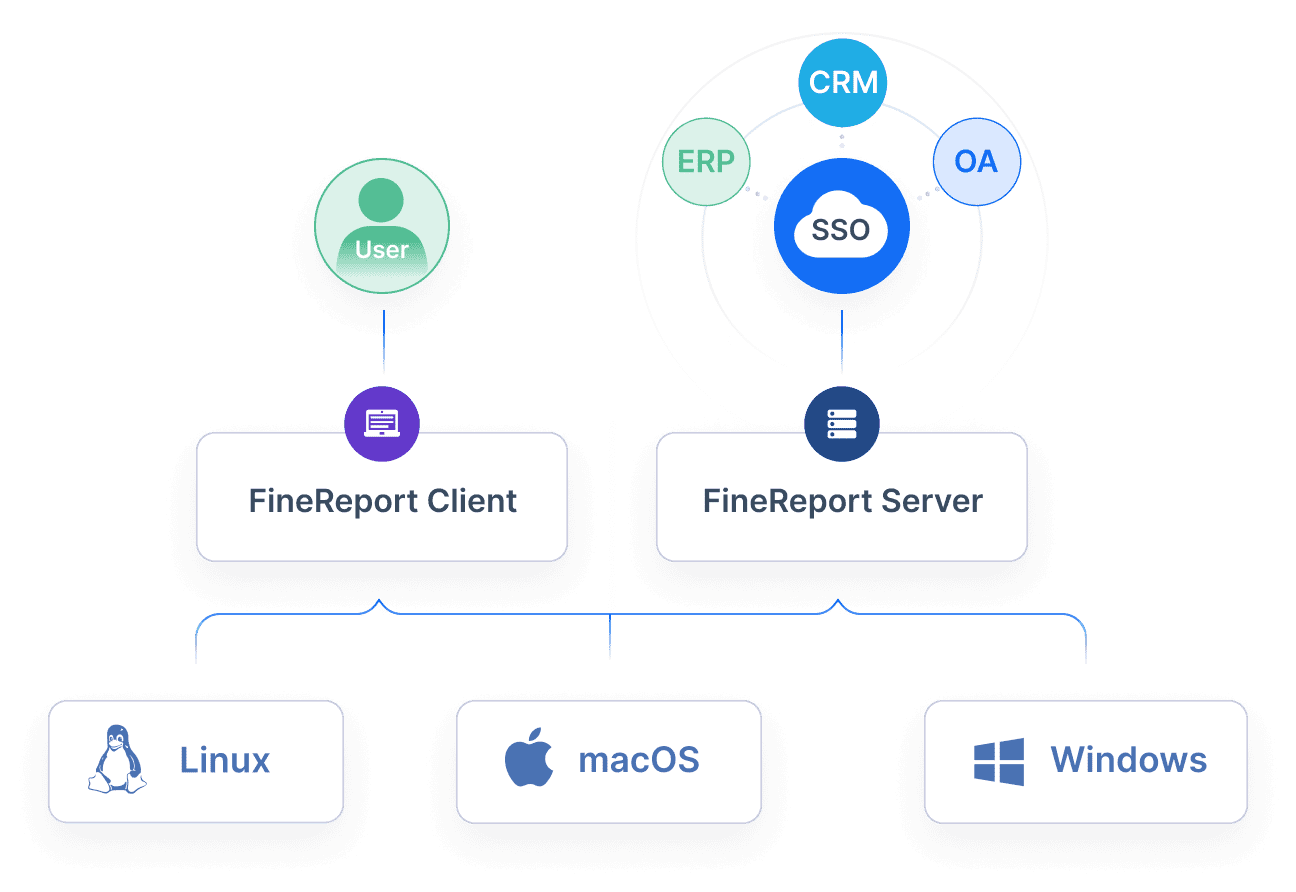
FineReport integrates data from various sources, eliminating discrepancies and ensuring accuracy. Its automated scheduling feature generates and distributes reports regularly, saving you time and ensuring stakeholders receive timely updates. This automation reduces manual intervention, allowing you to focus on strategic tasks.
Tip: Use FineReport’s mobile BI capabilities to access your sales dashboards anytime, anywhere. This flexibility ensures you stay connected to your business performance in Malaysia.
FineReport transforms sales reporting into a streamlined, efficient process. Its tools empower you to uncover actionable insights, optimize strategies, and achieve better results.
Mastering sales report creation and analysis is essential for making informed business decisions in Malaysia. Accurate data ensures reliable reporting, while trend identification reveals seasonal patterns and growth opportunities. Predictive modeling forecasts future outcomes, helping you plan strategically. Tools like FineReport simplify the process by integrating data and visualizing key metrics. By applying the outlined steps, you can uncover actionable insights, optimize your sales strategies, and drive sustainable growth. Start leveraging your sales data today to stay ahead in a competitive market.
Click the banner below to try FineReport for free and empower your enterprise to transform data into productivity!
Continue Reading About Sales Report
FAQ

The Author
Lewis
Senior Data Analyst at FanRuan
Related Articles

10 Best Retail Analytics Software Platforms for Retailers
Compare the 10 best retail analytics software platforms for retailers to boost sales, optimize inventory, and gain actionable customer insights.
Lewis
Dec 16, 2025

11 Best Tools for Research Analysis for Academics
Compare the 11 best tools for research analysis to boost academic and professional research efficiency, data management, and collaboration.
Lewis
Dec 11, 2025

10 Best Market Research Data Analysis Tools to Try This Year
See the top 10 market research data analysis tools to boost insights, streamline workflows, and make smarter business decisions this year.
Lewis
Dec 11, 2025


