You can access analyst reports online through online brokers, research databases, independent providers, financial news sites, and specialized tools like FineReport by FanRuan. Choosing the right source matters because speed and reliability change based on the method you choose. For example, paid sources usually provide faster and more reliable access, while free sources may offer limited coverage.
| Source Type | Speed of Access | Reliability of Reports | Cost |
|---|---|---|---|
| Paid Sources | Generally faster | More comprehensive | Typically $50+ |
| Free Sources | May be slower | Limited access | Often free or low cost |
Think about your needs for depth, cost, and integration when you decide how to access analyst reports.
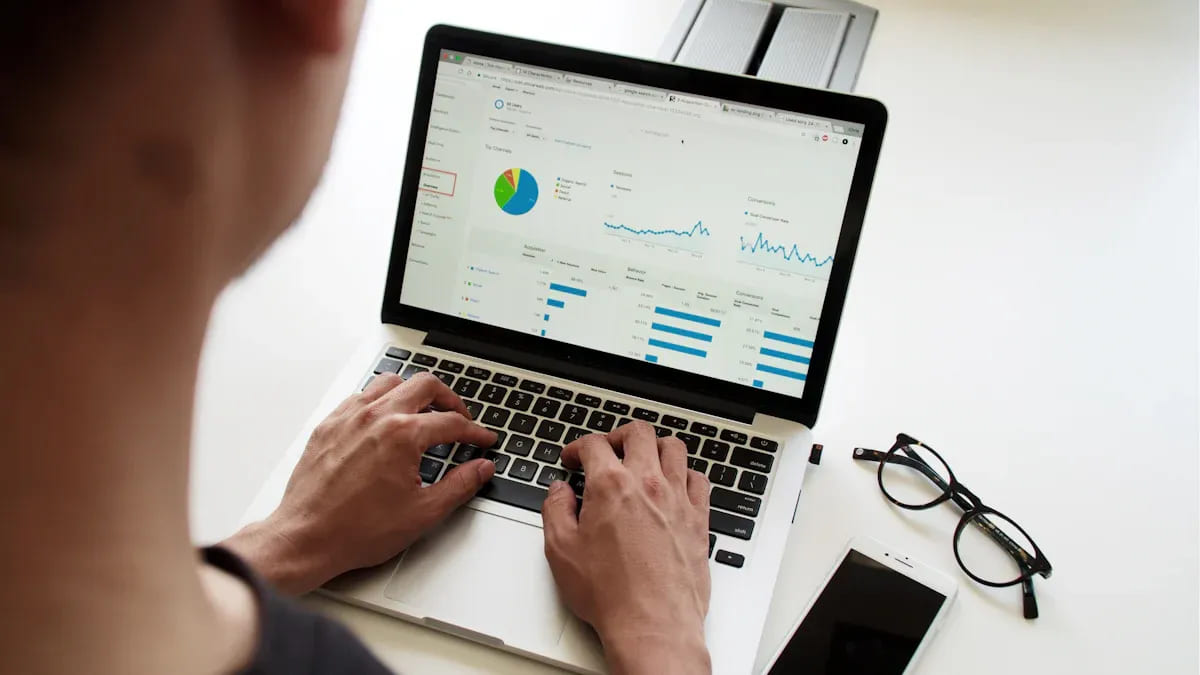
You can find analyst reports quickly by using online brokers. Major platforms like Fidelity, Charles Schwab, and TD Ameritrade give you direct access to equity research reports. These brokers partner with top research providers to deliver company report summaries, detailed equity analysis, and market insights. When you open an account, you unlock a dashboard filled with tools for analysis and investment decisions. You see recommendations from equity research analysts, including buy, hold, or sell ratings. Many brokers also show equity valuation models and market trends, helping you compare analysts’ opinions.
Tip: If you want the most up-to-date information, choose brokers that update their equity research reports daily. This ensures you never miss new market insights or changes in analyst recommendations.
You can follow these steps to access analyst reports through your online broker account:
Most online brokers organize reports by equity sector, market cap, or analyst rating. You can filter results to see only the most relevant analysis. Some platforms let you compare multiple analysts’ insights side by side, making it easier to spot trends in equity valuation and market outlook.
When you use online brokers for analyst reports, you get several advantages:
You also face some disadvantages:
Online broker platforms provide tools and features that help you make informed investment decisions. You receive news and analyst opinions directly on your dashboard. However, you must decide on trades without expert guidance. This means you need to understand how to interpret equity research analyst ratings and market analysis before acting on any recommendation.
Note: Always compare insights from different analysts and research providers. This helps you avoid relying on a single opinion and gives you a broader view of the equity market.
You can use research databases like Investext and Mergent Online to find equity research reports from top research providers. Investext gives you full-text access to company and industry reports from major investment banks and brokerage firms. The coverage is global and stretches from the 1980s to today. This means you can review historical equity analysis and see how analysts’ opinions have changed over time.
To find a company report in Mergent Online, follow these steps:
These databases help you compare equity research analyst recommendations and market insights from different analysts. You get a wide range of equity analysis, which supports better investment decisions.
Tip: Use the company’s ticker symbol when searching. This helps you find the most accurate equity research reports quickly.
Bloomberg and Capital IQ are powerful tools for accessing equity research reports and market analysis. You can use their stock screening tools to filter for specific companies or sectors. These platforms let you view analyst estimates, consensus opinions, and detailed equity valuation models. If you want to dig deeper, use the Workspace feature, which requires an account.
On Bloomberg, you can use commands like ADVRES to search for analyst reports. Capital IQ lets you filter by equity, sector, or research provider. Both platforms give you access to a wide range of equity research analyst opinions, which helps you spot trends in the market and compare different analysts’ recommendations.
Note: Always check the date of the report. The most recent equity research reports give you the latest market insights and analysis.
When you use research databases, you must follow certain rules and restrictions. Most databases limit access to faculty, students, and staff at universities or institutions. You can use the information for educational, personal, or non-commercial purposes only. Copyright and contract law apply, so you can only cite short excerpts for academic use. You cannot share entire analyst reports or use them for commercial gain.
Keep these tips in mind:
You must use the data only for the approved project. After your project ends, return or destroy the files. Linking data sets with identifiable records is not allowed. These rules protect the integrity of the information and ensure you use analyst reports responsibly.
Remember: Following these guidelines helps you maintain access to valuable equity research reports and supports ethical research practices.
You can find analyst reports from many independent providers. These companies offer equity research reports and market insights that help you make better investment decisions. Here is a table that shows what some top providers offer:
| Provider | Key Features |
|---|---|
| AlphaSense | Wall Street Insights® with equity research from 1,000+ firms, indexed and searchable. |
| Morningstar | Investment trackers, market news, insights for stocks, mutual funds, ETFs, and portfolio management tools. |
| Zacks | Zacks Rank scores, equity research reports, and a focus list portfolio of stocks. |
| Seeking Alpha | Crowdsourced insights, Quant Ratings, expert articles, and personalized alerts. |
You can subscribe to these services for deeper analysis and more frequent updates. AlphaSense gives you access to a large collection of equity research reports from many analysts. Morningstar helps you track investments and provides ratings for stocks and funds. Zacks offers daily updated scores and equity research analyst recommendations. Seeking Alpha lets you read expert articles and get alerts about market changes.
You can choose between free summaries and paid subscriptions. Free access gives you basic information, such as market news and short analyst opinions. Paid subscriptions unlock full equity research reports, deeper analysis, and real-time alerts. Here is a table that compares premium and pro subscription models:
| Feature | Premium | Pro |
|---|---|---|
| Cost | More budget-friendly, suitable for long-term and casual investors. | Higher price, ideal for professionals needing real-time data and exclusive insights. |
| Report Depth | Provides in-depth research and stock ideas, but lacks real-time data. | Offers deeper analysis, including institutional-grade research and real-time alerts. |
| Target Audience | Long-term investors and casual users. | Hedge fund managers, day traders, and investment professionals. |
If you want more detailed equity analysis, you should consider a paid subscription. Premium plans work well for casual investors who need basic equity research reports and market insights. Pro plans suit professionals who need real-time information and exclusive equity valuation models.
Tip: Start with free summaries to learn how analysts think. Upgrade to paid access when you need more detailed equity research reports or want to follow market trends closely.
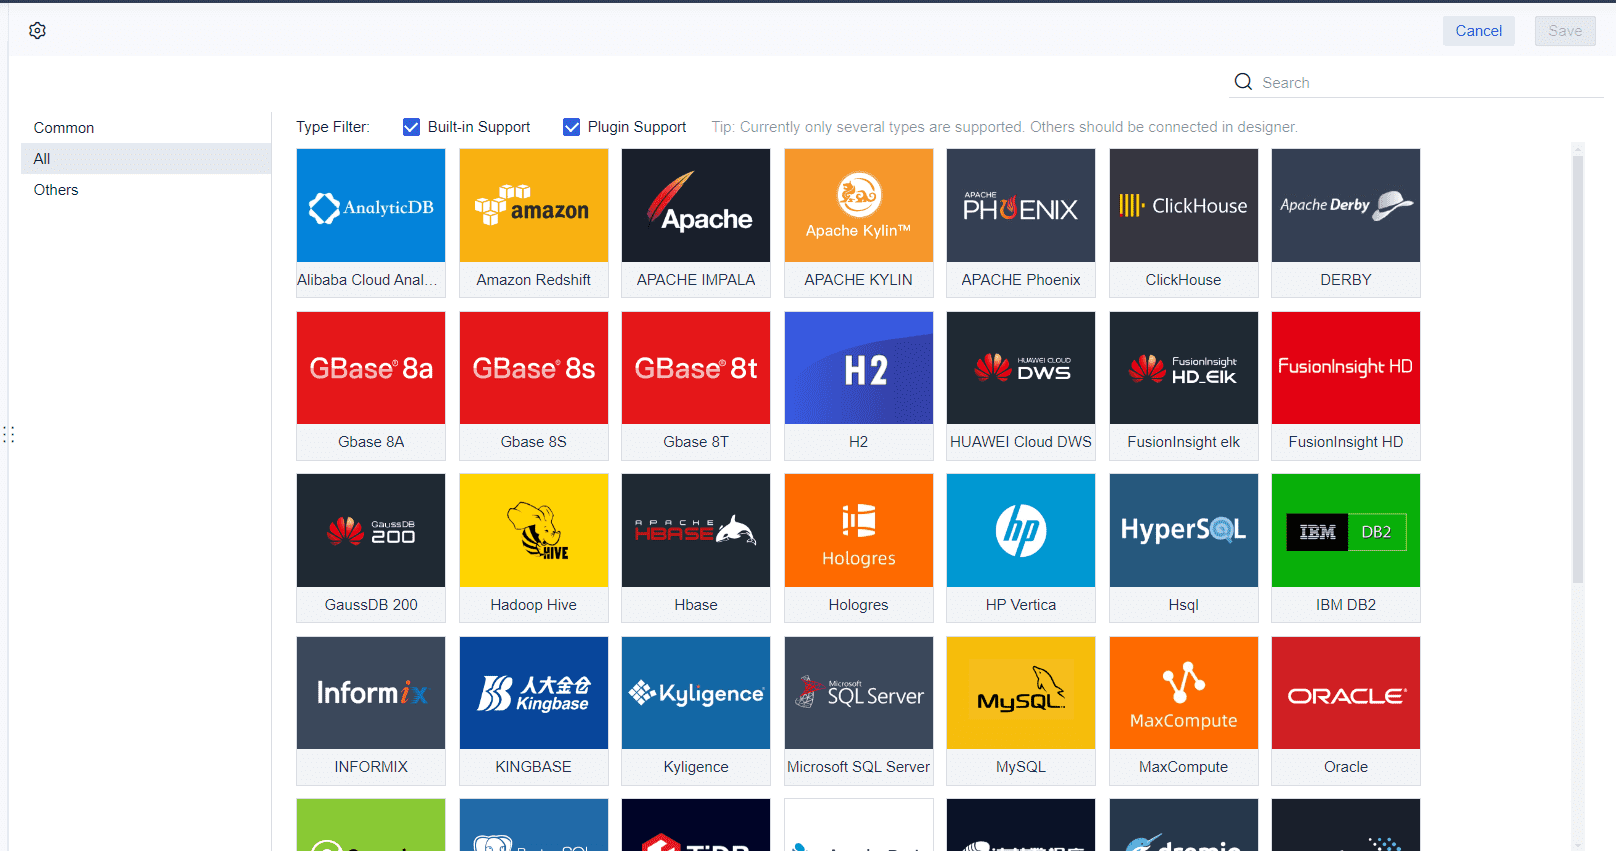
You can use FineReport by FanRuan to integrate and visualize equity research data from independent providers. FineReport connects to multiple data sources, including files, databases, and APIs. You can combine equity research reports from AlphaSense, Morningstar, Zacks, and others into one dashboard. This helps you compare analysts’ recommendations and market analysis side by side.
FineReport lets you create interactive dashboards and reports. You can track equity performance, monitor market trends, and view analyst insights in real time. The platform supports automated report generation and scheduled distribution, so you always have the latest information for your investment decisions. You can also customize dashboards to show key metrics, such as equity valuation and analyst ratings.
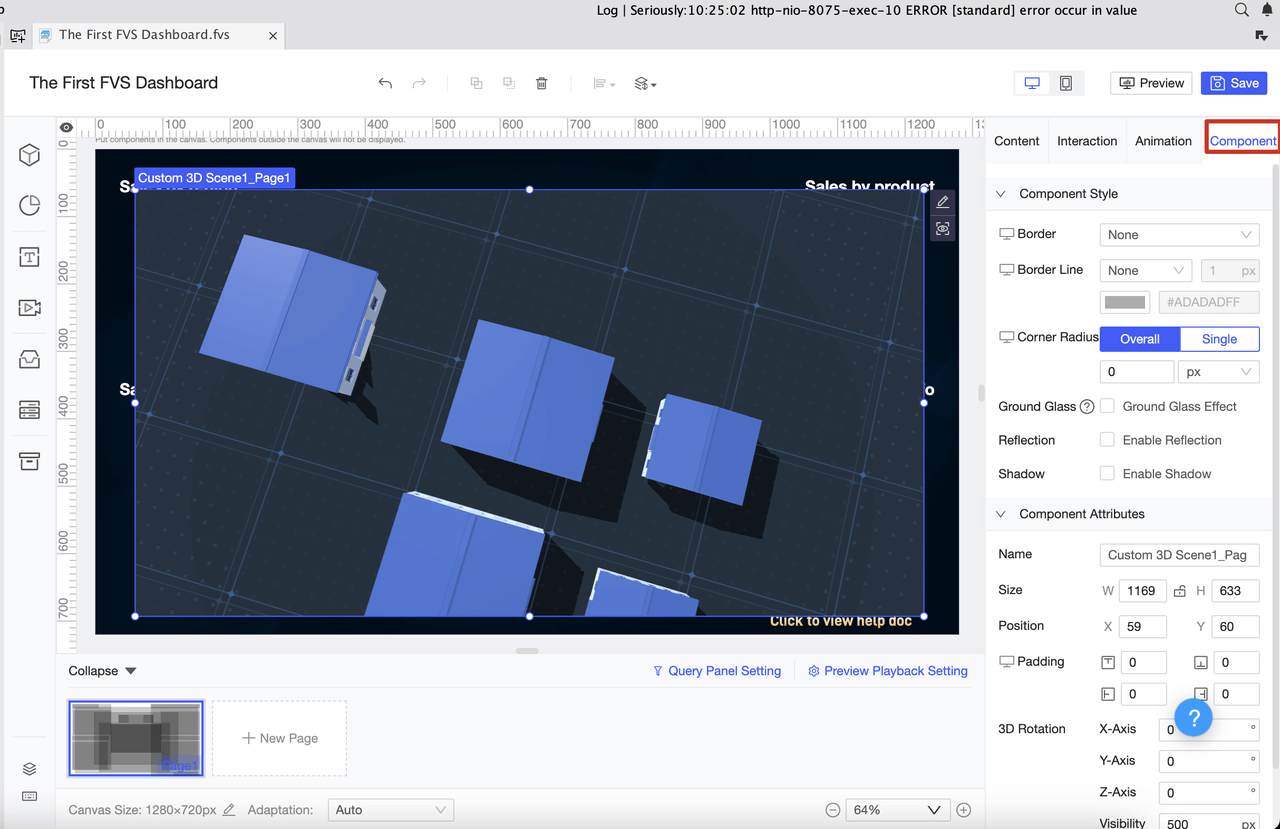
If you work in finance or manufacturing, FineReport helps you manage risk and make smarter investment decisions. You can use the platform to analyze equity research analyst opinions, spot market opportunities, and improve your decision-making process.
Note: FineReport by FanRuan streamlines your workflow by bringing all your equity research reports and market insights into one place. You save time and gain a clearer view of the information you need.
You can access analyst reports and equity research reports on popular financial news sites. These platforms collect opinions and summaries from many analysts, making it easier for you to compare equity insights. Some of the most widely used aggregator platforms include Yahoo Finance, Seeking Alpha, MarketBeat, and TipRanks. Each site offers unique features for equity analysis and market tracking.
Here is a table that compares Seeking Alpha and TipRanks:
| Feature | Seeking Alpha | TipRanks |
|---|---|---|
| Aggregation of News Feeds | No, relies on contributors | No, relies on tracked analysts |
| Number of Contributors | Over 8,000 | Tracks over 96,000 financial experts |
| Unique Rating System | Proprietary Quant Rating | Smart Score |
| Portfolio Analysis | Yes, with community features | Yes, with SmartInvestor Portfolio |
| Subscription Cost | Starts at $29.95 a month | Similar pricing structure |
| Stock Ideas Source | Contributors and Quant Ratings | Top analysts tracked |
You can use these platforms to follow equity trends, read market news, and view analyst ratings. Yahoo Finance and MarketBeat also provide summaries and ratings from multiple analysts, helping you make better investment decisions.
When you visit these aggregator platforms, you see summaries and ratings from many analysts. These summaries give you a quick overview of equity performance and market outlook. You often find consensus ratings, which show the average opinion from several analysts. This helps you understand how experts view a stock’s future.
Here is a table that explains how to interpret consensus ratings and report summaries:
| Evidence Type | Description |
|---|---|
| Consensus Earnings Estimates | These are averaged projections from multiple analysts. You get a more reliable indicator of a company's expected financial performance. This helps you gauge market expectations effectively. |
| Analyst Ratings | Ratings such as 'buy', 'hold', or 'sell' reflect analysts' opinions on a stock's future performance. You can use these ratings to make informed investment decisions based on current valuations and risk factors. |
You should look at both the consensus ratings and individual analyst opinions. This gives you a balanced view of equity research analyst insights. You can use these summaries to compare equity valuation and market analysis before making any investment decisions.
Tip: Always check the date of the report. Recent information gives you the most accurate market insights.
Free access to analyst reports on financial news sites comes with some limitations. You may notice that the data is not always consistent or standardized. This can make equity analysis and integration more difficult. Free sources often cover only specific assets or markets, so you might not find historical data for deeper analysis.
Here is a table that outlines the main limitations:
| Limitation | Description |
|---|---|
| Inconsistency | Free data sources may not provide standardized data formats, complicating integration and analysis. |
| Limited Scope | Often only cover specific assets or markets with restricted historical data, hindering analysis. |
| Reliability Issues | Lack quality control and verification processes, increasing the risk of errors and inconsistencies. |
| Lack of Support | Users typically do not have access to dedicated support teams for assistance with issues. |
You should use free summaries for quick market insights and basic equity research reports. If you need deeper analysis or more reliable information, consider paid sources or integrated platforms. Free access works well for tracking equity trends and reading analyst opinions, but it may not provide the depth you need for complex investment decisions.
Note: Use multiple sources to verify information and avoid relying on just one platform for your equity analysis.
You can bring together equity research reports from many sources using FineReport by FanRuan. The platform lets you connect to databases, files, and APIs, so you gather information from different systems with ease. You create WorkBook objects from template files in XML format, which helps you organize your data for analysis. FineReport also allows you to save reports in formats like PDF, Excel, Word, and images. This flexibility means you can share equity insights with your team or keep them for your own review.
Here is a table that shows how FineReport supports data integration and output:
| Functionality | Description |
|---|---|
| Input Functions | Create WorkBook objects from XML template files. |
| Output Functions | Save reports in PDF, Excel, Word, and image formats. |
| Data Integration | Retrieve and generate reports from databases, files, and APIs. |
You use these features to combine equity research analyst opinions, market trends, and valuation data into one place. This makes your analysis more complete and helps you see patterns that might affect your investment decisions.
FineReport gives you tools to automate how you access and use equity research reports. You design complex reports with a drag-and-drop interface, so you do not need to write code. You can set up scheduled reporting, which means the system generates and distributes reports at regular intervals. This keeps your equity analysis up to date without extra effort.
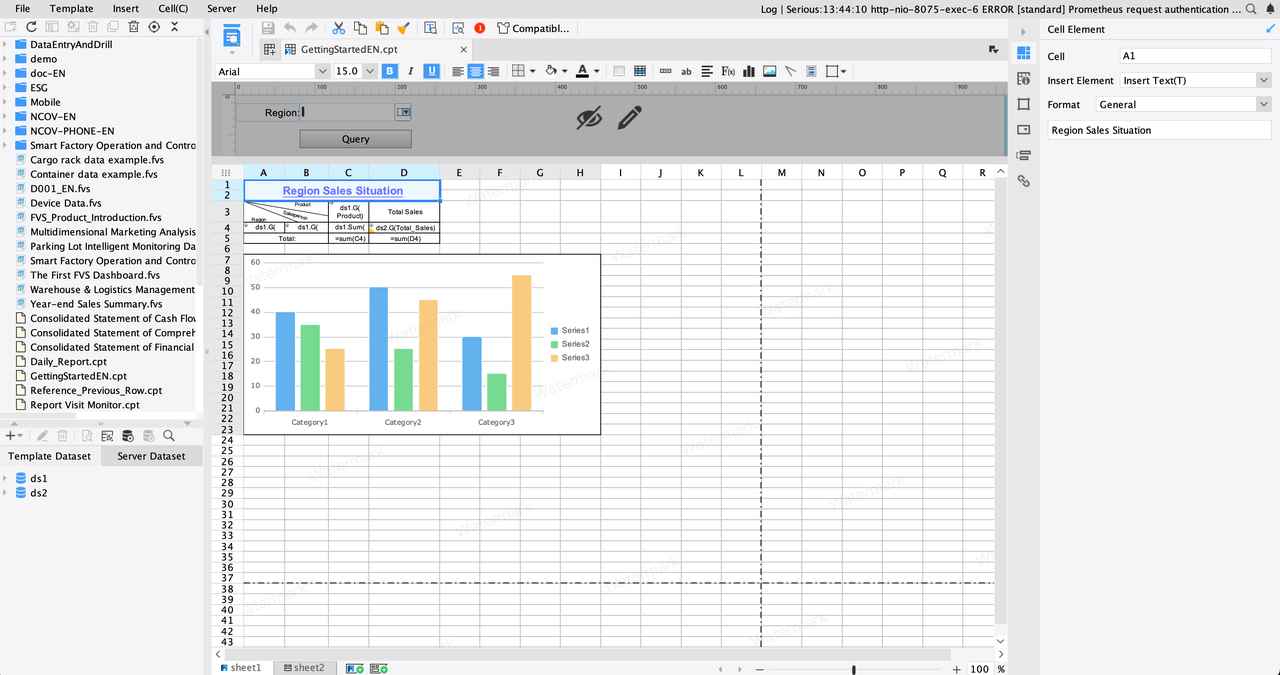
You also get interactive dashboards and advanced charting options. These features let you visualize equity performance, compare analysts’ recommendations, and track market changes in real time. FineReport supports mobile compatibility, so you view reports on your phone or tablet. You can customize templates and use role-based access control to decide who can see or edit reports.
Here is a table that highlights key automation features:
| Feature | Description |
|---|---|
| Visual Report Designer | Drag-and-drop interface for easy report creation. |
| Scheduled Reporting | Automates report generation and distribution. |
| Interactive Dashboards | Dynamic dashboards with filters and real-time updates. |
| Mobile Compatibility | Responsive reports for mobile devices. |
| Role-Based Access Control | Control who can view or edit reports. |
You use these tools to streamline your workflow. You spend less time gathering information and more time on analysis and making smart investment decisions.
FineReport helps you build real-time dashboards that show equity data and market insights as they happen. You can monitor equity performance, track analyst ratings, and see valuation changes instantly. The dashboards update with new information from your connected data sources, so you always have the latest equity research reports.
If you work in finance or manufacturing, you use these dashboards for risk management and decision-making. You spot trends, compare analysts’ opinions, and respond quickly to market changes. FineReport supports real-time data processing, so your analysis stays current. You can embed dashboards into other applications, making it easy to share equity insights across your organization.
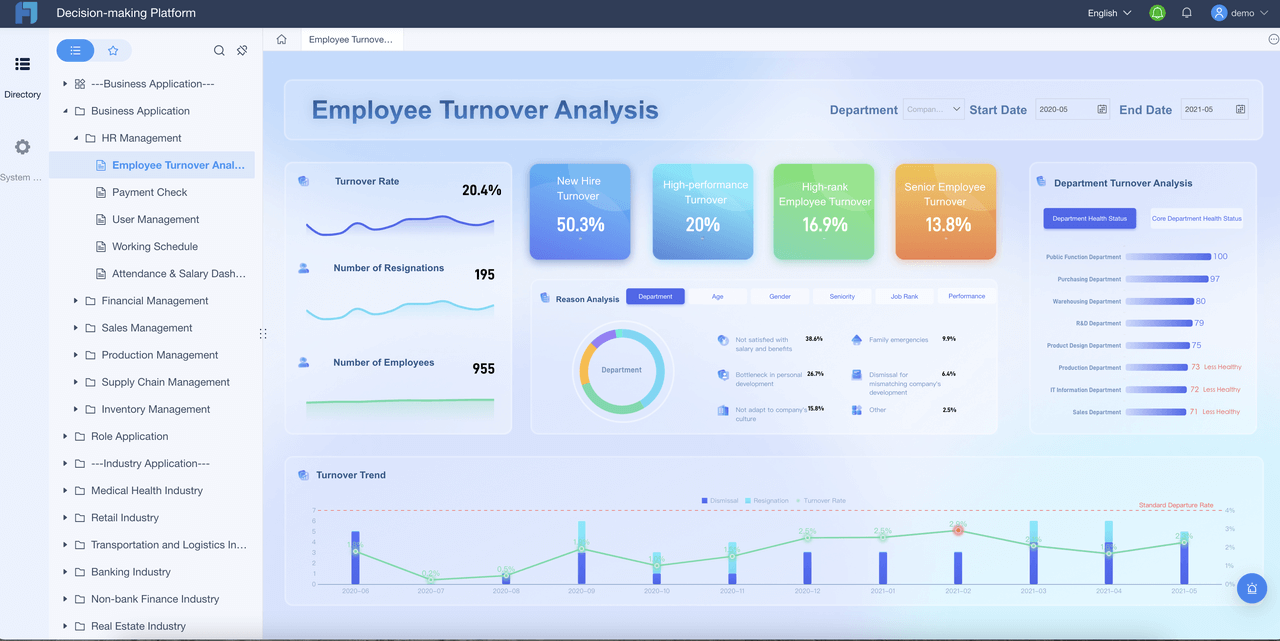
Tip: Use real-time dashboards to keep your team informed and ready to act on new market information.
FineReport by FanRuan gives you a complete solution for integrating, automating, and visualizing equity research reports. You make better investment decisions by combining analysts’ opinions, market analysis, and valuation data in one place.

When you read equity research reports, you see many terms and ratings. Understanding these helps you make sense of the analysis and use the information for your own investment decisions. Here are the most common ratings you will find:
| Rating Type | Description |
|---|---|
| Buy | A recommendation to purchase the stock, indicating strong expected performance. |
| Hold | Suggests maintaining current holdings without additional investment. |
| Sell | Indicates that the stock should be sold, reflecting a negative outlook. |
| Outperform | Suggests the stock will perform better than the market average. |
| Underperform | Indicates the stock is expected to perform worse than the market average. |
| Strong Buy | A more aggressive recommendation to buy, suggesting very high expected performance. |
| Strong Sell | A very bearish recommendation, indicating the stock should be sold or shorted. |
| Price Target | The expected price level for the stock within a specified time frame, typically 12 months. |
You also see the term "consensus." This means the average opinion from several analysts about a stock’s future. Consensus ratings give you a quick view of how experts feel about an equity. Price targets show where analysts expect the equity to trade in the future. These targets help you judge if a stock is undervalued or overvalued based on current market prices.
Note: SEC and FINRA regulations require analysts to base their ratings on reliable information. Firms must also disclose how many securities they rate as buy, hold, or sell. This helps you trust the objectivity of the analysis.
You can use equity research reports to guide your investment decisions, but you should always look at more than one source. Analysts often have different opinions about the same equity. To get the best insights, follow these steps:
When you combine multiple analyst opinions, you get a fuller picture of the equity and the market. This approach helps you avoid common pitfalls, such as relying on a single equity research analyst or ignoring new market trends. Always remember that no analysis can predict the future with certainty. Use the insights from equity research reports as one part of your overall investment strategy.
Tip: Stay alert for conflicts of interest. Analysts must follow strict rules, but you should still read disclosures and understand any possible bias in the analysis.
By learning how to interpret key terms and ratings, you gain confidence in using equity research reports. This knowledge helps you access better insights, compare valuation estimates, and make smarter investment decisions in the equity market.
You might feel tempted to download analyst reports from unofficial websites or share files with friends. This practice can lead to serious problems for you and your organization. Many people do not realize how common piracy and misuse are in the world of equity research. Surveys show that about one-third of respondents see piracy, overuse, and misuse of software as major issues. These problems cause significant revenue losses, with some reports showing losses above 30% because of unlicensed software.
When you use unauthorized sources, you risk getting outdated or inaccurate equity information. Analysts work hard to provide reliable market insights, but pirated reports often lack updates or proper context. You also expose yourself to malware and security threats. Hackers sometimes hide viruses in files labeled as equity research or market analysis. If you download these files, you could lose access to your computer or sensitive data.
You should always choose legal sources for analyst reports. Trusted platforms and official providers ensure that you get accurate equity data and market trends. This helps you make better investment decisions and keeps your analysis safe from errors or security risks.
Tip: If you see a report offered for free on an unofficial site, ask yourself if it comes from a reliable source. Protect your equity research and avoid shortcuts that could harm your investment strategy.
You need to understand copyright rules before you use or share analyst reports. Copyright laws protect the work of analysts and research firms. If you ignore these rules, you could face steep fines or even jail time for severe violations. Legal consequences can be serious, especially if you copy or distribute entire equity reports without permission.
Follow these best practices to stay compliant:
Copyright infringement can lead to expensive damages payments. You might also lose access to trusted equity research platforms if you break the rules. Analysts rely on these protections to keep their work safe and maintain the quality of market analysis.
Note: Always check the terms of use before downloading or sharing analyst reports. Respecting copyright helps you build a trustworthy investment process and supports the work of analysts in the equity market.
You have many ways to access analyst reports online. Free summaries work well for casual investors. Professionals and organizations benefit from paid subscriptions or integrated platforms like FineReport by FanRuan. Use multiple sources and AI tools to verify accuracy. Automate reporting for efficiency and real-time insights. If you want deeper integration, follow these steps:
Explore resources such as NYU Business Library, Bloomberg, and Value Line for further learning.
| Challenge | Solution |
|---|---|
| No data hygiene | Establish good data hygiene |
| Static reporting | Use dynamic reporting tools |
| Manual report creation | Automate reporting processes |
Click the banner below to try FineReport for free and empower your enterprise to transform data into productivity!
What Are Paginated Reports and How Do They Work

The Author
Lewis
Senior Data Analyst at FanRuan
Related Articles
Top 10 Best Automation Reporting Tool Picks for Businesses
Compare the top 10 best automation reporting tool options to streamline business data, automate reports, and boost decision-making efficiency.
Lewis
Jan 03, 2026
Top 10 Reporting Systems and Tools for Businesses
See the top 10 reporting systems that help businesses automate data, build dashboards, and improve decision-making with real-time analytics.
Lewis
Jan 03, 2026

What is integrated reporting and why is it important
Integrated reporting combines financial and non-financial data, offering a full view of value creation, transparency, and stakeholder trust.
Lewis
Dec 12, 2025