Businesses have access to a wide range of reporting tools software that streamline the creation of client reports and support data-driven decision-making. The following list highlights the best client reporting tools for organizations seeking efficiency, flexibility, and robust analytics:
FineReport
Tableau
Microsoft Power BI
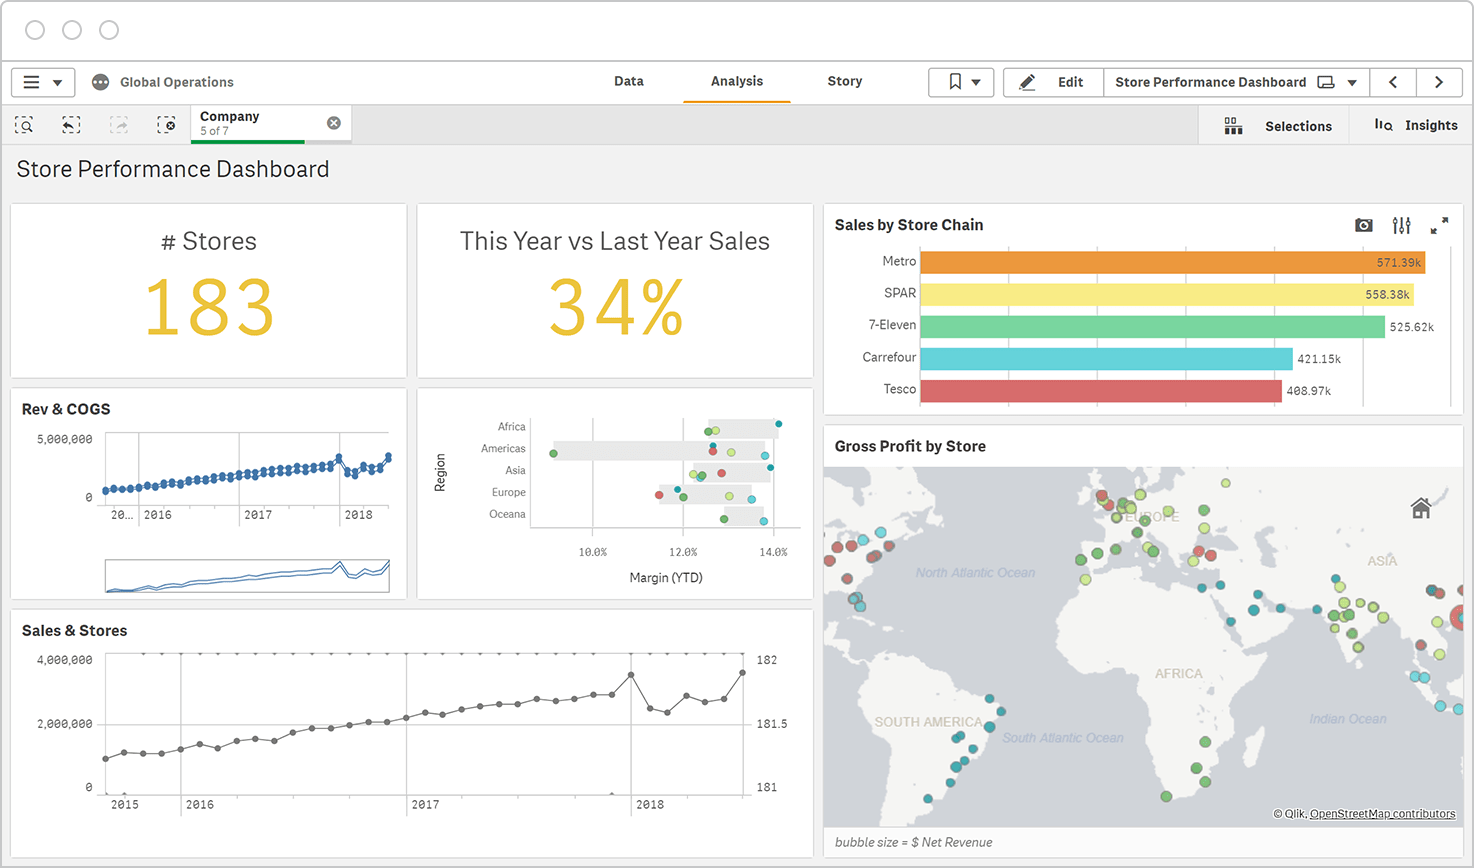
Qlik Sense
Zoho Analytics
Domo
Looker
Adverity
Funnel
SAP Analytics Cloud
Reporting Ninja
AgencyAnalytics
These client reporting tools help businesses visualize data, automate reporting, and deliver actionable insights. Each reporting software solution offers unique strengths, making them suitable for different business needs and industries.
The top 12 reporting tools software empower businesses to transform data into actionable insights. Solutions like FineReport, Tableau, and Power BI lead the market, helping business leaders generate reports, visualize trends, and support data-driven decision-making. Large enterprises often adopt advanced reporting platforms due to complex data needs, while sectors such as IT, telecom, and retail accelerate their use of reporting tools software. The selection criteria focus on features, usability, integration, pricing, user ratings, and industry recognition. Effective reporting enables businesses to streamline operations, uncover data-driven opportunities, and drive growth.
Top Reporting Tools Software List
Selection Criteria Explained
Experts select the top reporting tools software based on several critical factors. The most common features include:
Integration capabilities for connecting with business applications and gathering data automatically.
Automated notifications that alert teams to issues or compliance gaps.
Audit reports that offer transparency and detailed records for decision-making.
Qualitative analytics to uncover trends and potential problems in client reports.
Scheduled reports that automate routine reporting and keep stakeholders informed.
Pricing models vary widely. Some reporting software, such as Tableau, uses a per-user subscription, while others like Domo or Looker may require custom quotes. Many client reporting tools do not list fixed prices, reflecting a flexible approach that adapts to business size and feature requirements.
User ratings, usability, and industry recognition also play a significant role. Businesses prioritize tools that offer intuitive interfaces, strong support, and proven reliability. The right reporting tools software empowers organizations to manage data efficiently, generate accurate reports, and drive business growth.
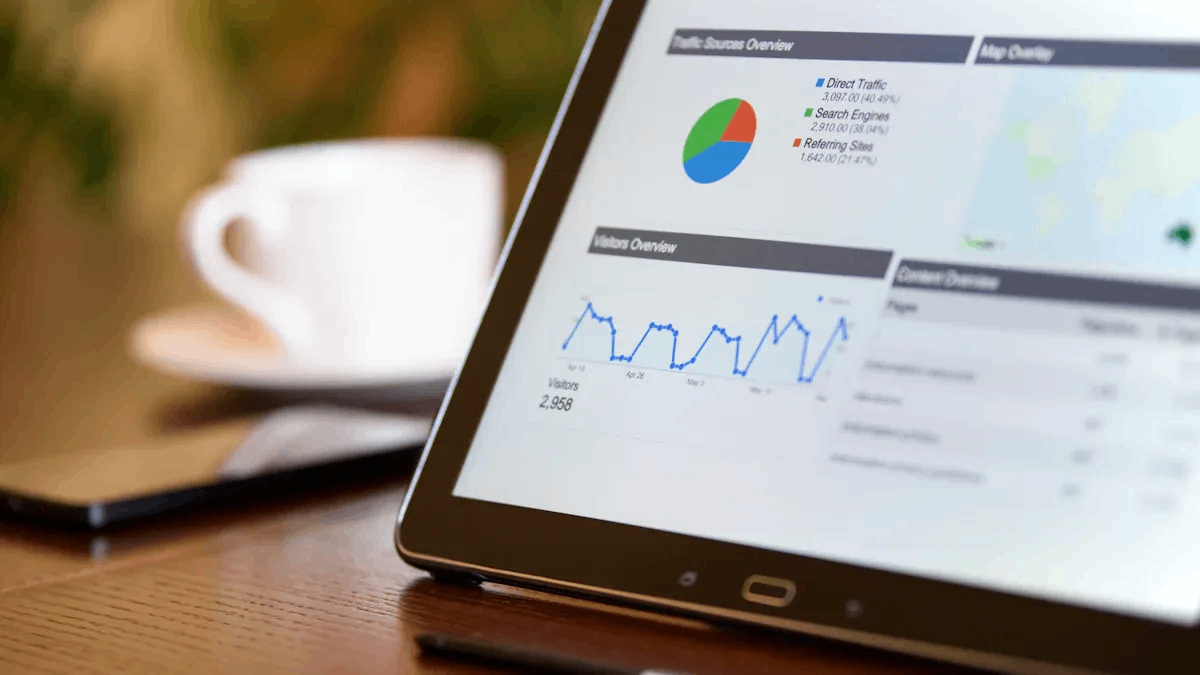
Reporting tools software refers to business intelligence tools that enable businesses to generate reports and analyze data from multiple sources, such as databases and spreadsheets. These solutions offer pre-designed and customizable templates, making report creation efficient and accessible. Businesses use these platforms to collect, analyze, and present data through dashboards, graphs, and detailed reports. Both technical and non-technical users can extract meaningful insights, which democratizes access to business intelligence software.
The core functions of reporting tools software include:
Connecting to diverse data sources, including cloud apps and social media.
Handling large data sets for growing business needs.
Offering flexible reporting options with various chart types.
Scheduling automated report delivery.
Sharing reports with role-based permissions for collaboration.
Exporting data in formats like CSV, Excel, and PDF.
Creating custom reports tailored to specific business requirements.
Building dashboards for quick visualization of key metrics.
Core Function
Description
Reporting & Dashboards
Create reports and analytical dashboards to gain insights.
Connect to multiple and diverse data sources seamlessly.
Scheduling & Automation
Automate report generation and delivery.
Custom Report Creation
Tailor reports and dashboards to specific business needs.
Advanced Analytics
Incorporate AI, machine learning, and predictive analytics.
Mobile Accessibility
Access reports and dashboards on mobile devices for on-the-go decision-making.
Business Benefits
Businesses gain measurable advantages from using reporting tools software. These platforms automate reporting workflows, reducing manual effort and freeing up resources for higher-value tasks. Custom visualizations help users understand complex data, leading to faster discovery of insights. Integration of diverse data sources creates a single source of truth, which improves report consistency and reliability.
Reporting tools software enables businesses to access critical data quickly, supporting data-driven decision-making. Real-time tracking of key performance indicators allows business leaders to monitor progress and respond to changes rapidly. Self-service features empower non-technical users to explore data and monitor their own performance, reducing reliance on IT teams.
FineReport by FanRuan stands out among the best client reporting tools for large enterprises and government organizations. This reporting software delivers robust capabilities for creating reports, dashboards, and client reports tailored to complex operational needs. Users benefit from a flexible report designer that supports drag-and-drop creation of custom dashboards and customizable reports. FineReport integrates seamlessly with over 500 data sources, enabling real-time data access and advanced data handling.
Key strengths include:
Advanced data import and export features for diverse data sources.
Custom reporting options for tailored business insights.
Strong security protocols to protect sensitive data.
24/7 vendor support through chat and email.
Operational efficiency tools such as funnel analysis and competitive intelligence.
Seamless integration into enterprise workflows, especially in government administration.
Dynamic data access via SaaS BI tools and platforms.
Collaboration features that enhance productivity across teams.
Mobile BI capabilities for accessing visual dashboards and interactive dashboards on any device.
Enterprise-level scalability for handling large volumes of data and reports.
FineReport’s focus on operational efficiency and collaboration makes it a top choice for organizations seeking automated reporting, interactive dashboards, and advanced analytics. The platform’s AI-driven features support data-driven decision-making and empower users to build live dashboards for monitoring key metrics.
FineReport’s comprehensive support and integration capabilities position it as one of the best client reporting tools for businesses with complex reporting requirements.
Below is a Hotel Group Management Dashboard created by FineReport.
Tableau remains a leader in reporting software, known for its powerful data visualization tools and interactive dashboards. Users praise Tableau for its ability to create visually compelling dashboards and reports that support data exploration and AI-driven analytics. The platform offers a wide range of chart types and supports integration with multiple data sources.
However, users report several limitations:
Steep learning curve and complex administration.
Slow dashboard loading and refresh delays.
Limited customization and formatting options for reports.
Integration and data syncing challenges, especially for embedding analytics.
Declining customer support quality.
High cost and complex pricing structure.
Weak data management and ETL capabilities compared to competitors.
Need for technical resources and coding workarounds.
Tableau’s pricing starts at $70 per user per month, which is higher than many other client reporting tools. Despite these challenges, Tableau excels in creating interactive dashboards and visual dashboards for organizations that prioritize advanced analytics.
Microsoft Power BI offers a cost-effective reporting software solution for small and mid-sized organizations. The platform provides a free desktop version for individual users and a Pro plan at approximately $14 per user per month for collaborative analytics. The Premium plan includes advanced AI features and enhanced data refresh capabilities.
Tool
Starting Price (per user/month)
Key Features / Notes
Power BI
$9.99 - $14 (Pro), $20 (Premium)
Free desktop version; included in Microsoft 365 E5; Premium offers advanced AI, 48 data refreshes/day
Tableau
$70
Higher cost justified by advanced analytics and visualization capabilities
Power BI supports automated reporting, interactive dashboards, and integration with Microsoft 365. Users appreciate its affordable pricing, flexible deployment options, and strong AI-driven analytics. The platform’s real-time data capabilities and customizable reports make it a popular choice for organizations seeking scalable reporting solutions.
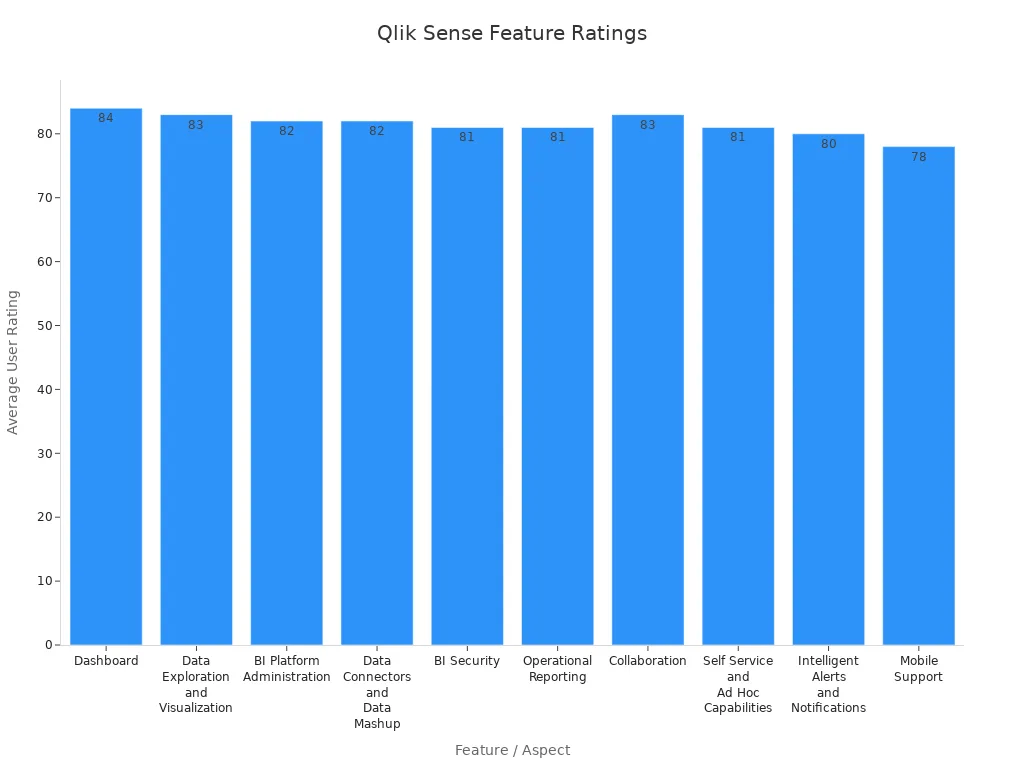
Qlik Sense ranks among the best client reporting tools for its unique associative engine and interactive dashboards. Users highlight its ability to visualize dynamic data relationships and explore patterns through AI-powered analytics. Qlik Sense offers centralized administration, broad data connectivity, and robust security features.
Feature / Aspect
Average Rating / Sentiment Score
Key Praised Attributes and User Comments
Associative Engine
N/A
Unique engine enabling dynamic data relationship visualization and exploration
Dashboard
84
Includes alerts, notifications, KPIs, visual analytics, interactive features
Users describe Qlik Sense as trustworthy, productivity-enabling, performance enhancing, and fair
Qlik Sense excels in operational reporting, collaboration, and mobile support. The platform’s interactive dashboards and AI-driven features enable users to create custom dashboards and live dashboards for real-time insights.
Zoho Analytics is a versatile reporting software that integrates with over 250 business platforms and data sources. The platform supports ETL/ELT, data pipelines, and API access for custom integrations. Users can embed analytics into business applications and branded portals using APIs and SDKs.
Native connectors and pre-built integrations enable seamless data synchronization and automation.
Supports embedding analytics and interactive dashboards inside business applications.
Integrates with major databases, cloud services, CRM systems, and business apps.
AI-powered analytics enhance data insights across integrated platforms.
Mobile BI apps provide analytics access on the go.
Zoho Analytics offers customizable reports, automated reporting, and collaborative sharing features. The platform’s AI-driven analytics and data visualization tools make it a strong choice for organizations seeking unified insights across multiple platforms.
Domo provides a cloud-based reporting software solution focused on business intelligence and data visualization. The platform supports automated reporting, interactive dashboards, and integration with various data sources. Users can create custom dashboards and visual dashboards for monitoring key metrics.
Industry analysts report several limitations:
Misleading sales and trial experiences.
Clunky data integration and storage with limited change control.
Slow data filtering and reporting performance.
Lack of true ad-hoc reporting for most users.
Poor security and governance with limited role granularity.
Expensive pricing and high onboarding fees.
Domo’s strengths include AI-powered analytics, mobile support, and real-time data visualization. However, organizations should consider its limitations when evaluating client reporting tools for scalability and security.
Looker, now part of Google Cloud, offers advanced reporting software for organizations needing complex analytics. The platform supports AI-driven analytics, interactive dashboards, and integration with multiple data sources. Looker’s pricing is premium, making it suitable for larger organizations with sophisticated reporting needs.
Users appreciate Looker’s customizable reports, live dashboards, and data modeling capabilities. The platform’s AI features enable predictive analytics and automated reporting. Looker integrates with Google Cloud and other business applications, supporting scalable data workflows.
Adverity specializes in marketing analytics and automated reporting. The platform provides over 600 pre-built connectors for data integration, including marketing platforms, CRMs, cloud storage, and custom APIs. Adverity’s ETL capabilities automate data extraction, transformation, and loading for unified reporting.
Automated data integration from diverse sources.
Customizable data views and transformation templates.
Export and sync data to BI tools, databases, and other apps.
AI-assisted features for data mapping, harmonization, and transformation.
Automated data preparation and maintenance alerts.
Sharing marketing insights via Slack and embedding dashboards.
Adverity’s AI-driven features and interactive dashboards support efficient reporting and insights generation for marketing teams. The platform’s flexibility and extensibility make it a top choice for organizations seeking advanced data integration and visualization tools.
Funnel offers reporting software designed for marketing and advertising analytics. The Standard pricing tier starts at $499 per month for organizations with advertising spends up to $100,000 monthly. Higher-priced plans are available for larger budgets.
Funnel supports features such as A/B testing, conversion tracking, personalized messaging, segmentation, targeting, and lead scoring. Users can automate reporting, create interactive dashboards, and consolidate data from multiple platforms. The platform’s customizable reports and live dashboards enable organizations to optimize marketing campaigns and track performance.
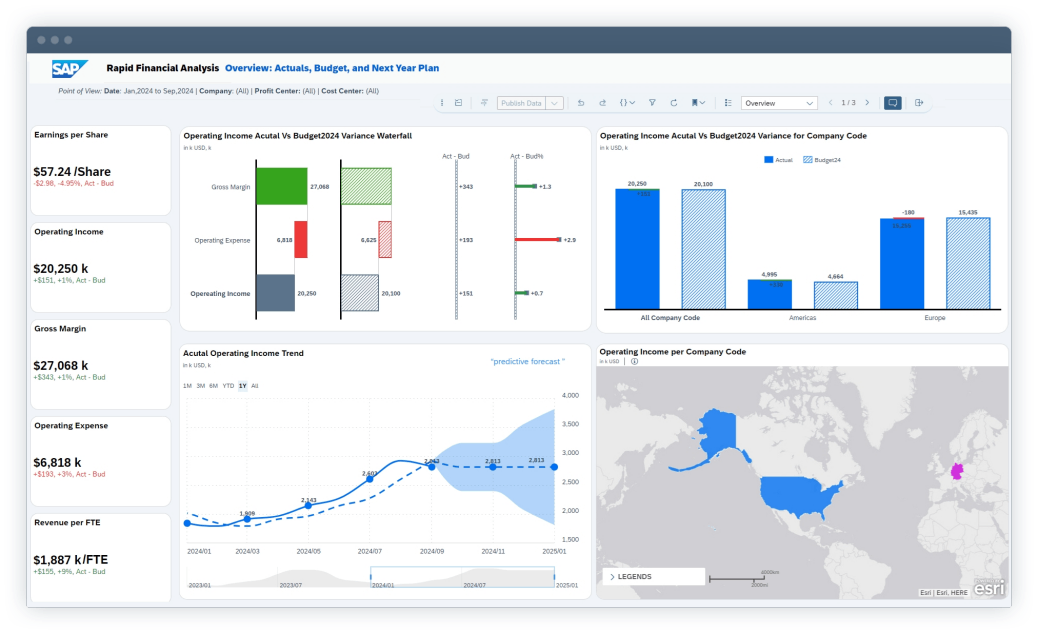
SAP Analytics Cloud (SAC) addresses enterprise-level reporting needs by integrating Business Intelligence, Augmented Analytics, and Enterprise Planning into a unified platform.
Supports multi-page, formatted reports for desktop, mobile, and offline viewing.
Enterprise Planning features include collaborative, versioned planning and workflow task assignments.
Digital Boardroom consolidates KPIs for top management reporting.
Self-service story design and analytic application customization.
Centralized Catalog for published reports.
SAC Publications enables scheduling and emailing reports in multiple formats.
Real-time dashboards provide instant insights into KPIs and business metrics.
Hybrid deployments integrate on-premise SAP systems with cloud analytics.
SAC’s AI-powered analytics, customizable dashboards, and automated reporting features make it a leading choice for large organizations seeking advanced reporting software.
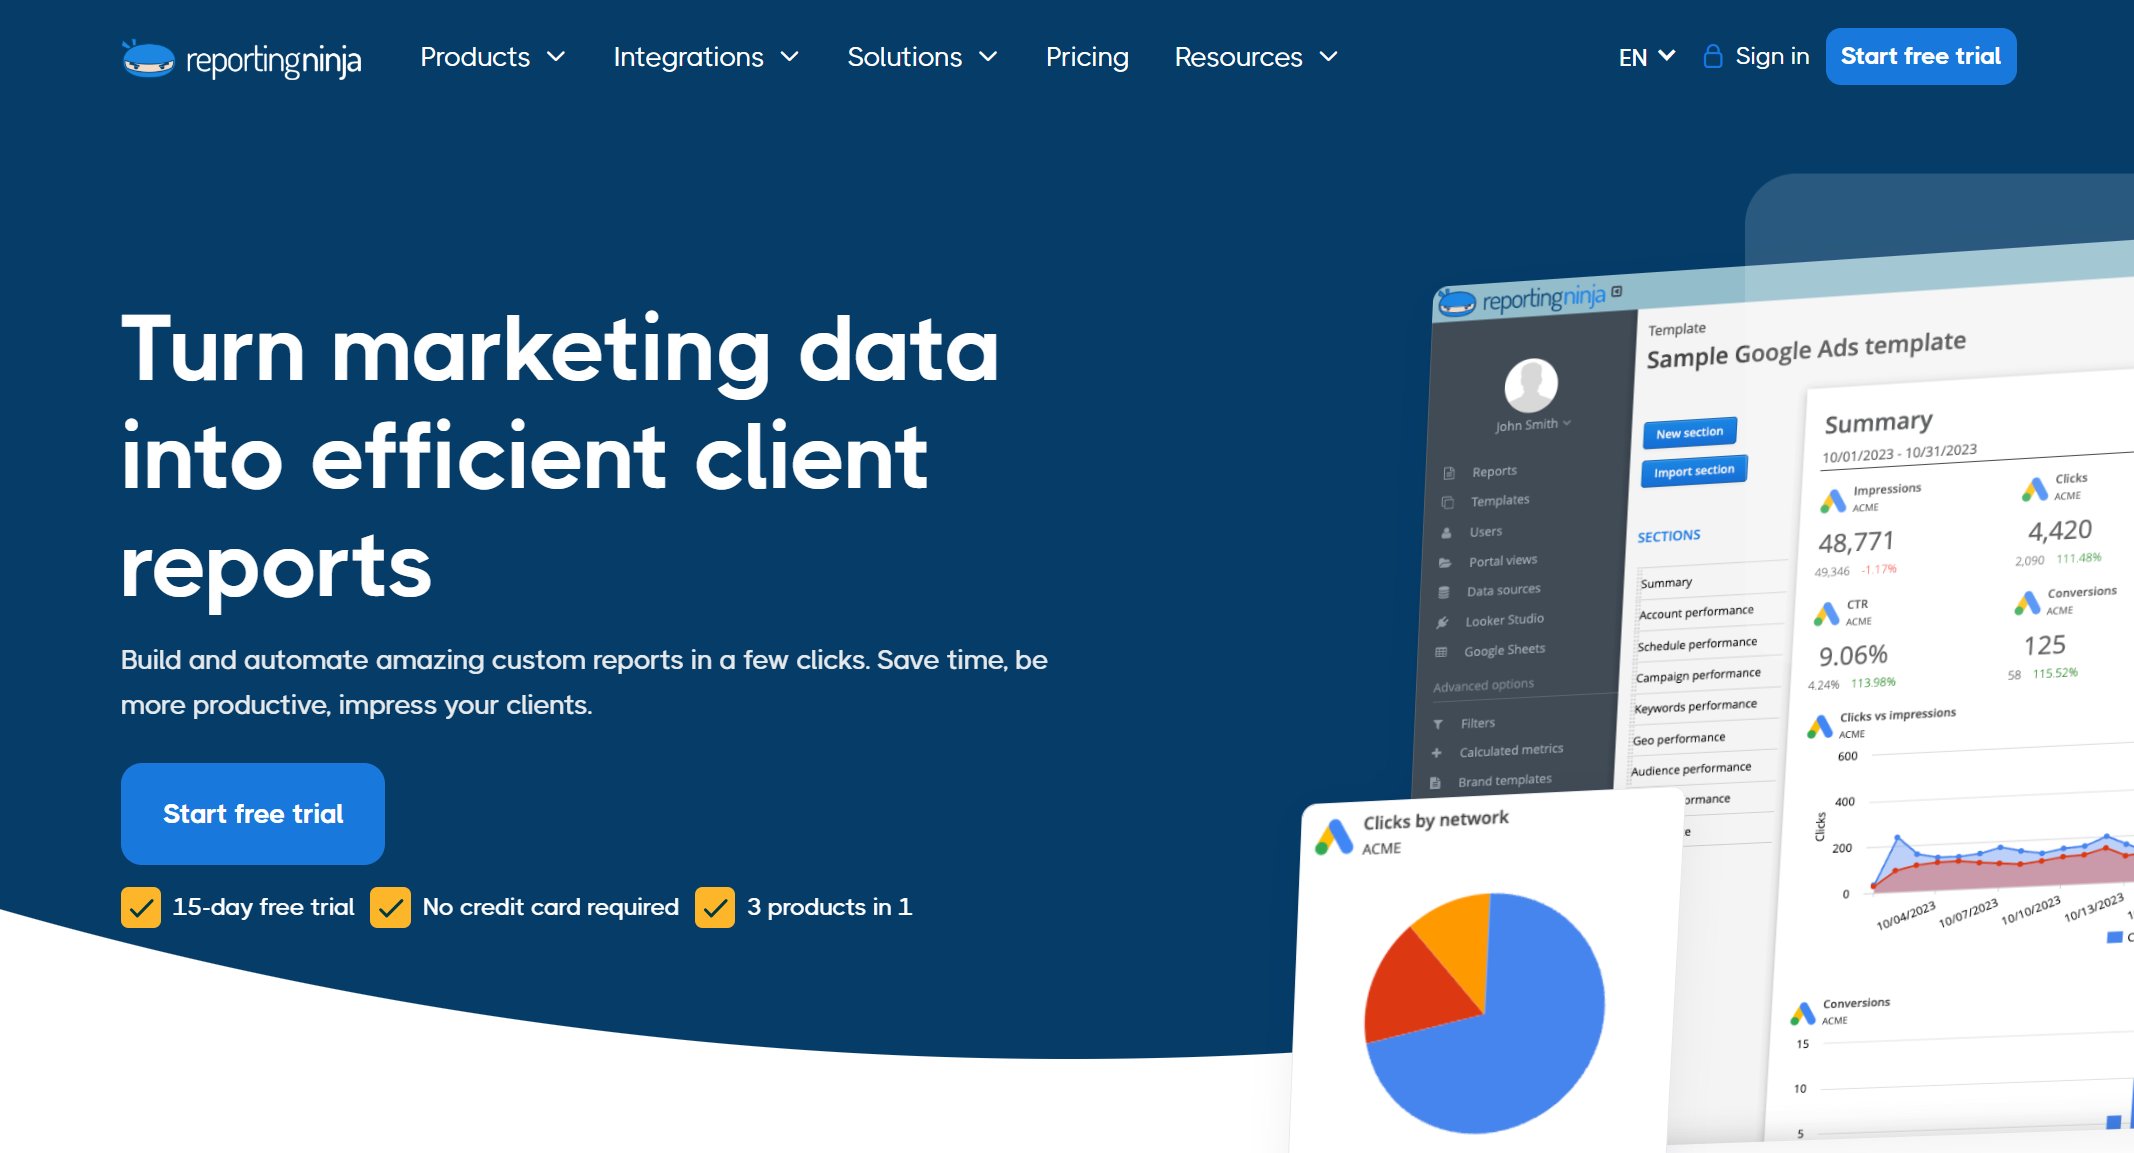
Reporting Ninja is one of the best client reporting tools for digital agencies. The platform automates client reporting, consolidates data from multiple marketing platforms, and creates customizable and scheduled reports. Users can build interactive dashboards and visual dashboards to optimize marketing campaigns.
Automates client reporting to save time and reduce errors.
Consolidates data from PPC, SEO, email, and social media platforms.
Creates customizable reports and scheduled reporting workflows.
Provides real-time insights for campaign optimization.
Supports cross-platform reporting for ad spend, conversions, and ROAS.
Enables agencies to manage multiple client accounts with consolidated reports.
Reporting Ninja’s automated reporting and AI-driven analytics help agencies deliver consistent, accurate client reports and dashboards.
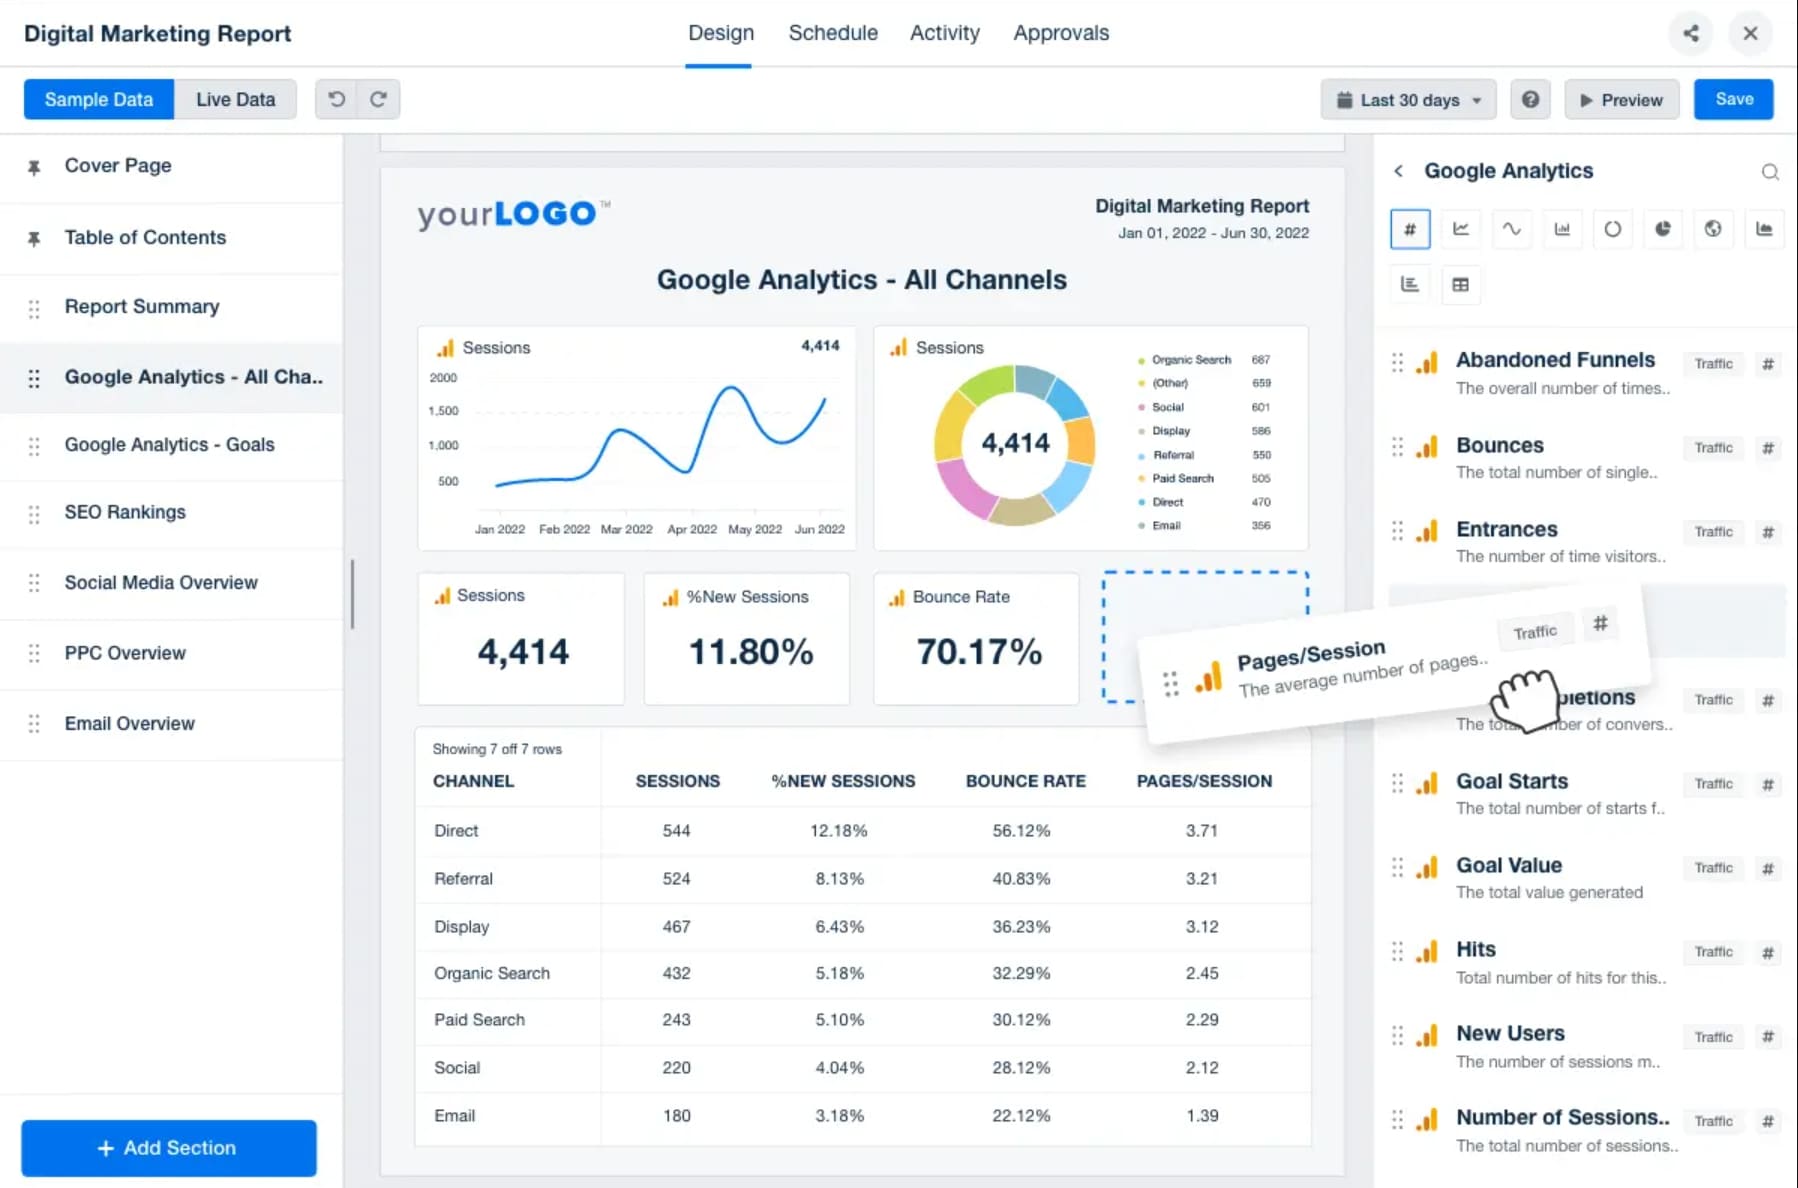
AgencyAnalytics facilitates client reporting for marketing agencies with automated, customizable dashboards and reports. The platform integrates with over 80 platforms, consolidating client data for streamlined reporting.
Automated dashboards and reports aligned with client goals.
Integration with Google Analytics, Google Ads, Facebook, Instagram, Shopify, LinkedIn, and more.
Automation saves time and supports scalability.
Data visualization, contextual narrative, and white-label branding for professional reports.
Granular user permissions and mobile responsiveness.
Regular dashboard updates to reflect client priorities.
Balances automated reporting with personalized insights.
One Firefly, a growing marketing agency, improved its reporting workflow by centralizing client data and automating monthly reports with AgencyAnalytics. The platform’s AI-powered analytics, interactive dashboards, and automated reporting features help agencies deliver consistent, transparent client reports.
Reporting Tools Software Comparison
Selecting the right reporting software can transform how organizations manage data, generate reports, and visualize insights.The following tables provide a quick reference for comparing the top 12 reporting tools software. These comparisons focus on reporting features, pricing, and user ratings, helping businesses identify the best fit for their needs.
Features Table
Tool
Reporting Features
AI Capabilities
Data Integration
Dashboards
Real-Time Data
Visual Dashboards
Interactive Dashboards
Live Dashboards
FineReport
Flexible report designer, pixel-perfect reports, automated scheduling, mobile BI
Yes
500+ sources
3D, mobile, web
Yes
Yes
Yes
Yes
Tableau
AI analytics, Salesforce integration, drag-and-drop reports
Businesses should evaluate reporting features, AI integration, and support for real-time data when choosing a solution.
Pricing Table
Tool
Pricing Model
Starting Price (USD)
Notes
FineReport
Quote-based
Custom
Enterprise-level, scalable
Tableau
Tiered per user
$35-$115/user/month
Upfront license options available
Power BI
Per user/month
$9.99 (Pro), $20 (Premium)
Free desktop version
Qlik Sense
Subscription
Custom
Contact sales for details
Zoho Analytics
Tiered per month
$24-$455/month
Based on users and data volume
Domo
Quote-based
Custom
High onboarding fees
Looker
Quote-based
Custom
Premium pricing
Adverity
Quote-based
Custom
Marketing analytics focus
Funnel
Tiered by ad spend
$499/month
For up to $100K ad spend
SAP Analytics Cloud
Subscription
Custom
Enterprise planning included
Reporting Ninja
Subscription
From $20/month
Agency-focused
AgencyAnalytics
Tiered by client accounts
From $12/client/month
White-label options
Pricing varies widely. Organizations should consider both features and scalability when reviewing reporting software costs.
Key Factors for Choosing Reporting Tools Software
Scalability
Scalability remains a critical factor for any business evaluating reporting tools. As organizations grow, their data volumes and user demands increase. Scalable business intelligence tools handle these changes without performance loss or costly upgrades. Cloud-based business intelligence platforms, such as FineReport, offer modular designs that evolve with business needs. These solutions support multi-entity reporting, global operations, and real-time data integration. Businesses that select scalable reporting software avoid bottlenecks and ensure long-term value.
Ease of Use
Ease of use determines how quickly teams adopt new reporting solutions. User-friendly business intelligence tools feature intuitive interfaces, drag-and-drop report creation, and pre-built templates.These features allow users with minimal technical skills to generate dashboards and reports efficiently. FineReport provides an Excel-like designer, reducing the learning curve and enabling rapid deployment. Mobile responsiveness and dedicated apps further support busy professionals who need access to insights on the go.
Integration
Integration capabilities define the overall utility of reporting tools in complex IT environments. Leading business intelligence software connects seamlessly to CRM, ERP, marketing, and cloud services. This integration enables businesses to aggregate data from multiple sources, automate reporting, and build comprehensive dashboards. FineReport excels in this area, supporting over 500 data sources and offering real-time data updates. Effective integration ensures that organizations maintain a single source of truth for data-driven decision-making.
Security
Security stands at the forefront of enterprise reporting requirements. Businesses demand robust data protection, including encryption, access controls, and audit trails. Reporting tools must comply with regulations such as HIPAA and GDPR. FineReport delivers advanced security features, ensuring sensitive information remains protected. Real-time alerts and activity tracking further enhance operational safety and transparency.
Support
Reliable support ensures smooth implementation and ongoing success with reporting software. Comprehensive vendor support, including 24/7 chat and email assistance, helps businesses resolve issues quickly. FineReport offers dedicated support channels, empowering organizations to maximize the value of their business intelligence tools.
Tip: When evaluating reporting features, businesses should consider the types of reports, interactive dashboards, automation, and collaboration tools available.
Factor
Explanation
Types of Reports
Strategic, analytical, and operational reporting for diverse business needs
Interactive Dashboards
Real-time monitoring and customizable views for key metrics
Comprehensive Data Management
Integration and automation across multiple sources for accuracy and efficiency
Advanced Data Visualization
Dynamic charts and graphs for quick insights
User-Friendly Interface
Intuitive design for easy adoption
Security
Data protection, access controls, and encryption
Scalability
Ability to handle growing data and user demands
Selecting the right reporting tools software drives measurable business success. Businesses should define clear goals, evaluate features, and involve stakeholders in the decision process.
FineReport stands out for scalable, flexible, and enterprise-level reports, helping businesses unlock actionable insights and support growth.
Real-time insights to optimize production, logistics, and decisions.
FAQ
What is reporting tools software?
Reporting tools software helps businesses collect, analyze, and present data in visual formats like dashboards and reports. These tools support better decision-making by turning raw data into actionable insights.
How does FineReport by FanRuan support mobile reporting?
FineReport offers mobile BI capabilities. Users can access dashboards and reports on smartphones or tablets. The platform provides responsive layouts and dedicated apps for real-time insights anywhere.
Can reporting tools integrate with existing business systems?
Most leading reporting tools, including FineReport, connect with CRM, ERP, and cloud platforms. Integration ensures seamless data flow and unified reporting across all business systems.
What security features do top reporting tools provide?
Top reporting tools use encryption, access controls, and audit trails. These features protect sensitive data and help businesses meet compliance requirements.
How do businesses choose the right reporting tool?
Businesses should assess their data needs, integration requirements, and user skills. Comparing features, pricing, and support options helps identify the best fit for their goals.