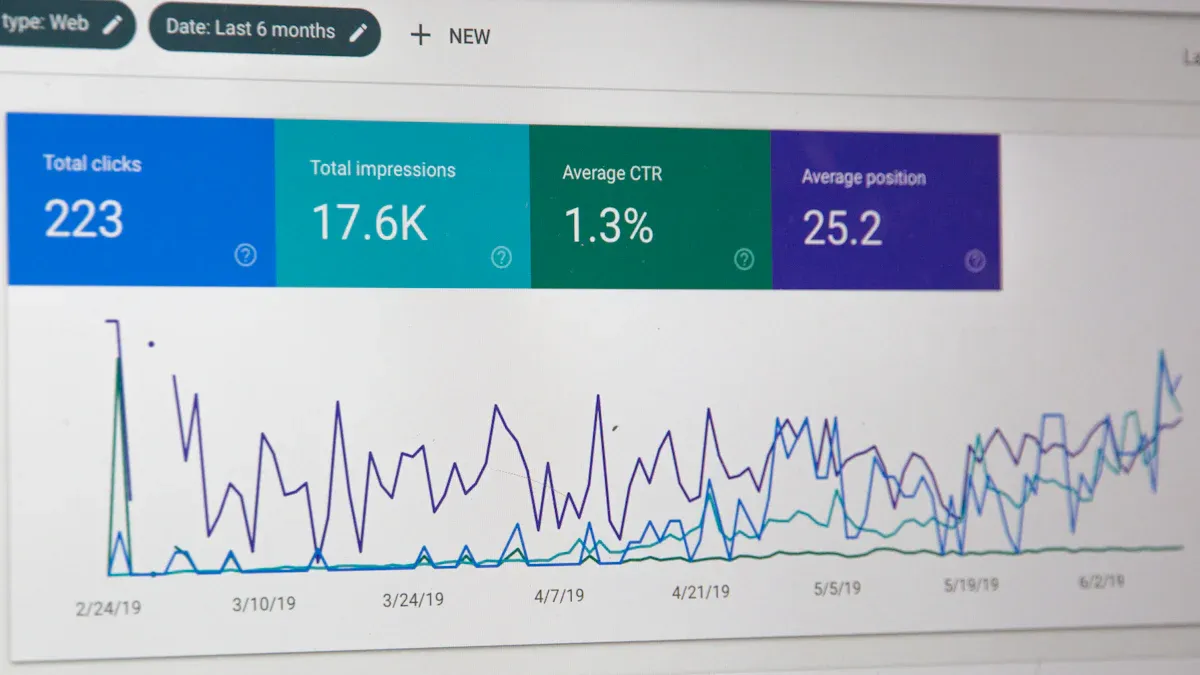
Dashboard development services help you turn scattered business data into clear, actionable insights. You can see the importance of dashboards when you look at how 62% of businesses use analytics to make faster decisions and lower reporting costs.
| Statistic | Value |
|---|---|
| Percentage of businesses using analytics | 62% |
| Faster decision-making rate | 30% |
| Reduction in reporting costs | 25% |
When you use custom dashboards like those from FineReport, you unlock the benefits of dashboards for tracking sales, monitoring patient care, and improving productivity. These tools let you analyze your data and make informed decisions that drive performance.
Dashboard development services help you turn raw data into clear, interactive dashboards that support your business goals. You use these services to collect, organize, and display information in a way that makes sense for your team. In business intelligence, dashboard development services play a key role. They let you see important trends, track key performance indicators, and make better decisions every day.
FineReport stands out as a leading solution in this space. Many organizations choose FineReport because it offers flexible, user-friendly features. You can create custom dashboards with drag-and-drop tools, connect to many data sources, and design reports that fit your needs. Users from different industries praise FineReport for its ability to unlock the full potential of their data and make complex information easy to understand.

A strong dashboard brings together several important parts. Each part works together to give you a complete view of your business. Here is a table that shows the main components you will find in a well-designed dashboard:
| Component | Description |
|---|---|
| Visualization Tools | Tools that help you turn complex data into charts, graphs, and other visuals. |
| Widgets | Small displays that let you see data in different ways, tailored to your needs. |
| Real-time Data Updates | Features that keep your dashboard current, so you always see the latest information. |
You also need dashboard integration services to connect your dashboard to different data sources. These services make sure your dashboard pulls in the right data from databases, files, or cloud platforms. You can use analytics feeds, operational syncs, and even multicloud reporting to combine information from many places. This gives you a single view of your business, no matter where your data lives.
Data accuracy matters, too. Data dashboard development services use integration testing, real-time monitoring, and strong data governance to keep your information reliable. You can trust your dashboard to show the right numbers every time.
You follow a clear process when you build a dashboard. Each step helps you create a tool that fits your needs and supports your goals. Here is how dashboard development services usually work:
You start by gathering requirements. You talk with your team to find out what decisions you want to support and which key performance indicators matter most. You make sure your data is clean and ready to use. You design the dashboard with input from different departments, so it works for everyone.
Testing is a big part of the process. You check your dashboard under different scenarios to make sure it works well and shows accurate results. You also train your users, so they know how to read the dashboard and use its features.
Here is a table that shows the main functions of dashboard development services in business intelligence:
| Function | Description |
|---|---|
| Requirements Gathering | Identify the decisions you want to support and define your KPIs. |
| Data Preparation | Make sure your data is clean, consistent, and well-managed. |
| Design and Development | Work with your team to create visuals that meet your needs. |
| Testing | Test your dashboard for accuracy and performance. |
| User Training | Teach your team how to use the dashboard and understand the data. |
You can also use data visualization services to make your dashboard more engaging. These services help you create charts, graphs, and maps that make your data easy to understand. With custom data analytics dashboards, you can focus on the metrics that matter most to your business.
FineReport makes this process simple. You can use its drag-and-drop designer, connect to many data sources, and build dashboards that work on any device. Many users say FineReport helps them reach their goals faster and with less effort. You can trust FineReport to deliver custom dashboard solutions that fit your needs.

Tip: When you use a dashboard, you get a clear view of your business. You can spot trends, catch problems early, and make smarter choices every day.
You can choose from several types of custom dashboards to meet your business needs. Each dashboard serves a unique purpose and helps you monitor, analyze, and plan for success. The table below shows the main categories of data dashboards and their descriptions:
| Dashboard Type | Description |
|---|---|
| Strategic Dashboard | Focuses on key performance indicators (KPIs) for quick understanding and immediate answers. |
| Operational Dashboard | Shows current state and work progression, identifying problems without deep data insights. |
| Analytical Dashboard | Helps assess trends and predict outcomes based on historical data, making sense of large data volumes. |
Operational dashboards give you a real-time view of your business activities. You can track metrics like accounts receivable turnover, days sales outstanding, gross profit margin, working capital, and return on equity. These dashboards help you see how your business performs at any moment. You can use them in departments such as marketing, human resources, sales, IT, logistics, and customer service. For example, you might monitor ticket volume in customer service or order accuracy in logistics.

Tip: Operational dashboards automate data collection and reporting. You save time and streamline workflows. Your team can focus on analysis instead of manual data entry.
Operational dashboards provide a centralized source of information. You can share insights across departments and improve collaboration. Everyone stays aligned with the same data, which supports better decision-making.
Analytical dashboards help you dive deeper into your data. You can use predictive analytics to forecast trends, anomaly detection to spot unusual spikes, cohort analysis to study user groups, and user segmentation to understand customer patterns. These dashboards simplify complex datasets and make them interactive. You can organize, visualize, analyze, and track data with ease.

Analytical dashboards enhance productivity. You uncover insights that drive better decisions. You can customize visualizations and consolidate large datasets into charts and graphs. This hands-on approach helps you explore trends and patterns in your business.
Strategic dashboards support high-level planning and executive decisions. You get a clear overview of performance across key business areas. These dashboards guide strategic planning and help you uncover trends for future investments. You can analyze data from different perspectives, identify performance gaps, and spot new opportunities.
Strategic dashboards align your goals with KPIs. You see how daily performance connects to broader objectives. This alignment transforms data into actionable intelligence. Everyone in your organization understands their role in reaching strategic goals.
FineReport gives you the flexibility to create custom dashboards for any purpose. You can use report blocks, charts, and widgets to build interactive dashboards. FineReport supports adaptive, absolute, unfixed, and fixed layouts. You can set canvas sizes for HD, UHD, 2K, or wide screens, or enter custom dimensions. You start with a new dashboard and adjust the layout to fit your needs. FineReport makes it easy to design dynamic dashboards that work for any business scenario.


You want a dashboard that fits your business. FineReport gives you many ways to customize your dashboard. You can choose from different layouts, such as adaptive, absolute, or tab layouts. You can reuse components to build dashboards faster. You can link components so that clicking one chart updates others with new data. This makes it easy to monitor data trends and track performance across your organization.
| Feature | Description |
|---|---|
| Multi-screen self-adaptation | Dashboards adapt to tablets, phones, and large screens. |
| Abundant visual elements | Use tables, charts, and widgets to display information. |
| Multiple layout types | Pick from adaptive, absolute, or tab layouts. |
| Component reuse | Save time by reusing dashboard parts. |
| Component linkage | Click one part to refresh others with related data. |
| Data monitoring | See real-time updates as back-end data changes. |
| Auto carousel | Show different charts and tabs in rotation. |
FineReport connects to many data sources. You can pull in data from relational databases, NoSQL systems, APIs, and files. This means you do not need to move your data. You can break down information silos and make clearer decisions.

FineReport integrates multiple data sources into a report system to keep your business data connected.
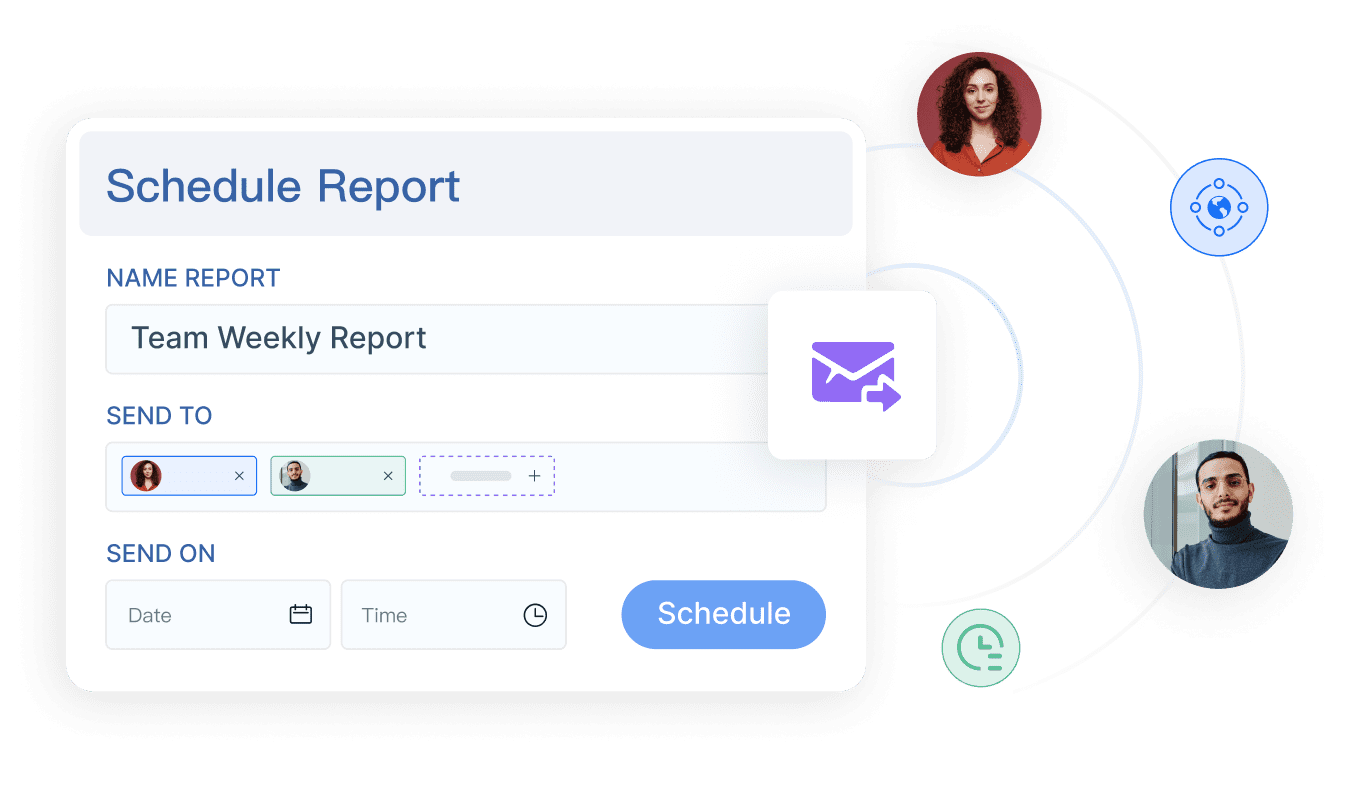
You need to see what is happening in your business right now. Real-time data analysis lets you respond quickly to changes. With FineReport, you get dashboards that update instantly as new data comes in. This supports faster decision-making and real-time performance tracking.
| Benefit | Description |
|---|---|
| Enhanced Decision-Making | React quickly to changes with up-to-date dashboards. |
| Improved Understanding | Visualizations help you spot trends and outliers fast. |
| Better Operational Awareness | See all your operations in one place. |
| Proactive Problem Solving | Find and fix issues as they happen. |
| Streamlined Data Analysis | Save time by automating data presentation. |
| Improved Performance Monitoring | Track KPIs visually and meet your goals. |
| Better Customer Analysis | Watch customer behavior and adjust right away. |
You can access your dashboard on any device. Mobile dashboards give you quick access to essential data. You can make decisions on the go. The design stays simple and clear, so you do not get lost in too much information.

You want your data to stay safe. FineReport uses data encryption to protect your information. Access controls make sure only the right people see sensitive data. Auditing and monitoring tools help you spot and respond to security issues fast.
FineReport also helps your team work together. You can set fine-grained permissions so each person sees only what they need. Shared annotations and comments let your team discuss and give feedback right on the dashboard. You can even make handwriting notes and share them by email or WeChat on mobile devices.
| Feature | Benefit |
|---|---|
| Shared Annotations | Team members add comments and insights directly on dashboards. |
| Comments | Discuss and give feedback to improve communication. |
| Fine-Grained Permission Control | Only authorized users access sensitive data, keeping your dashboard secure. |
With these features, you can build dashboards that help your team collaborate, stay secure, and make better decisions every day.
When you use a business dashboard, you gain a clear view of your operations. Dashboards help you track key metrics and spot trends quickly. You can make data-driven decisions with confidence because you see real-time updates and visual summaries. For example, retail companies use dashboards to centralize data and access critical metrics, which leads to faster insights and better choices. In telecom, dashboards optimize inventory and supply chain performance, helping teams make decisions across regions.
Dashboards save time. At DS Smith, the marketing team saved over 30 working hours each month by switching to dashboard services. This extra time lets you focus on strategy instead of manual data tasks.
Dashboards also drive continuous improvement. You can identify inefficiencies and find new opportunities for process optimization. Operational dashboards provide ongoing visibility, so you can react quickly to issues and keep productivity high.
Dashboards synthesize large amounts of information into manageable insights. You can customize your business dashboard to focus on the data that matters most. This approach improves accuracy and ensures you always work with current information. Real-time data updates keep your dashboard reliable, and interactive elements let you explore details that static reports might miss.
Dashboards also support accessibility. You can present data in visual and textual formats, making insights available to all users, including those with disabilities. This broadens your audience and ensures compliance with standards.
FineReport helps you unlock the full value of your business dashboard. In finance, dashboards automate report generation and integrate data from multiple sources, making financial analysis faster and more accurate. In manufacturing, dashboards monitor production efficiency and quality control, allowing managers to track key metrics and respond to issues in real time.
BOE Technology Group used dashboards to consolidate fragmented data and standardize metrics. This led to a 5% reduction in inventory costs and a 50% increase in operational efficiency. KPI dashboards enabled centralized monitoring and cross-factory benchmarking, supporting smarter, data-driven decisions.

With dashboards, you empower your team to collaborate, improve performance, and build a data-driven culture.
Investing in dashboard development services gives your business a strong edge. You gain real-time insights, track goals, and optimize resources. FineReport helps you unlock the full value of your data with easy-to-use, customizable dashboards. You can see the long-term benefits in the table below:
| Advantage | Description |
|---|---|
| Real-time insights | See your operations clearly and make quick decisions. |
| Goal tracking | Monitor progress and keep your team accountable. |
| Resource optimization | Find and fix inefficiencies to use resources wisely. |
Custom dashboards help you stay competitive and make smarter choices every day.
What is a KPI Dashboard and Why Your Business Needs One
What is a Digital Dashboard and How Does It Work
How to Craft an Effective Analytics Dashboard

The Author
Lewis
Senior Data Analyst at FanRuan
Related Articles

Payment Analytics Dashboard: 12 KPIs Every Operations Leader Should Track to Cut Revenue Leakage
Losing revenue to declines? Discover 12 essential KPIs to track in your payment analytics dashboard to stop leakage and manage disputes.
Lewis Chou
May 05, 2026

SOC Dashboard Explained: 12 Essential KPIs, Views, and Workflows Security Teams Use
Learn about SOC dashboards, the 12 essential KPIs for security teams, and how they centralize alerts and workflows for faster threat detection and response.
Lewis Chou
May 05, 2026

EMR Dashboard Guide: 12 Metrics to Track for Faster Clinical and Operational Decisions
Learn the 12 essential EMR dashboard metrics to track for faster clinical and operational decisions, improving patient flow and revenue cycle management.
Lewis Chou
May 05, 2026


