A SIEM dashboard is a centralized interface that displays real-time data and analytics from your security information and event management system. You use a SIEM dashboard to monitor security events, detect threats, and track compliance across your organization. Real-time monitoring and fast threat detection keep your environment safe. Advanced BI tools, such as FineBI, enhance these dashboards with powerful analytics and visualization. Many enterprises face challenges with SIEM, including integration hurdles, resource constraints, and data onboarding issues, as shown in the table below.
| Challenge | Description |
|---|---|
| Integration Hurdles | Difficulty integrating SIEM tools with existing security systems, affecting holistic security views. |
| Resource Constraints | High resource demands in time, money, and skilled personnel, especially for smaller organizations. |
| Data Onboarding Challenges | Issues with normalizing and standardizing diverse data sources, impacting threat detection effectiveness. |
SIEM Dashboard Overview
What Is a SIEM Dashboard
A SIEM dashboard gives you a unified view of your organization’s security landscape. You use a SIEM dashboard to collect, display, and analyze data from multiple security sources in real time. This dashboard acts as your command center for monitoring security events, tracking incidents, and visualizing trends. By bringing together logs, alerts, and analytics, a SIEM dashboard helps you quickly identify and respond to threats.
You benefit from a SIEM dashboard because it aggregates data and correlates logs and events across all your systems. For example, you can link an error on a server to a blocked connection on a firewall. This connection helps you understand the context of security events and improves your detection capabilities.
Role in Security Information and Event Management
A SIEM dashboard plays a central role in security information and event management. It collects and consolidates data from various sources, such as firewalls, servers, and endpoints. The dashboard enables you to correlate multiple data points into meaningful security events. This process allows you to spot patterns and detect threats that might go unnoticed if you only look at isolated incidents.
SIEM dashboards provide continuous monitoring by collecting and analyzing log data in near real time. Security teams receive alerts for high-priority incidents within seconds, enabling proactive defense against fast-moving threats like ransomware.
| Component | Functionality |
|---|---|
| Data Aggregation | Collects and consolidates data from various sources for analysis. |
| Correlation and Analysis | Combines multiple data points into meaningful security events. |
| Real-time Monitoring | Provides continuous monitoring and alerts for high-priority incidents. |
| Incident Response | Facilitates quick response to detected threats and incidents. |
| Security Data Analytics | Offers live dashboards for visualizing security data and trends. |
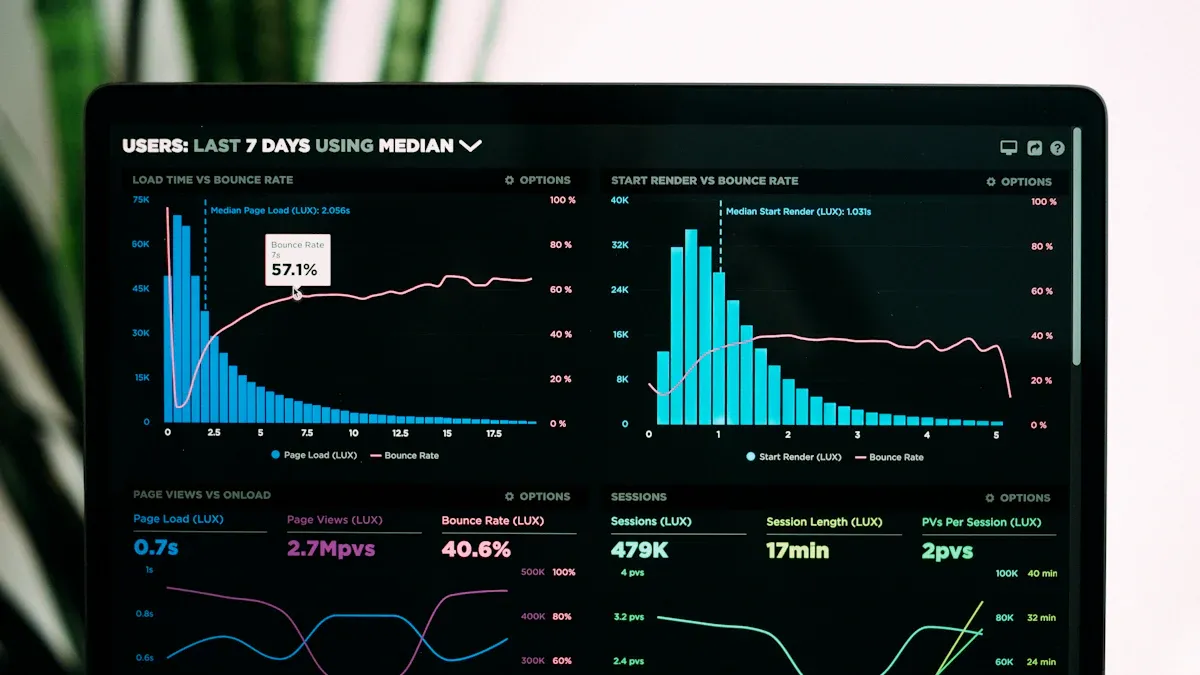
Real-Time Security Monitoring
You rely on a SIEM dashboard for real-time security monitoring. The dashboard continuously collects and analyzes log data, giving you immediate alerts for high-priority incidents. This real-time visibility enables you to detect threats as they emerge and respond quickly. Modern SIEM dashboards use advanced analytics and machine learning to improve detection accuracy and reduce false positives. You can customize your dashboard to focus on the most critical security metrics, helping you prioritize your response.
- SIEM dashboards aggregate data from various sources, providing a unified view of security events in real time.
- They enable the correlation of different events across multiple machines or timeframes, enhancing threat detection.
- Dashboards offer customizable correlation rules and real-time visualizations of security incidents, making it easier for security teams to analyze and respond to threats.
A SIEM dashboard supports your proactive threat detection efforts. You gain real-time visibility, automated response capabilities, and advanced analytics, all of which strengthen your organization’s security posture.
SIEM Dashboard Features
Data Aggregation and Correlation
You rely on a SIEM dashboard to bring together data from many security systems. SIEM collects logs and events from servers, network devices, cloud environments, and endpoints. The dashboard aggregates this data and normalizes it into a consistent format. This process makes it easier for you to analyze and compare information from different sources.
With a SIEM dashboard, you can spot patterns and detect threats that might go unnoticed if you only look at single events. The dashboard uses correlation rules to link related events. For example, you might see multiple failed login attempts on a server and a spike in firewall alerts. The SIEM dashboard connects these events, helping you identify a possible brute-force attack.
SIEM features for data aggregation and correlation include:
- Collecting logs and events from diverse sources across your IT environment.
- Normalizing data into a unified format for effective analysis.
- Correlating events to detect suspicious activity and security threats.
- Categorizing deviations from normal behavior to support advanced threat detection.
You face technical challenges when you try to achieve accurate data correlation. Poor log quality can lead to missed threats. If you lack context enrichment, you may not prioritize alerts correctly. You need to tune detection rules continuously. If you rely on AI, you must adjust it for your environment to avoid irrelevant alerts.
| Challenge Type | Description |
|---|---|
| Log Quality | Poor quality logs can lead to ineffective data correlation and missed threats. |
| Context Enrichment | Lack of enriched context can result in alerts that are not prioritized correctly, affecting response. |
| Continuous Tuning | Without ongoing adjustments, detection rules become outdated, leading to performance degradation. |
| Reliance on AI | AI systems require proper environmental tuning; otherwise, they may generate irrelevant alerts. |
Alerting and Incident Response
A SIEM dashboard gives you real-time alerts for security incidents. The dashboard monitors aggregated data and uses correlation rules to trigger alerts when it detects suspicious activity. You receive notifications for high-priority incidents, which helps you respond quickly and reduce the risk of damage.
In enterprise settings, leading security teams achieve response times under two hours for incident alerts. This speed is the gold standard in the industry. The SIEM dashboard supports automated incident response workflows. It pulls in data from many sources, identifies and prioritizes suspicious activity, and maintains a centralized system for tracking incidents. You can use intuitive dashboards to view the status of ongoing investigations and measure your security performance.
SIEM features for alerting and incident response include:
- Automated ingestion and analysis of security data.
- Centralized case management for tracking incidents.
- Customizable dashboards for monitoring incident response processes.
- Improved security performance through unified reporting.
You benefit from enhanced incident response because the SIEM dashboard streamlines your workflow. It helps you track incidents, prioritize alerts, and coordinate your team’s actions. You can measure your response times and identify areas for improvement.
Compliance Reporting
You use a SIEM dashboard to meet regulatory requirements and maintain audit trails. The dashboard generates reports that address common compliance standards, such as PCI DSS, HIPAA, GDPR, and SOX. These reports show auditors that you monitor access to sensitive systems and protect critical data.
| Compliance Standard | Description |
|---|---|
| PCI DSS | Ensures security controls for organizations handling credit card transactions, monitoring access to sensitive systems. |
| HIPAA | Enforces guidelines for protecting sensitive medical information, monitoring access to healthcare systems. |
| GDPR | Regulates data protection for EU citizens, ensuring breach detection and notification. |
| SOX | Protects the integrity of financial reporting, monitoring financial systems for unauthorized changes. |
The SIEM dashboard helps you maintain detailed audit trails. It securely retains logs, which creates a reliable record for regulators. You can use real-time alerts and clear reports to demonstrate the effectiveness of your security controls. Forensic analysis features allow you to investigate incidents and meet legal requirements for remediation.
| Evidence | Description |
|---|---|
| Log Management | SIEM securely retains logs, creating a reliable audit trail that satisfies regulators' requirements for data transparency and accountability. |
| Real-time Alerts | SIEM tools provide clear dashboards and reports, demonstrating the effectiveness of controls to auditors, ensuring compliance with regulatory requirements. |
| Forensic Analysis | SIEM tools maintain detailed audit trails that help meet regulatory requirements and investigate incidents, crucial for remediation and legal purposes. |
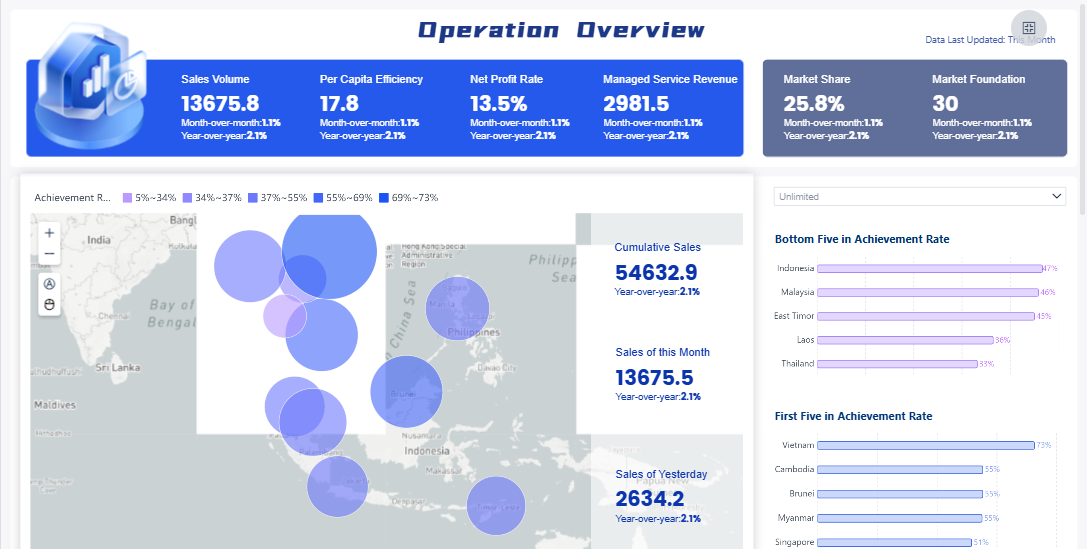
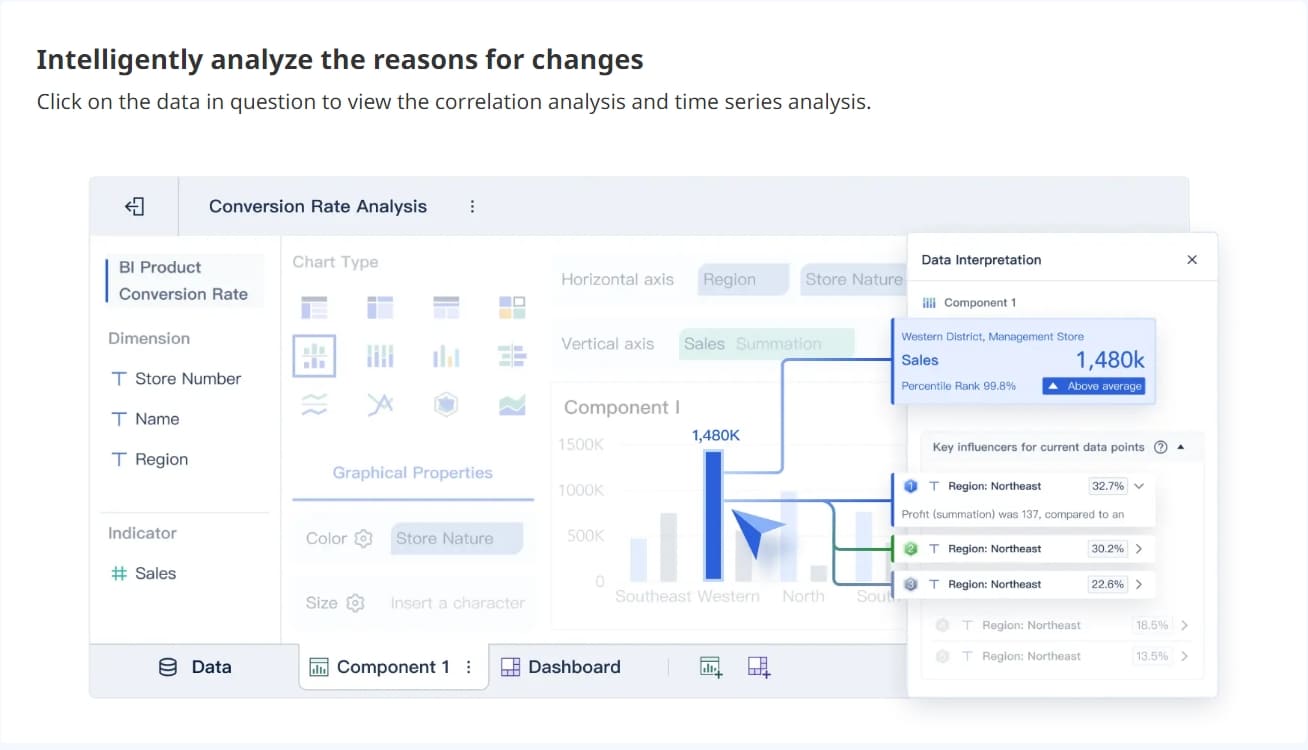
Advanced Analytics with FineBI
You can enhance your SIEM dashboard with advanced analytics and visualization by integrating FineBI. FineBI connects to over 60 types of data sources, including databases, cloud warehouses, and APIs. You can bring together security data from across your organization for unified analysis. FineBI’s drag-and-drop interface lets you build interactive dashboards without coding skills.
With FineBI, you gain real-time analytics and self-service exploration. You can apply filters, drill down into incidents, and visualize trends in security events. FineBI supports role-based access control, so you can share dashboards securely with your team. The platform’s high-performance engine processes large datasets, making it suitable for enterprise-scale security monitoring.
FineBI’s features include:
- Seamless data integration from multiple security systems.
- Real-time visualization and filtering of security events.
- Augmented analytics for improved threat detection and response.
- Enterprise-grade collaboration and governance.
The BOE customer story shows the practical benefits of using FineBI for security analytics. BOE faced challenges with fragmented data and inconsistent metrics. By implementing FineBI, BOE built a unified data warehouse, standardized metrics, and created KPI dashboards. This transformation led to a 5% reduction in inventory costs and a 50% increase in operational efficiency. The SIEM dashboard, powered by FineBI, enabled BOE to monitor performance, detect risks early, and support data-driven decision-making.
You can achieve similar results by leveraging FineBI’s advanced analytics with your SIEM dashboard. You improve operational efficiency, enhance your security posture, and support compliance with industry standards. FineBI helps you move toward next generation SIEM, where advanced threat detection and real-time insights drive better outcomes for your organization.

SIEM Dashboard Benefits
Enhanced Threat Detection
You rely on a SIEM dashboard to strengthen your security posture and improve threat detection. The dashboard centralizes data from multiple systems, allowing you to spot threats quickly. Machine learning and AI analyze large volumes of security data, detecting anomalies and patterns that traditional methods may miss. Predictive algorithms prioritize alerts and reduce false positives, streamlining your security operations.
- AI and deep learning techniques enhance cybersecurity efficiency.
- Predictive models help you identify both zero-day threats and known attack patterns.
- SIEM dashboards process larger data volumes faster, supporting improved threat detection.
You see measurable improvements after implementing a SIEM dashboard. Organizations report reduced exposure time to critical vulnerabilities, fewer security incidents, and better compliance audit scores. The table below summarizes these benefits:
| Improvement Type | Measurable Benefit |
|---|---|
| Security Posture Improvements | Reduction in critical vulnerability exposure time |
| Decrease in security incident frequency | |
| Improvement in compliance audit scores | |
| Operational Efficiency Gains | Time savings in security reporting |
| Faster incident response times | |
| Reduced manual compliance preparation | |
| Financial Benefits | Avoided breach costs |
| Reduced audit and compliance costs | |
| Improved cyber insurance premium rates | |
| ROI Calculation | Organizations typically achieve 300-400% ROI within 18 months of dashboard implementation. |
Streamlined Compliance
A SIEM dashboard helps you meet regulatory requirements with less effort. You automate evidence collection, transforming compliance from a slow, error-prone process into a streamlined workflow. Centralized logging enables faster review and audit preparation. Built-in compliance reports and dashboards provide proof of adherence to security controls.
- Real-time analytics deliver immediate insights for compliance monitoring.
- Automated data collection and report generation reduce the time and resources needed for compliance tasks.
- Scheduling reports in advance streamlines access review and minimizes manual effort.
- SIEM dashboards maintain detailed records of system and user activities, supporting regulatory standards.
You benefit from clear workflows and consistent documentation, which enhance speed and precision. Effective integration minimizes inconsistencies, helping you make informed decisions and maintain compliance.
Improved Decision-Making with FineBI
You use a SIEM dashboard to gain a centralized view of your organization’s systems. FineBI enhances this capability by integrating with various security systems and providing advanced analytics. Real-time monitoring facilitates faster threat detection and incident response. You access interactive dashboards that visualize key metrics, trends, and incidents.
| Benefit | Description |
|---|---|
| Centralized Security Management | SIEM dashboard integrates with existing security systems |
| Enhanced Security Posture | Provides a unified view for improved decision-making |
| Real-Time Monitoring | Enables faster threat detection and incident response |
| Improved Compliance Reporting | Offers better audit trails and reporting functions |
| Advanced Analytics | Leverages machine learning for improved threat detection |
FineBI empowers you to collaborate across teams, share insights securely, and act on data-driven decisions. You reduce manual effort, improve operational efficiency, and support next generation SIEM strategies. The combination of SIEM dashboard and FineBI drives improved threat detection, enhanced incident response, and better business intelligence for your organization.
A SIEM dashboard gives you a clear view of your security environment. You can detect threats, monitor compliance, and respond quickly. FineBI takes your SIEM dashboard further by adding advanced analytics and real-time reporting. You gain tools for deeper analysis and better teamwork. Traditional tools often lack these features. FineBI supports unified metrics and AI-driven insights, making your security management more effective. Consider an integrated BI solution like FineBI to strengthen your security operations and improve decision-making.

Continue Reading About SIEM Dashboard
Best Dashboard Apps for Business Insights
What is a Call Center Dashboard and Why Does It Matter
What is a Reporting Dashboard and How Does it Work
What is An Interactive Dashboard and How Does It Work
What is a Call Center Metrics Dashboard and How Does It Work


FAQ

The Author
Lewis
Senior Data Analyst at FanRuan
Related Articles

How to Build an Investment Portfolio Reporting Dashboard for Executives: KPIs, Benchmarks, and Drill-Down Views
Investment portfolio reporting for executives is not about showing every holding, transaction, and chart your investment team can produce. It is about giving CEOs, CFOs, CIOs, boards, and investment committees a fast, re
Yida YIn
Jun 25, 2026

12 KPI Reporting Examples for Executive Dashboards: What to Show in Weekly, Monthly, and Quarterly Reviews
Executive leaders do not need more data. They need decision ready $1 examples that match how often they review the business and what actions they are expected to take. A weekly $1 should surface fast moving risks and per
Yida YIn
Jun 25, 2026

How to Build a Digital Marketing Reports Dashboard: Executive Examples, KPIs, and Templates
A $1 is the control layer that helps executives and marketing leaders turn scattered channel data into fast, confident decisions. If you are a CEO, CMO, operations director, or marketing analytics lead, the real problem
Yida Yin
May 07, 2026