Poor dashboard navigation is not a design issue alone. In enterprise BI, it is an operational drag. When users cannot move quickly from a high-level KPI to the exact view behind a problem, time-to-insight increases, confidence drops, and decisions slow down.
For IT managers, analytics leaders, and operations directors, the cost is measurable: more support tickets, more duplicate reports, lower BI adoption, and slower response to exceptions. Effective dashboard navigation solves this by guiding users from question to answer with minimal friction.
In enterprise environments, that challenge is amplified. Teams work across multiple departments, large data volumes, layered permissions, and hundreds of dashboards. A navigation model that works for a small reporting app often fails when finance, operations, sales, and supply chain all need different paths into the same BI ecosystem.
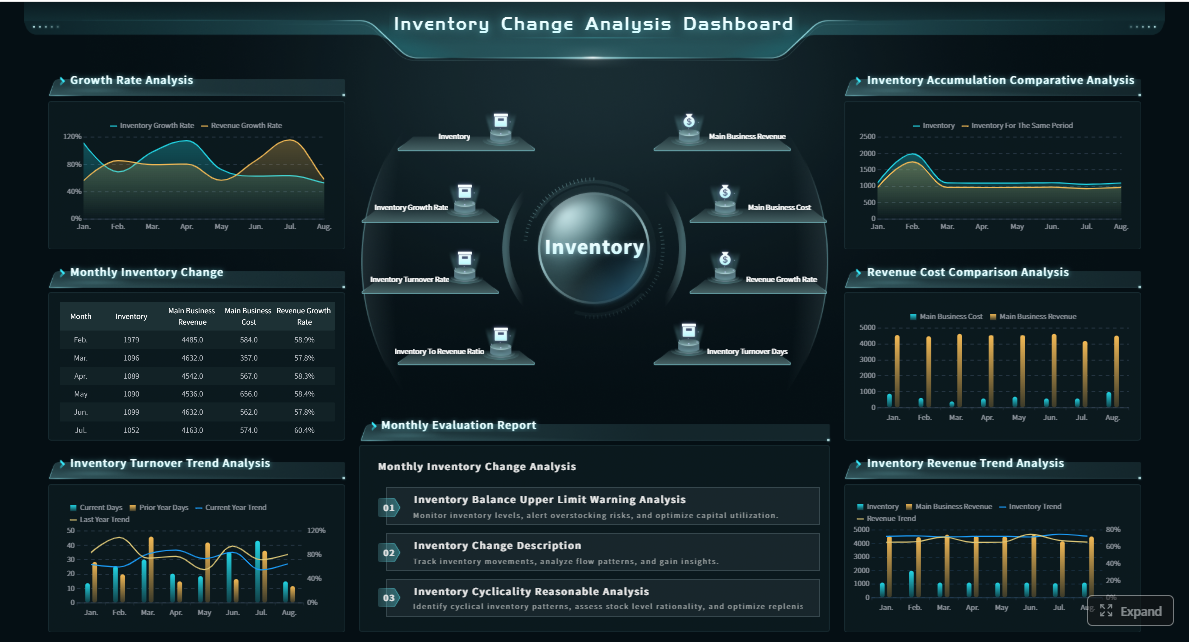
Click To Try The Dashboard
Why dashboard navigation matters in enterprise BI
Time-to-insight is the time it takes a user to move from opening a BI environment to finding the information needed to make a decision. That includes locating the right dashboard, understanding where they are, applying the correct filters, and drilling into the right level of detail.
When dashboard navigation is well designed, users can:
Reach critical metrics faster
Trust that they are viewing the correct report
Move from summary to root cause without confusion
Compare related views across functions
Act on insights without asking for help
When it is poorly designed, even accurate dashboards underperform. Users hesitate, click back and forth, open the wrong report, or abandon the workflow entirely.
Enterprise BI makes navigation harder for three reasons:
High reporting volume
Large organizations often have dozens or hundreds of dashboards, reports, and drill paths.
Multiple user roles
Executives, analysts, regional managers, and operational teams all need different entry points and levels of detail.
Cross-functional reporting
A revenue issue might require moving across sales, inventory, marketing, and finance views. Navigation must support that journey cleanly.
Common signs that users are getting lost before reaching the right view include:
Heavy dependence on search for basic dashboards
Frequent backtracking between pages
Low use of drill-down features
Repeated requests for direct links from support teams
Duplicate dashboards built because users cannot find existing ones
Long delays between alert detection and root-cause analysis
Key Metrics (KPIs) for dashboard navigation performance
If you want to improve navigation, measure it like an operational process.
Time-to-Insight: Total time from dashboard entry to decision-ready understanding.
First-Click Success Rate: Percentage of users whose first action leads them toward the correct report or path.
Task Completion Time: Time required to complete a defined reporting task.
Backtracking Rate: Frequency of users returning to previous pages or menus due to confusion.
Navigation Depth: Number of clicks required to reach a target KPI or report.
Search Dependence: How often users rely on search instead of intuitive menu paths.
Drill-Through Success Rate: Percentage of users who successfully move from overview to detailed analysis.
Dashboard Adoption Rate: Share of intended users who actively use dashboards over time.
Support Ticket Volume: Number of help requests related to finding reports, understanding pathways, or access issues.
Saved View Usage: Frequency of shortcuts, favorites, or personalized entry points being used effectively.
Dashboard navigation principles that reduce time-to-insight
Start with the most common user tasks
The best enterprise dashboard navigation starts with business decisions, not org charts. Users do not think in terms of data ownership, semantic layers, or reporting team boundaries. They think in terms of tasks:
What changed?
Where is performance off target?
Which region, product, or account needs attention?
What should I investigate next?
That means your entry points should reflect recurring workflows such as:
Executive performance monitoring
Daily operations review
Exception management
Forecast variance analysis
Sales pipeline inspection
A seasoned BI team avoids structuring navigation around internal categories like “data warehouse,” “marketing dataset,” or “shared reporting assets.” Those labels make sense to developers, not business users.
Instead, prioritize the shortest route to:
High-value KPIs
Active alerts
Most-used reports
Standard drill-down paths
Exception-focused views
If the landing experience does not help users answer their top question in seconds, navigation is already failing.
Apply information architecture that supports scanning
Enterprise users do not read dashboards line by line. They scan. Good information architecture supports rapid orientation and fast choice-making.
To make scanning easier:
Group related content in predictable sections
Use plain-language labels instead of internal jargon
Keep category names mutually exclusive where possible
Avoid exposing too many choices at once
Present a clear hierarchy from overview to detail
A strong structure might look like this:
Overview: Enterprise-wide scorecards and alerts
Performance Areas: Sales, operations, finance, service
Exceptions: Late shipments, margin decline, SLA breaches
Deep Analysis: Trend, root cause, transaction-level detail
This structure helps users build confidence because they understand the logic of the system. They do not have to guess whether “Operations Summary,” “Ops Analytics,” and “Fulfillment Insights” are different or overlapping.
The practical goal is simple: users should move from a high-level metric to the right detailed view without hesitation.
Choose the right navigation pattern for the layout
There is no universal menu style for enterprise BI. The right pattern depends on reporting complexity, available screen space, user roles, and how much persistent context users need while analyzing data.
When vertical navigation works better
Vertical navigation is usually the better choice for complex BI ecosystems. It supports:
Large dashboard collections
Deep hierarchies
Role-based sections
Persistent access to categories and filters
Easier scaling as more dashboards are added
For enterprises with many reports and multi-step drill paths, a sidebar often provides the most stable experience.
When horizontal navigation suits simpler workflows
Horizontal navigation works well when:
The number of top-level destinations is limited
Reporting paths are shallow
Users switch between a small set of views
Screen width can accommodate all primary tabs clearly
It can be effective for focused executive overviews or department-specific workspaces, but it becomes strained when too many tabs compete for attention.
Why sidebar-based patterns often outperform in enterprise BI
Sidebar navigation can keep critical orientation elements visible without crowding the main reporting canvas. It is especially useful when users need to see:
Primary sections
Current location
Available drill paths
Saved views
Role-specific access areas
Filter context
In mature BI programs, sidebars often provide the flexibility needed to manage growth without redesigning the entire experience every quarter.
10 ways to improve dashboard navigation in enterprise BI
1. Design a clear landing view
Your landing view should answer the top business question immediately. For an operations leader, that might be: “Where are we off target today?” For a sales VP, it may be: “Which segment is missing plan?”
A good landing view includes:
A concise summary of core KPIs
Alerts or exceptions at the top
Obvious next-step actions
Links to the most likely drill-down paths
Do not force users to choose among five similar dashboards before they understand what is happening.
Best practice: Build the landing screen around one primary decision, then support adjacent questions through visible navigation cues.
2. Keep labels specific and user-centered
Vague labels create hesitation. Enterprise users should never have to interpret menu names like “Insights Hub,” “Performance Center,” or “Data Portal” unless those labels are universally understood internally.
Use labels that reflect tasks and outcomes, such as:
Revenue by Region
Order Fulfillment Delays
Margin Variance Analysis
Customer Churn Risk
Inventory Exception Dashboard
This improves first-click accuracy and reduces training overhead.
Consultant advice: If a new user cannot predict what they will see from the menu label alone, rewrite the label.
3. Limit menu depth
Every extra click adds time, uncertainty, and abandonment risk. In enterprise BI, users should not have to navigate through a maze of categories just to find a weekly KPI dashboard.
Aim to reduce:
Excessive nested folders
Overlapping menu trees
Hidden report libraries
Unnecessary landing pages between destination views
A practical target is to keep critical dashboards within a short, direct path from the primary entry point.
Best practice steps:
Identify the top 20% most-used dashboards.
Measure the number of clicks required to reach each one.
Promote any high-value report that takes too many steps.
Archive or consolidate low-value destinations that clutter the path.
4. Maintain consistent placement and behavior
Users build speed through repetition. When menus, filters, drill actions, and breadcrumbs shift between pages, cognitive load increases immediately.
Keep these elements in predictable locations:
Main menu
Global filters
Local filters
Breadcrumb trail
Export or share actions
Drill-down controls
Consistency matters as much as clarity. A user should not have to relearn navigation on each dashboard.
Rule of thumb: If one dashboard uses a left sidebar and another hides navigation in a top dropdown without a clear reason, the experience will feel fragmented.
5. Use sidebar navigation for complex ecosystems
When your BI environment includes multiple departments, role-specific paths, and dozens of recurring reports, sidebar-based dashboard navigation is often the most scalable option.
It helps by:
Preserving hierarchy
Keeping navigation visible
Supporting expandable categories
Separating top-level sections cleanly
Creating room for favorites, recent items, and saved views
This is especially valuable in enterprises where users need to switch between overview dashboards and detailed operational reports frequently.
Implementation tip: Keep the sidebar concise at the first level. Expand depth only when the user enters a relevant section.
In enterprise BI, users often arrive from alerts, search, bookmarks, or cross-dashboard drill-throughs. Without orientation cues, they can lose track of context quickly.
Breadcrumbs help users understand:
Where they are now
Which parent section they came from
How to move back efficiently
Orientation cues can also include:
Clear page titles
Filter summaries
Section headers
Active tab highlighting
“Viewing as” role indicators
These elements reduce backtracking and improve user confidence during multi-step analysis.
7. Separate global navigation from local navigation
This is one of the most overlooked navigation design principles.
Global navigation moves users across the BI environment, such as between sales, finance, operations, and executive reporting.
Local navigation helps users move within one dashboard or report area, such as switching tabs, sections, or drill states.
When these are blended together, users confuse page-level exploration with ecosystem-level movement.
To avoid that:
Use one persistent structure for major destinations
Use a distinct pattern for within-dashboard movement
Visually separate the two with placement, size, or styling
Keep local navigation scoped to the current analytical task
This distinction becomes critical as BI environments grow in complexity.
8. Surface shortcuts to high-priority views
Many enterprise workflows are repetitive. Users return to the same dashboards, the same filtered states, and the same exception queues every day.
Support these habits with shortcuts such as:
Favorites
Recent dashboards
Saved views
Team-specific quick links
Alert-driven entry points
Pinned reports for recurring reviews
Shortcuts reduce friction dramatically for power users while preserving a clean structure for everyone else.
Consultant advice: Do not make every user start from the homepage every time. Enterprise productivity improves when repeat paths are one click away.
9. Design for search and discovery
Even excellent menu structures cannot cover every user behavior. Some users naturally browse. Others prefer to search.
A mature enterprise BI environment should support both.
Useful discovery mechanisms include:
Search with strong metadata and synonyms
Recent items
Suggested reports
Tagged dashboard categories
Role-based recommendations
“Related dashboards” links from current views
Search should not compensate for bad navigation, but it should accelerate discovery when users know roughly what they need.
Best practice steps:
Standardize dashboard naming conventions.
Tag dashboards by function, role, process, and business topic.
Improve search relevance using common business terms.
Add contextual suggestions based on current usage patterns.
10. Test navigation with real users and real tasks
Navigation should never be finalized based on internal assumptions alone. The only reliable test is watching real users complete real tasks.
For example:
Can a regional manager find underperforming stores in under two minutes?
Can a finance analyst trace margin decline from summary to transaction detail without guidance?
Can an operations lead move from an SLA breach alert to the causal queue or process stage quickly?
Use realistic scenarios, not generic usability prompts.
A practical testing approach:
Define 3 to 5 high-value user tasks.
Observe users completing them without instruction.
Track first-click success, delays, and backtracking.
Note where labels, hierarchy, or pathways fail.
Refine and retest in short cycles.
That is how enterprise teams move from opinion-based navigation to evidence-based design.
Examples and inspiration for better navigation patterns
What to borrow from strong menu designs
The best navigation menu ideas are not about visual novelty. They are about reducing friction while preserving clarity at scale.
Patterns worth borrowing include:
Task-based groupings: Organize by business action, not technical backend.
Progressive disclosure: Show high-level sections first, then reveal detail when relevant.
Persistent sidebars: Keep major destinations visible in dense reporting environments.
Contextual quick actions: Add shortcuts to commonly repeated analytical tasks.
Clear state indication: Make the active page, filter context, and drill level obvious.
Cross-links between related views: Let users move laterally when analysis spans functions.
These patterns work because they reflect how enterprise users investigate problems: they start broad, narrow quickly, and need orientation throughout.
How to evaluate visual examples critically
A polished example can still be a poor fit for enterprise BI. When reviewing dashboard navigation examples, assess them through a business usability lens.
Focus on:
Usability: Can users predict where to go next?
Density management: Does the layout handle many reports without becoming cluttered?
Accessibility: Are labels readable, controls obvious, and keyboard interactions supported?
Scalability: Will the structure still work after 50 more dashboards are added?
Role adaptability: Can executives and analysts both use the system effectively?
Context retention: Do users stay oriented during drill-downs and cross-dashboard transitions?
Be careful with designs that look elegant in a static mockup but fail under enterprise conditions. A minimal menu may appear clean, but if it hides critical paths behind multiple interactions, it increases cognitive load in practice.
How to measure whether navigation improvements are working
Track time-to-insight and navigation efficiency
You cannot improve navigation sustainably without instrumentation. Start with a baseline, then compare before and after changes using defined user tasks.
Building enterprise dashboard navigation at scale with FineBI
The methodology is clear: structure navigation around user tasks, reduce menu depth, separate global and local movement, add orientation cues, support search and shortcuts, and measure the result with time-to-insight metrics.
But building this manually is complex. In enterprise BI, navigation is not just a menu problem. It touches dashboard architecture, permissions, role-based access, drill paths, layout standards, searchability, and ongoing governance. Maintaining all of that across a growing BI estate can quickly overwhelm internal teams.
That is where FineBI becomes a practical advantage.
Building this manually is complex; use FineBI to utilize ready-made templates and automate this entire workflow.
FineBI helps enterprise teams operationalize strong dashboard navigation by enabling:
Ready-made dashboard templates that promote consistent layout and hierarchy
Flexible navigation structures for different departments and roles
Faster creation of landing pages, drill paths, and summary-to-detail flows
Better management of large dashboard ecosystems without excessive manual design work
Standardized user experiences that improve adoption and reduce support dependency
For BI leaders, the value is not just speed of development. It is the ability to create a scalable navigation system that stays usable as data volume, user count, and reporting complexity grow.
If your current BI environment relies on tribal knowledge, bookmarked links, and repeated training just to help users find the right report, the issue is not adoption alone. It is architecture. FineBI gives you a faster path to fixing it with less reinvention and more standardization.
In enterprise BI, faster insight rarely comes from adding more dashboards. It comes from helping users reach the right one instantly. That is the real business case for better dashboard navigation.
FAQs
Dashboard navigation is the system of menus, links, filters, drill paths, and page structures that helps users move from a high-level view to the exact report or detail they need. In enterprise BI, it is critical because users often work across many dashboards, roles, and data domains.
When users cannot quickly find the right dashboard or drill into the cause of an issue, they waste time backtracking, searching, or opening the wrong reports. That delay reduces confidence and slows decisions.
Start by designing entry points around common tasks for executives, managers, analysts, and operational teams instead of internal data structures. Role-based landing pages, clear labels, and consistent drill paths make navigation easier for each audience.
Useful KPIs include time-to-insight, first-click success rate, task completion time, backtracking rate, search dependence, and drill-through success rate. These metrics show whether users can reach the right insight with minimal friction.
A clear hierarchy from overview to detail usually works best, with sections for core performance areas, exceptions, and deeper analysis. The goal is to help users scan quickly, understand where they are, and move to root cause without confusion.
Product Trial
FineReport
Pixel-perfect reports · Interactive dashboards · Easy data entry · Digital twins